Scaling the Web
Load Testing of Web Sites Daniel A. Menascé • George Mason University •
[email protected]
evelopers typically measure a Web application’s quality of service in terms of response time, throughput, and availability. Poor QoS translates into frustrated customers, which can lead to lost business opportunities. At the same time, company expenditures on a Web site’s IT infrastructure are a function of the site’s expected traffic. Ideally, you want to spend enough, and no more, allocating resources where they’ll generate the most benefit. For example, you shouldn’t upgrade your Web servers if customers experience most delays in the database server or load balancer. Thus, to maximize your ROI, you must determine when and how to upgrade IT infrastructure. One way to assess IT infrastructure performance is through load testing, which lets you assess how your Web site supports its expected workload by running a specified set of scripts that emulate customer behavior at different load levels. Here, I describe the QoS factors load testing addresses, how to conduct load testing, and how it addresses business needs at several requirement levels.
D
QoS Measures QoS is key to assessing how well Web-based applications meet customer expectations on two primary measures: availability and response time. Availability Availability measures the percentage of time customers can access a Web-based application. Availability goals typically vary according to the application type. Critical applications, such as online brokerage, often have more stringent requirements than other applications, such as online travel sites. However, even in industries where availability is less critical, it is always crucial to a company’s bottom line. In addition to application type, availability requirements can vary according to the time of day 70
JULY • AUGUST 2002
http://computer.org/internet/
or for special events. During high market volatility, for example, online brokerage sites must be available as close to 100 percent of the time as possible. Likewise, online ticket brokers must exhibit high availability when tickets for a concert or sporting event go on sale. Unfortunately, at just these times, Web sites are subject to “flash crowds” that stretch resources to their limits, sometimes leading to rejected user requests and decreased availability. Finally, Web or e-commerce site availability also varies for different customers: ISPs and networks provide different levels of service to customers, depending on their geographic location. Response Time Another key QoS factor for Web and e-commerce sites is response time. With Web-based environments, you must measure end-to-end response time to determine how customers perceive such things as page download and keyword search times. Also, when defining end-to-end response time, you must distinguish between the download time for the base HTML page and that for other page components, such as images and ad banners. A customer’s perception of a Web application’s response time varies according to many different factors — some of which are outside your site’s environment. These factors include ■ ■ ■ ■ ■
your site’s ISP, the customer’s ISP, the customer’s ISP-connection bandwidth, which networks route packets from the customer to your Web site, and the delays imposed by your Web site’s thirdparty services (such as content delivery networks that provide images and streaming media, or ad networks that provide banners).
Clearly, measuring response time from a single geo-
1089 -7801/ 02/$17.00 ©2002 IEEE
IEEE INTERNET COMPUTING
Load Testing Throughput Performance monitor
graphical location and specific time window will not give you a complete picture. End-to-end response time is time- and space-dependent, and you must know how users from different locations, with different connectivity, perceive your site’s performance at different times of day. According to recent measurements by Keynote Systems (www.keynote.com), for example, from 21 January to 11 February 2002, the International Olympics Committee site delivered variable response times for users around the world, ranging from an average of more than 9.0 seconds for users in Asia to 3.97 seconds for users in Europe.
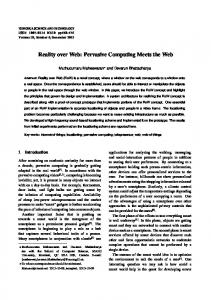
Load Testing As Figure 1 shows, load testing lets you measure your site’s QoS performance based on actual customer behavior. When customers access your site, a script recorder uses their requests to create interaction scripts. A load generator then replays the scripts, possibly modified by test parameters, against the Web site. How It Works The load generator mimics browser behavior: It continuously submits requests to the Web site, waits for a period of time after the site sends a reply to the request (the think time), and then submits a new request. The load generator can emulate thousands of concurrent users to test Web site scalability. Each emulated browser is called a virtual user, which is a key load-testing concept. A load test is valid only if virtual users’ behavior has characteristics similar to those of actual users. You must therefore ensure that your virtual users
Load Script recorder Web site
Internet User interaction scripts Test parameters
Load generator
Figure 1.The load-testing process.The script recorder creates user interaction scripts based on actual requests.The load generator then sends a realistic load, based on scripts and test parameters, to the Web site, and a monitor measures its performance. ■
potential lost revenue throughput,1 which is the amount of money in customers’ shopping carts that was not converted into sales per unit time due to session abandonment.
During the time a Web site is subject to the load generated by virtual users, we measure its performance and obtain metrics such as response time and throughput for each load intensity value — that is, based on the number of virtual users.
Failure to mimic real user behavior can generate totally inconsistent results. Because customers who abandon a session use fewer site resources than those who complete it, for example, planning your infrastructure capacity assuming that all started sessions will be completed can lead you to overprovision the site. Also, if you fail to consider session abandonment, you cannot accurately quantify important business metrics1 such as:
When to Use It Several circumstances call for load testing. Suppose, for instance, that you anticipate a significant traffic increase to your site following a marketing campaign. In place of what is now a peak of 3,000 session starts per hour, you’re expecting twice that. Currently, your dial-up customers experience an average 6.5-second response time on search requests, the most critical e-business function. What will be the response time when the site’s load increases to 6,000 sessions per hour? As another example, suppose that you’re adding new functionality to the site or redesigning Web pages. You must know how this will affect response time before your customers find out; doing so lets you detect potential performance problems and fix them before they occur. Another good time to perform load testing is when you plan to implement IT infrastructure changes.
revenue throughput, which measures the amount of money a Web site generates per unit time (dollars per second, for example), and
Testing Parameters and Results There are three main parameters to vary during a load test:
■ ■ ■
■
follow patterns similar to real users, use realistic think times, and react like frustrated users, abandoning a Web session if response time is excessive.
IEEE INTERNET COMPUTING
http://computer.org/internet/
JULY • AUGUST 2002
71
Scaling the Web 0.25
120
0.20
80 0.15 60 0.10 40 0.05
Throughput Response time
20
0
0
5
10
15
20
Response time (seconds)
Throughput (requests per second)
■ 100
25
0.00
Current requests
Figure 2. Performance versus load. Shown here are two key performance metrics, throughput and response time, as a function of the number of concurrent requests. 0.25
■
Revenue and potential lost revenue throughput, as a function of the number of sessions started per hour. Individual page download times and transaction completion times versus the number of sessions started per hour.
Load Testing and Performance Relationships You can use load testing to predict your Web site’s performance at any load level by simply increasing the number of virtual users until you achieve the desired load. However, running load tests for numerous values with numerous virtual users can be timeconsuming and expensive. You can obtain faster, albeit less accurate, results by combining load testing with analytic or simulation performance models. You can use a few basic performance relationships to speed up scalability analysis with load testing. Consider a scenario in which several virtual users submit requests to a Web site, and let
Response time (seconds)
0.20 ■ ■ 0.15 ■ ■
0.10
■
NVU = number of virtual users. NC = number of concurrent requests a Web site is processing. Z = average think time, in seconds. R = average response time for a request, in seconds. X0 = average throughput, in requests per second.
0.05
Using the Response Time law,2,3 we get the following relationship: 0.00 0
100
200
300
400
500
600
700
800
900
1,000
Virtual users
Figure 3. Response time versus virtual users. A sharp increase in response time occurs after a certain number of virtual users is reached. ■ ■
■
Workload intensity, typically measured in session starts per hour. Workload mix, described by the scripts, which define typical sessions and what customers do in each session type. Customer behavior parameters, including abandonment threshold and think time.
R=
N VU −Z. X0
(1)
A Web site’s throughput is a function of the load level — the number NC of concurrently executing requests — and the service demands these requests make on individual site resources (processors, storage devices, and networks, for example). We define a request’s service demand — Di — at resource i as the average total time the request spends receiving service from the resource.3 This time does not include queuing time, and is therefore independent of the load level. Given this, we can write that
Typical load test results include X0(NC) = f (D1,...,DK,NC) ■
72
JULY • AUGUST 2002
Number of completed and abandoned sessions per hour, as a function of the number of started sessions per hour. http://computer.org/internet/
(2)
to indicate that throughput is a function of load level and the service demands on a Web site’s K IEEE INTERNET COMPUTING
Load Testing
resources. Because the same is true for response time, we can write that: R(NC) = g(D1, ... ,DK,NC).
pricing; and intellectual property considerations. At this level, you need load-testing tools that help you:
(3) ■
So, combining equations 1-3, we get ■
NVU = [R(NC) + Z] × X0(NC).
(4)
We can now use either an analytic or simulation model to predict response time and throughput for different values of the NC load level, and use equation 4 to estimate the number of virtual users we need to generate a given value of NC. Load-testing tools are quite useful here. They can, for example, generate scripts for a few virtual users to measure service demands, which are load-independent. You can then use the service demands as input parameters to performance models.3 Consider, for example, a Web site that has service demands for processing and I/O of 8 and 9 milliseconds, respectively. Using the Mean Value Analysis method,3 you can compute X0(NC) and R(NC) for various values of NC. Figure 2 shows the resulting curves of R(NC) and X0(NC) versus NC. The figure also shows that for NC = 19, the number of virtual users — computed using equation 4 and assuming an average 8-second think time — would be 897. Figure 3 shows the response time variation as virtual users increase: Once the number approaches 800, response time rapidly increases. You can also estimate the maximum value of site throughput from the service demands by using the upper bound3: X0(NC) ≤ 1/max{Di}.
■
The next framework level is the functional model, which deals with e-business functions that implement the site’s business model. Such functions might include browse, search, select, and add to shopping cart. At this level, you need tools that help you: ■
■ ■
load test functions supported by many different technologies, including Flash, JavaScript, ActiveX, cookies, and SSL; perform load testing for the functions you offer wireless clients; and account for functions that use streaming media.
The next level is the customer behavior model, which deals with users’ navigation patterns through a site. Customers interact with Web sites through sessions, which are basically sequences of consecutive requests that form a navigational pattern that you can capture in graphs, such as the customer behavior model graph (CBMG).1,4 At this level, you need tools that help you:
(5) ■
Thus, in our example, the maximum throughput would be 1 / 0.009 = 111.1 requests per second, which is the horizontal asymptote of Figure 2’s throughput curve.
Tool Requirements There are several important requirements to consider when buying a load-testing tool. Here, I discuss them in relation to the four layers of the hierarchical framework for e-business.3 The top hierarchy level is the business model, which describes the business type (such as B2B, B2C, or C2C); the product type (such as physical goods, digital goods, or services); the revenue-generating model (such as sales, advertising, or referrals); business policies (product return and privacy policies); IEEE INTERNET COMPUTING
track revenue throughput and potential lost revenue throughput, carry out load tests under the most realistic and thorough conditions possible to avoid over- and underprovisioning the IT infrastructure, and understand how business decisions — such as marketing campaigns or new business models — affect the IT infrastructure.
■ ■
flexibly and easily record scripts that represent different types of interactions, easily adapt the load-testing scripts to changes in customer behavior over time, and realistically model customer behavior.
In the latter case, such behaviors might include session abandonment, high response time tolerance for different pages and functions, customer site experience, and different think times. It might also include customer tenacity: how determined customers are to accomplish e-business functions at your Web site. This can vary depending on circumstances. When stock markets are highly volatile, for example, users might be willing to wait longer than usual to trade stocks. The final framework level is a model of IT http://computer.org/internet/
JULY • AUGUST 2002
73
Scaling the Web
resources required to support site activities, such as processors, storage devices, networks, and software components. At this level, you need tools that help you: ■
■
■ ■
test Web applications on a regular basis in the actual production environment (rather than a scaled-down testing version); assess the impact of changes in the system architecture, server types and their capacity, storage devices, software, and networking bandwidth; detect the IT infrastructure elements that are causing performance problems; and carry out load tests on-demand and at scheduled times.
These requirements can serve as a guide in helping you evaluate the various tool and service options available in relation to your needs at different levels. Currently, several companies offer load-testing tools and services, including Keynote Systems (www.keynote.com), Mercury Interactive (www. mercuryinteractive.com), Cyrano (www.cyrano. com), Empirix (www.empirix.com), and Segue (www.segue.com).
Conclusion High-volume Web sites are becoming more complex due to several factors, including the use of third-party services, such as CDNs and ad networks, geographical distribution and duplication, streaming media features, and wireless access. These factors significantly affect Web sites’ performance and scalability, and pose challenges to
designers and users of load-testing tools and services. These challenges stem from both a lower predictability and high variability in measurement results and an increased number of load-testing scenarios to consider. In the future, this situation will be exacerbated as Web sites increase their reliance on dynamically composed Web services.5 In any case, load testing relies on measurements of a site’s performance. Therefore, as the variability in the measurements increases — due to network conditions or thirdparty services — you must collect more data to achieve statistically meaningful results. References 1. D.A. Menascé and V.A.F. Almeida, Scaling for E-Business: Technologies, Models, Performance, and Capacity Planning, Prentice Hall, Upper Saddle River, N.J., 2000. 2. P.J. Denning and J.P. Buzen, “The Operational Analysis of Queuing Network Models,” ACM Computing Surveys, vol. 10, no. 3, Sept. 1978, pp. 225-261. 3. D.A. Menascé and V.A.F. Almeida, Capacity Planning for Web Services: Metrics, Models, and Methods, Prentice Hall, Upper Saddle River, N.J., 2002. 4. D.A. Menascé et al., “A Methodology for Workload Characterization of E-commerce Sites,” Proc. First ACM Conf. Electronic Commerce, ACM Press, New York, 1999, pp. 119-128. 5. S. Vinoski, “Web Services Interaction Models: Part I: Current Practice,” IEEE Internet Computing, May/June 2002, pp. 89-91.
Daniel A. Menascé is a professor of computer science, codirector of the E-Center for E-Business, and director of the MS in e-commerce program at George Mason University. He received a PhD in computer science from UCLA. He is a Fellow of the ACM and a recipient of the A.A. Michelson Award from the Computer Measurement Group.
How to Reach IC Articles: We welcome submissions about Internet application technologies. For detailed instructions and
information on peer review, IEEE Internet Computing’s author guidelines are available online at computer.org/internet/author.htm.
Letters to the Editor: Please send letters, including reference to articles in question, via e-mail to
[email protected].
Reuse Permission: For permission to reprint an article published in IC, contact William J. Hagen, IEEE Copyrights and Trademarks Manager, IEEE Service Center, 445 Hoes Lane, Piscataway, N.J. 08855-1331;
[email protected]. Complete information is available online at computer.org/permission.htm. To purchase reprints, see computer.org/author/reprint.htm. 74
JULY • AUGUST 2002
http://computer.org/internet/
IEEE INTERNET COMPUTING