SECED 2015 Conference: Earthquake Risk and Engineering towards a Resilient World 9-10 July 2015, Cambridge UK
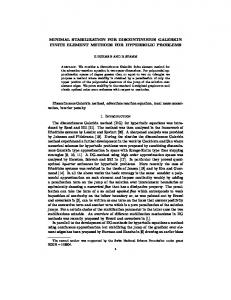
LOADING PROTOCOLS FOR STRUCTURES DESIGNED FOR DIFFERENT BEHAVIOUR FACTORS Panagiotis MERGOS1 and Katrin BEYER2 Abstract: All the existing loading protocols have been developed independently of the value of the behaviour factor q that the structure has been designed for. Conservatively, a single loading protocol is adopted, for all q values, based on the structural system with the most onerous cumulative seismic demands. However, analyses conducted by the authors, show that imposed cumulative seismic demands decrease significantly for structures designed for high behaviour factors. This drives to the conclusion that adopting a single loading protocol for the most demanding q value may lead to the derivation of highly conservative loading protocols for the rest of the structural systems. In this paper, new loading protocols will be developed for structures designed for different behaviour factors. Introduction Performance-based earthquake design and assessment requires reliable estimates of structural members’ strength and deformation capacities. These capacities can often not be predicted accurately by analytical or numerical modelling and experimental testing is required. Most commonly, quasi-static cyclic tests are conducted where predefined displacement histories, named loading protocols, are applied at slow rates. When subjected to cyclic loading, strength and in particular deformation capacity of structural components depend on the imposed cumulative damage demand (Krawinkler et al. 2001). Hence, in order to yield realistic capacity estimates, loading protocols must reflect the estimated cumulative seismic demands on the structural components of interest. Several loading protocols have been developed in the literature for different types of structural and non-structural components. Examples are: SPD protocol (Porter 1987), CUREE protocols (Krawinkler et al. 2001), EN-12512 protocol (EN 2001), FEMA-461 protocols (FEMA 2007) and ISO protocol (ISO 2010). Recently, Mergos and Beyer (2014) developed a suite of loading protocols for different seismicity levels (low to moderate vs. high), hysteretic models, fundamental periods and number of cycles per load step (one, two or three). All loading protocols follow the same analytical form which requires only two parameters to define the amplitudes of each load step. Adopting this approach, instead of proposing a single protocol, provides more representative and less conservative loading protocols for the different structural systems and levels of seismicity. All the existing loading protocols, including the ones proposed previously by the authors (Mergos and Beyer 2014) have been developed independently of the value of the behaviour factor q that the structure has been designed for. Conservatively, a single loading protocol is adopted, for all q values, based on the structural system with the most onerous cumulative seismic demands. Figure 1, presents the variation of the number of damaging cycles N and the sum of normalized, with respect to the maximum, cycle amplitudes Σδi with the behaviour factor q (Mergos and Beyer 2014). The results were obtained by performing 45360 time history analyses on 567 SDOF systems with different behaviour factors, periods of vibration, hysteretic models and hardening ratios. It can be seen that N and Σδi vary significantly and tend to decrease as q increases. This drives to the conclusion that adopting a single loading protocol for the most demanding q value may lead to the derivation of highly conservative loading protocols for the rest of the 1 2
Lecturer, City University, London,
[email protected] Assistant Professor, EPFL, Lausanne,
[email protected]
P MERGOS and K BEYER
structural systems. This observation becomes more important when considering that the higher cumulative demands occur, typically, to structural systems designed for small behaviour factors. Cumulative demands of these systems are developed at small levels of ductility demands. Applying the same cumulative demands to structural systems that develop significant ductility demands becomes even more conservative. In this paper, new loading protocols will be developed for structures designed for different behaviour factors. This will be done by applying the same methodology as described in Mergos and Beyer (2014). It is anticipated that the new loading protocols will reflect better cumulative damage demands of structural systems driving to more realistic estimates of their structural capacities from experiments. b)a)
8
N
6
i
b) b)
30
20
4 10
2 0
0
1
2
3
4
5
0
6
0
1
2
3
4
5
6
q-factor
q-factor
Figure 1. Variation of cumulative damage demands with the behaviour factor: a) Sum of normalized cycle amplitudes Σδi ; b) Number of damaging cycles [Mergos and Beyer 2014]
Selection of ground motions and structural systems Cumulative seismic demands depend strongly on the selected ground motion records and hysteretic behaviour of structural systems. The previous drive to the conclusion that the selected ground motion records and hysteretic models should be representative of the level of seismic hazard and the type of structural system respectively the loading protocols are developed for. In order to establish by means of quasi-static cyclic testing reliable estimates of the deformation capacity at the near collapse limit state ΔNC in accordance with EC8 design objectives, the proposed loading protocols should represent the 2/50 seismic hazard level. For this reason, selection and scaling of the ground motion records in this study aim at representing the cumulative demand imposed by this seismic hazard level. Furthermore, two different levels of seismicity are examined herein. This is the case because previous analyses conducted by the authors of this study (Mergos and Beyer 2014) have shown that the level of seismicity affects importantly cumulative damage effects imposed to structural systems. For high seismicity regions, 20 ground motion records, used in several previous similar studies (e.g. Krawinkler et al. 2001, FEMA-461 2007), are employed. For low to moderate seismicity regions, a set of 60 ground motion records representative of the 2/50 seismic hazard level of the city of Sion in Switzerland is used. More information regarding this ground motion set can be found in Mergos and Beyer (2014). The selected ground motion records are scaled one by one in order to match the spectral acceleration of the horizontal elastic spectrum of EC8 for the 2/50 seismic hazard level at the fundamental period of the structure. The target EC8 elastic spectrum is derived for soil class C.
2
P MERGOS and K BEYER
Table 1. Characteristics of SDOF systems representing different structural systems Structural system
Hysteretic model
T (sec)
r
q-factor
RC frames
‘Fat’ Takeda (FT)
0.15, 0.30, 0.50, 0.75, 1.00, 1.25, 1.50
0.001, 0.01, 0.05, 0.10
1.0, 2.0, 3.0, 4.5, 6.0
RC and masonry shear walls Masonry rocking walls
‘Thin’ Takeda (TT) Flag shaped (FS)
0.10, 0.20, 0.30, 0.50, 0.75, 1.00, 1.50* 0.10, 0.20, 0.30, 0.50, 0.75, 1.00, 1.50
0.001, 0.01, 0.05, 0.10 0.001, 0.005, 0.01, 0.05
1.0, 2.0, 3.0, 4.5, 6.0* 1.0, 1.5, 2.0, 2.5, 3.0
b)
a)
Figure 2. Implemented hysteretic models: a) Takeda model; b) Flag shaped
Cumulative damage effects imposed by ground motions are strongly dependent on the type of structural system. Hence, structural systems representative of those that will be tested need to be examined when developing loading protocols. Following the suggestions by Priestley et al. (2007), the ‘fat’ Takeda hysteretic model is applied for RC frames and the ‘thin’ Takeda hysteretic model for RC walls. The latter can also be used as rough approximation of the hysteretic response of unreinforced masonry shear walls (Mergos and Beyer 2014). For rocking masonry walls a flag-shaped hysteretic model is chosen. Table 1 summarises the range of periods of vibration T and post-yield stiffness ratios r (ratio of post-yield to elastic stiffness) of the SDOF systems that are considered in this study. The characteristics of the SDOF system are reflective of a large portion of the existing building stock in Europe. The q-factors have been chosen following the recommendations of EC8-Part 1. The yield strength Fy of the SDOF systems is calculated from the ordinate of the EC8 design spectrum for the 10/50 seismic hazard level, the period T and the q-factor of the SDOF system. The viscous damping ratio ζ is assumed equal to 5% for all structural systems. To develop representative loading protocols, cumulative seismic demands have to be determined. To serve this goal, nonlinear time history analyses are first carried out by means of the software RUAUMOKO (Carr 2012) using the Newmark constant acceleration integration algorithm and an analysis time step of 0.001s. Tangent stiffness proportional damping was applied as recommended by Priestley and Grant (2005). Cumulative seismic damage effects are a function of the number, ranges, means and sequence of the imposed deformation cycles (Krawinkler et al. 2001). To determine the first three parameters, all displacement responses obtained by time history analyses of the SDOF systems are re-arranged using the simple rainflow cycle counting algorithm by Downing and Socie (1982). This method identifies cycles as closed hysteretic loops and provides their ranges (difference between maximum and minimum peak) and means (average value of minimum and maximum peak). Cumulative seismic demands Figure 2 compares the seismic responses of two RC frame SDOF system with fundamental period T=0.30s, post-yield stiffness ratio r=1% designed for two different q-factors=1 and 6. 3
P MERGOS and K BEYER
The SDOF systems are subjected to the Umbria Marche (1997) aftershock ground motion record (Mw=5.6, R=13km, PGA=0.09g, Soil type C). Figs. 2a and 2b present the pre-peak displacement responses and Figs. 3c and 3d the pre-peak lateral displacement and force responses of the SDOF systems, respectively. Pre-peak responses are defined herein as the response before the last of the maximum or minimum displacement peak response. In this study, sequence effects are considered in an approximate manner by assuming that only pre-peak responses cause significant damage and post-peak cycles are therefore neglected (Krawinkler et al. 2001, FEMA-461 2007).
0.01
0.05
a)
0 -0.01 -0.02 0
b)
Displacement [m]
Displacement [m]
0.02
5
10
0
-0.05 0
15
5
Time [s] 500
Force (kN)
Force (kN)
-500 -0.02
0
0 -50 -100 -0.05
0.02
Displacement [m]
0.5 0 -0.5
20
40
h) 0.5 0 -0.5 -1 0
20
Cycle
40
Cycle
1
1
f)
e)
Normalized Means
Normalized Means
0.05
1
Normalized Amplitudes
Normalized Amplitudes
0
Displacement [m]
g)
-1 0
d)
50
0
0.5 0 -0.5 -1 0
15
100
c)
1
10
Time [s]
20
40
0.5 0 -0.5 -1 0
20
40
Cycle Cycle Figure 3. Seismic demands on two example SDOF systems representing a RC frame building with T=0.30s, r=1% designed for q=1 and q=6 respectively and subjected to the Umbria Marche (1997) aftershock record: a) lateral displacement response q=1; b) lateral displacement response q=6; c) force-displacement hysteretic response q=1; d) force-displacement hysteretic response q=6; e) ordered normalized cycle amplitudes q=1; f) ordered normalized cycle amplitudes q=6; g) normalized cycle means q=1; h) normalized cycle means q=6
4
P MERGOS and K BEYER
Figures 3e and 3f present cycle amplitudes, which are defined in this section as cycle ranges divided by 2, normalized with respect to the maximum cycle amplitude. As a result, normalized amplitudes of the first cycle are equal to 1 and of the remaining cycles less than one. Cycle ranges are determined by the rainflow cycle counting method for the pre-peak displacement response then they are centred with respect to zero and finally they are placed in descending order. This approach, which is typically followed in similar studies (Krawinkler et al. 2001, FEMA-461 2007), assumes symmetric response of the structural system. This assumption is valid for both SDOF systems as it can be concluded from Figs. 3g and 3h, which present the calculated cycle means normalized with respect to the maximum cycle amplitude. Cycle numbers correspond to the ones of Figs. 3e and 3f. The figures show that for the first cycles, which have important amplitudes, cycle means are close to zero which supports the adopted simplification of neglecting the effect of the mean value. Comparison of Figs 3g and 3h reveals that the cumulative seismic demands of the SDOF system designed for q=1 is considerably higher than the ones of the same SDOFsystem designed for q=6 and subjected to the same ground motion record. The same conclusion can be drawn by Fig. 4 which shows median normalized cycle half ranges and cycle means for an SDOF system representing an RC frame building with T=0.3s, r=1% for low to moderate and high seismicity ground motion records designed for q=1 and q=6. 1
1
a)
0.6
0.8
Normalized value
Normalized value
0.8
Ranges - Low to moderate Means - Low to moderate Ranges - High Means - High
0.4 0.2 0 0
5
10
15
0.6 0.4 0.2 0 0
20
Ranges - Low to moderate Means - Low to moderate Ranges - High Means - High
b)
2
4
6
8
Cycle
Cycle
Figure 4. Median normalized cycle half ranges and cycle means for an SDOF system representing an RC frame building with T=0.3s, r=1% for low to moderate and high seismicity ground motion records designed for: a) q=1; b) q=6
Construction of loading protocols The algorithm for constructing loading protocols adopted in this study aims at describing the normalized ordered amplitude sequence of the SDOF system (Fig. 4) as an analytical function with empirical coefficients. The loading protocol should yield a conservative distribution of normalized cycle amplitudes which tends to overestimate the cumulative damage effect (CDE) obtained from time history analysis. The method is based on similar procedures developed in previous studies on loading protocols (Richards and Uang 2006; Hutchinson et al. 2011). Unlike in previous studies, however, the amplitudes of the cycles of the loading protocol are expressed as analytical functions of the load step, which allows describing different loading protocols for different structural systems by only two parameters. Each loading protocol consists of n load steps with n1 cycles of the same amplitude per step. The loading protocol comprises therefore in total ntot=n∙n1 cycles. Before constructing the loading protocol, the number of cycles per step n1 is chosen. Typically, two (e.g. FEMA-461) or three (e.g. ISO-21581) cycles per load step are assigned, which allows investigating the stiffness and strength degradation of the structural component that is tested. As the number of equal cycles per step decreases, the SDOF’s ordered amplitude sequence obtained from time history analysis can be represented with higher accuracy. As a limit case, when each 5
P MERGOS and K BEYER
cycle is assigned a different amplitude, the actual SDOF’s amplitude sequence can be obtained. In order to give the applicant the largest possible choice with regard to the form of the loading protocol, loading protocols for all three options (one, two and three cycles per step) will be developed. The SDOF system’s median normalized amplitude sequence is obtained using the methodology described in previous section and the corresponding empirical cumulative distribution function (CDF) is constructed. The latter reflects the distribution of the median values of the normalized cycle amplitudes. Additionally, the cumulative damage effect (CDE) of the SDOF system cycle sequence is calculated. The basis for calculating the CDE is the following general damage model, which is based on Miner’s rule (Krawinkler et al. 2000, Richards and Uang 2006):
N
N
C D E C i C m ax i c
c
i 1
c
(1)
i 1
where C and c are structural performance parameters. The parameter c is typically greater than 1 reflecting the fact that larger cycles cause more significant damage than small cycles (Richards and Uang 2006). Then, a while-loop is launched, where the number of total steps n progressively increases. For each value of n, first the protocol cycle step amplitudes are determined to match SDOF’s and protocol’s CDF for each load step and then protocol’s CDE is calculated. The while-loop terminates when protocol’s CDE exceeds for the first time SDOF’s CDE. The previous methodology yields arbitrary loading protocol cycle amplitudes which may change abruptly between two subsequent load steps (‘rough’ loading protocol). In order to smooth the loading protocol curve, the following general exponential function is fitted to the rough protocols: f t
1
o e 1 1 o exp t e 1
a
(2)
where δο is the threshold for damaging cycles (assumed 0.05 herein), t=x/n, x is the current load step, n is the number of load steps and α is a parameter describing the rate of amplitude increase. The proposed function approaches for t=0 δο and for t=1 unity. Hence, it always satisfies the boundary conditions of the loading protocols proposed in this study. The form of Eq. (2) was chosen because it yields in almost all cases superior fits than polynomial or power functions. Substituting δο=0.05 and t=x/n into Eq. (2), one obtains: x f x 0.50 0.55 exp n
(3)
Eq. (3) requires only two parameters (i.e. n and α) for fully determining the normalized loading protocol sequence. The number of load steps n is determined from the algorithm described above. The parameter α is calculated in order to provide the best fit between the ‘rough’ and the ‘smooth’ protocol, which minimizes the sum of squared errors between the predictions of Eq. (3) and the normalized amplitudes of the ‘rough’ protocol.
6
P MERGOS and K BEYER
New loading protocols This section presents new loading protocols for quasi-static cyclic testing which were developed following the methodology outlined in the previous section. Different loading protocols are proposed for SDOF systems designed for different behaviour factors. Table 2 summarizes the resulting protocol parameters n and α that were derived from the median values of cumulative damage demands for different structural configurations, levels of seismicity and cycles per load step. It is recalled that describes the increase in amplitude with load step and n the number of load steps. If, for example, two cycles per load step are assigned, the total number of cycles ntot is 2n. Due to space limitations, only the loading protocols with cycles per loading step are presented herein. Furthermore, the protocols for only three values of the examined behaviour factors are shown. Table 2. Proposed loading protocol parameters for different structural systems and levels of seismicity (n1=2) Structural systemHysteretic model
Vibration period (sec) T=0.15s
RC frames
T=0.3s T≥0.5s T=0.1s
RC & masonry shear walls
T=0.2s T=0.3s T≥0.5s T=0.1s
Masonry rocking walls
T=0.2s T=0.3s T≥0.5s
Low to moderate seismicity
High seismicity
q=1
q=3
q=6
q=1
q=3
q=6
n=7 α=3.3 n=5 α=1.96 n=2 α=2.01
n=4 α=3.25 n=3 α=2.47 n=2 α=1.66
n=4 α=3.43 n=3 α=2.44 n=2 α=2.22
n=14 α=2.8 n=10 α=1.94 n=5 α=1.97
n=8 α=3.2 n=5 α=3.11 n=3 α=2.07
n=9 α=3.36 n=4 α=2.32 n=4 α=2.72
q=1
q=3
q=6
q=1
q=3
q=6
n=11 α=4.17 n=6 α=2.26 n=5 α=2.16 n=3 α=1.63
n=4 α=2.47 n=4 α=2.36 n=4 α=2.48 n=2 α=3.06
n=5 α=2.79 n=3 α=2.7 n=2 α=3.33 n=2 α=1.94
n=16 α=4.19 n=11 α=2.66 n=10 α=2.28 n=6 α=2.27
n=11 α=2.8 n=6 α=3.66 n=4 α=1.97 n=4 α=2.49
n=11 α=3.28 n=5 α=2.88 n=4 α=1.98 n=4 α=2.42
q=1
q=2
q=3
q=1
q=2
q=3
n=5 α=2.57 n=5 α=2.25 n=4 α=1.83 n=3 α=1.63
n=4 α=1.89 n=4 α=1.62 n=4 α=1.56 n=3 α=1.71
n=5 α=1.47 n=4 α=1.66 n=3 α=1.51 n=3 α=1.7
n=5 α=2.06 n=7 α=2.96 n=8 α=2.86 n=5 α=2.03
n=8 α=2.89 n=7 α=3.14 n=4 α=1.89 n=4 α=1.92
n=9 α=2.83 n=7 α=3.28 n=5 α=2.11 n=4 α=1.76
Examination of the table results shows that the number of loading steps of the proposed loading protocols tend to decrease as the behaviour factor and the period of vibration increase. This effect is more prominent for the RC frames and walls and less significant for the masonry rocking walls. Figure 5 presents proposed loading protocols for an RC frame structure with T=0.3s in a region of high seismicity designed for q=1 and q=6 respectively. Table 2 shows the corresponding loading protocol parameters for two cycles per load step: n=10 and α=1.94 when q=1 and n=4 and α=2.32 when q=6. The structure is examined for lateral drift capacity of 3%. It is evident that the loading protocol proposed for q=1 is significantly more demanding than the loading protocol developed for q=6.
7
P MERGOS and K BEYER
a)
3
1
Drift (%)
Drift (%)
3
-1 -3
b)
0
-3
5
10
15
20
2
Cycle
4
6
8
Cycle
Example loading protocols for an RC frame structure with elastic period of vibration T=0.3s in a region of high seismicity a) designed for q=1; b) designed for q=6
Conclusions Previous loading protocols have been developed independently of the value of the behaviour factor q that the structure has been designed for. Conservatively, a single loading protocol is adopted, for all q values, based on the structural system with the most onerous cumulative seismic demands. However, analyses conducted by the authors, show that imposed cumulative seismic demands decrease significantly for structures designed for high behaviour factors. This drives to the conclusion that adopting a single loading protocol for the most demanding q value may lead to the derivation of highly conservative loading protocols for the rest of the structural systems. In this paper, new loading protocols are developed for structures designed for different behaviour factors. The new loading protocols are expected to yield more realistic estimates of structural strength and deformation capacities when applied to test specimens since they represent more accurately anticipated cumulative damage demands.
REFERENCES Carr AJ (2012) Ruaumoko – A computer program for inelastic time history analysis. Department of Civil Engineering, University of Canterbury, New Zealand CEN (2004) Eurocode 8: design of structures for earthquake resistance, part 1: general rules, seismic actions and rules for buildings, European Standard EN 1998-1, Brussels, Belgium Dowing SD, Socie DF (1982) Simple rainflow cycle counting algorithms. International Journal of Fatique, 4(1): 31-40 EN-12512 (2001) Timber structures-Test methods. Cyclic testing of joints made with mechanical fasteners, European Committee for Standardization, Brussels, Belgium FEMA-461 (2007) Interim protocols for determining seismic performance characteristics of structural and non-structural components through laboratory testing. Federal Emergency Management Agency, Washington, DC Gatto K, Uang C (2003) Effects of loading protocol on the cyclic response of woodframe shearwalls, Journal of Structural Engineering, 129(10): 1384-1393 Hutchinson T, Zhang J, Charles E (2011) Development of a drift protocol for seismic performance evaluation considering a damage index concept. Earthquake Spectra 27(4): 1049-1076 ISO-21581 (2010) Timber structures-Static and cyclic lateral load test methods for shear walls. International Standards Organization, Geneva, Switzerland
8
P MERGOS and K BEYER
Krawinkler H, Parisi F, Ibarra L, Ayoub A, Medina R (2001) Development of a Testing Protocol for Woodframe Structures, CUREE publication No. W-02 Mergos P, Beyer K (2014) Loading protocols for European regions of low to moderate seismicity. Bulletin of Earthquake Engineering, 12: 2507-2530 Porter ML (1987) Sequential phased displacement (SPD) procedure for TCCMAR testing. rd Proceedings of the 3 meeting of the joint technical coordinating committee on masonry research, USJapan coordinated program Priestley MJN, Grant DN (2005) Viscous damping in seismic design and analysis. Journal of Earthquake Engineering, 9(sup2): 229-255 Priestley MJN, Calvi GM, Kowalsky MJ (2007) Direct displacement based seismic design of structures, IUSS Press, Pavia Richards PW, Uang C (2006) Testing protocol for short links in eccentrically braced frames. Journal of Structural Engineering 132(8):1183-1191
9