Eugene, OR, 97403-1202, USA ... It is through visual search that most people locate the content ... spacing on the visual search of word lists, and found that as.
Appears in the Proceedings of the 48th Meeting of the Human Factors and Ergonomics Society
LOCAL DENSITY GUIDES VISUAL SEARCH: SPARSE GROUPS ARE FIRST AND FASTER Tim Halverson and Anthony J. Hornof Department of Computer and Information Science University of Oregon Eugene, OR, 97403-1202, USA Visual search in an important aspect of many tasks, but it not well understood how layout design affects visual search. This research uses reaction time data, eye movement data, and computational cognitive modeling to investigate the effect of local density on the visual search of structured layouts of words. Layouts were all-sparse, all-dense, or mixed. Participants found targets in sparse groups faster, and searched sparse groups before dense groups. Participants made slightly more fixations per word in sparse groups, but these were much shorter fixations. The modeling suggests that participants may have attempted to process words within a consistent visual angle regardless of density, but that they were more likely to miss the target if the target was in a dense group. Furthermore, it was found that the participants tended to search sparse groups before dense groups. When combining densities in a layout, it may be beneficial to place important information in sparse groups. INTRODUCTION It is through visual search that most people locate the content and controls for many tasks. Yet, it is not well understood how the implementation of many layout design practices affect visual search. The visual display of static alphanumeric information is typically studied in the context of legibility and not how changing features in the display will affect visual search (as in Sanders & McCormick, 1987). Varying the density is one common design practice used to establish grouping and hierarchy in visual displays (Mullet & Sano, 1995). This paper reports a study that investigates the effect of varying local density on visual search strategies of two-dimensional menu-like lists of words. The density of items in a display is one factor that has been shown to affect the number of items that can be perceived in a single fixation and thus search time. Bertera and Rayner (2000) varied the density of randomly placed single characters in a search task. They found that search time decreased as the density increased. In addition, they estimated that the number of letters processed per fixation increased as the density of letters increased. Mackworth (1976) showed similar results in a study in which participants searched for a square among uniformly distributed circles on a scrolling vertical strip. Ojanpää, Näsänen, and Kojo (2002) studied the effect of spacing on the visual search of word lists, and found that as the vertical spacing between words increased (i.e. as density decreased), search time also increased. Density may be measured as overall density or local density. Overall density is the number of items per degree of visual angle over an entire layout. Local density is the number of items per degree of visual angle within a visually distinct group. Local density is the focus of the study presented in this paper. Besides affecting the number of items inspected per fixation, local density may also affect the order of inspection. Studies have found that visual attention is drawn to stimuli that are likely to be “more informative.” One definition of “more informative” found by Mackworth and Morandi (1967)
for pictorial stimuli is regions having greater contour that are less peripherally salient than other regions. For example, with geometric shapes, angles are considered more informative than straight lines. Yet, it is not readily known how to predict a priori which of two stimuli are more informative. One plausible factor of “informativeness” is local density. It may be that regions with a higher local density are more likely to be searched earlier since they contain more information. The following hypotheses were tested in this study: H1: The search time per word is greater in sparse layouts than in dense layouts. H2: Dense regions will be searched before sparse regions. EXPERIMENTAL METHOD This experiment investigated the effect of local density, and the mixing of local densities, in visual search of structured layouts where the stimuli were words. Local density is defined here as the number of potential targets per degree of visual angle within a visually distinct group. Participants Twenty-four people, 10 female and 14 male, ranging in age from 18 to 55 years of age (mean = 24.5) from the University of Oregon and surrounding communities participated in the experiment. The participants were screened as follows: 18 years of age and older; experienced using graphical user interfaces (such as Microsoft Windows or Macintosh); no learning disability; normal use of both hands; and normal or corrected-to-normal vision. Participants were paid $10, plus a bonus that ranged from $0 to $4.54 based on their performance. Apparatus Visual stimuli were presented on a ViewSonic VE170 LCD display set to 1280 by 1024 resolution at a distance of 61 cm that resulted in 40 pixels per degree of visual angle. The experimental software ran on a 733Mhz Apple Power
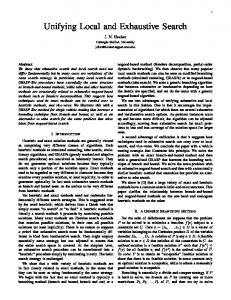
Figure 1: A mixed-density layout. All angle measurements are in degrees of visual angle. Macintosh G4 running OS X 10.2.6. The mouse was an Apple optical Pro Mouse, and the mouse tracking speed was set to the fourth highest in the mouse control panel. Eye movements were recorded using an LC Technologies Eyegaze System, a 60 Hz pupil-center/corneal-reflection eye tracker. A chinrest was used to maintain a consistent eye-toscreen distance. Stimuli Figure 1 shows a sample layout from one mixed-density trial. All trials contained six groups of left-justified, vertically-listed black words on a white background. Groups were sets of words surrounded by white space equal to or greater than the distance between the centers of the words in the group. The groups were arranged in three columns and two rows. Columns were 7.5 degrees of visual angle from left edge to left edge. Rows were separated by 0.65 degrees of visual angle. There were two types of groups with different local densities: Sparse groups contained five words of 18 point Helvetica font with 0.65 degrees of vertical angle between the centers of adjacent words (0.45° for word height, and 0.2° for blank space). Dense groups contained 10 words of 9 point Helvetica font with 0.33 degrees of vertical angle between the centers of adjacent words (0.23° for word height, and 0.1° for blank space). Both types of groups subtended the same vertical visual angle. There were three types of layouts: sparse, dense, and mixeddensity. Sparse layouts contained six sparse groups. Dense layouts contained six dense groups. Mixed-density layouts contained three sparse groups and three dense groups. The arrangement of the groups in the mixed-density layouts was randomly determined for each trial. Sparse and dense layouts
were identical to the mixed-density layout, with the exception of group densities. This experiment was designed in part to determine the effect of combining multiple local densities in a single layout. Text size and the number of words per group were varied to produce different local densities. Text size often covaries with local density in real-world tasks. Varying just text size or spacing may have removed the effect of visually distinct groups. The words used in each trial were selected randomly from a list of 765 nouns generated from the MRC Psycholinguistic Database (Wilson, 1988). No word appeared more than once per trial. The words in the list were selected as follows: three to eight letters, two to four phonemes, above-average printed familiarity, and above-average imagability. Five names of colors and thirteen emotionally charged words were removed. The target word was randomly chosen from the list of words used in each trial. The participant was precued with the target word before each layout appeared. The precue appeared at the same location every time, directly above the top left word in the layout, in 14 point Geneva font. Procedure Each trial proceeded as follows: The participant studied the precue; clicked on the precue to make the precue disappear and the layout appear; found the target word; moved the cursor to the target word; and clicked on it. The trials were blocked by layout type. Each block contained 30 trials, preceded by five practice trials. The blocks were fully counterbalanced. At the start of each experiment, the eye tracker was calibrated to the user. The calibration procedure required the participant to fixate a series of nine points until the average
Table 1: Search time per trial and word, fixations per word, and fixation duration for sparse, mixed-density, and dense layouts.
Search Time per Trial (ms)
Search Time per Word (ms)
Fixations per Word
Fixation Duration (ms)
Layout Sparse
Mean 3125.32
SD 665.74
Mean 208.25
SD 49.10
Mean .69
SD .16
Mean 250.44
SD 33.21
Mixed
5753.47 7925.38
1493.19 1891.70
253.58 265.11
61.78 54.52
.70 .62
.14 .14
306.97 369.65
48.81 67.89
Dense n=24
error between the predicted point of gaze and the actual location of the points fell below an error threshold (approximately 6.35 mm). Accurate eye tracking calibration was maintained using required fixation locations (Hornof & Halverson, 2002). Searching and mouse movement times were separated using a point-completion deadline (Hornof, 2001). RESULTS
layout uniformity and target group density, F(1,23) = 16.87, p < .01. In other words, when the target was in a sparse group, participants found the target faster in all-sparse layouts than in mixed layouts; when the target was in a dense group, participants found the target faster in mixed-density layouts than in all-dense layouts. Furthermore, in mixed density layouts, participants found the target faster when it was in a sparse group, F(1,23) = 30.36, p < .01. Eye Movements
The mean search time per trial for each of the twenty-four participants was analyzed. Participants searched layouts with fewer dense groups faster than layouts with more dense groups, F(2,46) = 127.80, p < .01. Since dense groups contained more words, the analysis was also run after normalizing for the number of words per layout. Participants spent less time per word in layouts with fewer dense groups, F(2,46) = 13.94, p < .01. Post-hoc analysis showed this difference was significant between the sparse and the mixed layouts, HSD = 23.68, p < .01; and between the sparse and dense layouts, HSD = 27.91, p < .01; but not significant between the mixed and dense layouts, HSD = 4.24, p > .05. The search time per trial was analyzed by layout uniformity (all one density vs. mixed density) and target group density. Figure 2 shows the results. Locating a target in dense groups took longer than sparse groups, F(1, 23) = 83.87, p < .01. The mean search time for all-sparse and all-dense was no different than the mean search time for mixed-density layouts, F(1,23) = 1.03, p = .32. However, there was an interaction between
The mean number of fixations per word and the fixation duration were analyzed. Fixations were determined using the dispersion-threshold method (see Salvucci & Goldberg, 2000) with a dispersion threshold radius of 0.5° and a duration threshold of 100 ms. Eye movements that started before the precue was clicked and after the target was clicked are excluded from all eye movement analysis. Participants made slightly fewer fixations per word in layouts with more dense groups, F(2,46) = 3.25, p = .05. Posthoc analysis showed that participants used fewer fixations per word in the dense layouts than in the mixed layouts, F(1,23) = 8.42, p = .01. Conversely, participants’ fixations were much longer in layouts with more dense groups, F(2,46) = 61.82, p < .01. Post-hoc analysis showed that participants made longer fixations in the dense layouts than in the mixed layouts, F(1,23) = 36.01, p < .01, and longer fixations in mixed layouts than in the sparse layouts, F(1,23) = 38.11, p < .01. The order of group visitation as a function of group density was analyzed. A group was “visited” if one or more contiguous fixations fell within 1 degree of visual angle of the group (roup revisits were not included ). Group visits from the mixed density layouts were tested by comparing the percentage of visits to sparse or dense groups for the first through sixth group visit, regardless of the position of each group in the layout. The results are shown in Figure 3. Participants tended to visit sparse groups before dense groups, χ2(5, N = 24) = 500.04, p < .01. The number of group revisits, by layout, was also analyzed. Participants made more revisits per trial in layouts with more dense groups, F(2,46) = 10.50, p < .01. Post-hoc analysis showed that fewer revisits were made in sparse layouts than mixed layouts, F(1,23) = 12.82, p < .01. Although there were fewer revisits per trial in mixed layouts than in dense layouts, the difference was not significant, F(1,23) = 2.31, p = 0.14.
Mean Search Time per Trial (ms)
Search Time
8000
6000
4000
2000
0
Layout: Sparse # Words in Layout : 30 Target Group: Sparse
Mixed 45 Sparse
Mixed 45 Dense
Dense 60 Dense
Figure 2: Search time by layout type and the density of the target group. Error bars indicate ±1 standard error.
Visual Search Models
7500 5000 2500 0
Sparse
Mixed Dense Layout Type
10 5
Sparse
50
25
1st
2nd 3rd 4th 5th Order of Group Visit
6th
Figure 3. The percentage of visits to sparse or dense groups by the order in which groups were visited. durations was poor (AAE = 66%). The aim of the second model was to account for the fixation durations, as this was the least accurately predicted measure in the first model. In the human data the mean observed fixation duration increased with layout density. To account for this in the model, two modifications were made. First, the model refrained from initiating a saccade until the text of the currently fixated object was perceived, but prepared the next saccade while waiting. Second, a visual property recoding function was introduced to calculate the time to perceive the text feature based on the proximity of adjacent items. If an object’s closest neighbor was 0.15 degrees of visual angle (dov) or closer (i.e. a dense object), the text recoding time was 150 ms. Otherwise the text recoding time was 50 ms. The predicted search time for the second model was an improvement on the first, but was still poor (AAE = 42%). A slight increase of search time with layout density was predicted. This improvement was a result of a good data fit for the fixation durations (AAE = 10%). However, the prediction for the number of fixations worsened because the predicted number of fixations decreased equally across all layout types (AA = 48%). The aim of the third model was to account for an increased number of fixations in layouts with dense groups. To accomplish this, the number of words perceived in each fixation by the model was limited. The region from which text could be perceived was left at the default value of 1.0 dov. However, the probability of perceiving any given word was varied by local density: 90% for words in sparse groups and
15
0
Dense
0
20
10000
Mean Fixations per Trial
Mean Search Time per Trial (ms)
Four models are discussed in this section (see Halverson & Hornof, 2004 for more details). Each improves on the previous. All models are based on a purely random, withoutreplacement, search strategy. While we do not necessarily assert that people move their eyes from item to item randomly, it may be that a random search strategy is a good first approximation for predicting mean layout search time without the need to specify complicated strategies or visual features beyond the locations of objects. Such a strategy has the added benefit for a priori engineering models, as each object need be encoded with only one directly-extractable feature—it’s location. The first model was a purely random search model with all of EPIC’s perceptual properties left at the default values. This model was overall a poor predictor of the human data. The model’s predictions were compared to the human data on three measures: the mean search time per trial, the mean number of fixations per trial, and the mean fixation duration. In the model, none of the measures increased from the sparse layouts to mixed layouts or from the mixed layouts to the dense layouts as was seen with the human data. The average absolute error (AAE) for the search time prediction was 62%. The model did predict the number of fixations for the all-sparse layout quite well, but the prediction across all layouts was poor (AAE = 27%). Likewise, the prediction for the fixation
Sparse
75
Mixed Dense Layout Type
Mean Fixation Duration (ms)
Computational cognitive models were constructed using the EPIC (Executive Process Interactive Control) cognitive architecture (Kieras & Meyer, 1997). EPIC captures human perceptual, cognitive, and motor processing constraints in a computational framework that is used to build cognitive models. Into EPIC were encoded (a) a reproduction of the task environment, (b) the visual-perceptual features associated with each of the screen objects and (c) the cognitive strategies that guide the visual search, encoded as production rules. These components were added based on task analysis, human performance capabilities, previous visual search models, and parsimony. After these components were encoded into the architecture, EPIC executed the task, simulated the perceptualmotor processing and interactions, and generated search time and eye movement predictions.
Percetange of Group Visits
COGNITIVE MODELING
400 Observed 300 200
Predicted
100 0
Sparse
Mixed Dense Layout Type
Figure 4: The mean search time (left), number of fixations per trial (center), and fixation duration (right) that were observed (solid lines) and predicted (dashed lines) by the best-fitting model. The AAE are, in order, 7%, 9%, and 8%.
50% for words in dense groups. This approach was inspired by the observation that the participants revisited fewer groups in sparse layouts. The observed and predicted results of this final model are shown in Figure 4. As seen in Figure 4, the model explains the data very well. DISCUSSION The data are counter to the study’s first hypothesis – that the search time per word is greater for sparse layouts than for dense layouts. The search time data reported here demonstrate that people actually spent less time per word searching sparse layouts. It appears that participants were able to adopt a more efficient eye movement strategy that used slightly more, but much shorter, fixations. This result is contrary to the search time results found by Bertera and Rayner (2000) and Ojanpää, et al. (2002) in which the search time per item decreased as the density increased. This discrepancy may be due to the way in which density is manipulated. In the previous studies, the spacing between items was varied, and in the current study, the size of items (i.e. font size) was varied. It may be that although various factors affect local density, they do not all affect visual search of those densities in the same way. Nonetheless, the modeling results suggest that our findings from the current study and those of Bertera and Rayner (2000) may contradict each other quantitatively, but not in implications. Bertera and Rayner estimated that the size of the region in which objects were processed was the same across layouts of different densities. The best fitting model based on our data also predicts that the region in which objects were potentially processed was the same across different densities. However, perhaps due to the nature of our task, it is likely that some items within that region were not perceived. The group revisits data support the predictions of the bestfitting model. In the human data, group revisits were greater in the dense layouts than in the sparse layouts. The best-fitting model also predicts that targets will be missed more often in dense groups. While the data generated by the model cannot be directly compared to the group revisit data, since the model did not consider grouping of words and there may be other ways to explain the revisits in the human data, the human data does support the model predictions. The data are also counter to this study’s second hypothesis – that participants will search dense groups first. A preference for search order as a function of group density was found. However, it was in the opposite direction than predicted. The search time data show that when the target was in a sparse group the mean search time was much closer to that of the sparse layouts, and that when the target was in a dense group the mean search time was much closer to that of the dense layouts. If one density were consistently searched before the other, then we would expect the search time for targets located in groups of a preferred density to be lower than the search time for targets located in the other groups. We observed the latter. The data suggest that the participants tended to search the sparse groups first. This preference was confirmed with
analysis of the eye movements in the mixed layouts. As is seen in Figure 3, it was much more likely for participants to look at sparse groups than dense groups within the first four groups visited. The findings that sparse groups tend to be searched earlier and faster supports the design practice of using sparse groups of text to attract users’ attention to more important information. Information essential for the primary goals should be placed in groups that are sparse relative the other information in the layout so that they are more likely to be found faster. CONCLUSION This research investigates the effect of local density on visual search of structured, two-dimensional menus. It was shown that targets in sparse groups were found faster, likely missed less often, and searched earlier than when in dense groups. Additional research is required to determine if these findings generalize to a variety of local densities. Future research will investigate the effects of font size and spacing independently. ACKNOWLEDGMENTS This research is supported by the Office of Naval Research grant N00014-02-10440 and the National Science Foundation grant IIS-0308244. Both grants are to the University of Oregon with Anthony Hornof as the principal investigator. REFERENCES Bertera, J. H., & Rayner, K. (2000). Eye movements and the span of effective stimulus in visual search. Perception & Psychophysics, 62(3), 576-585. Halverson, T., & Hornof, A. J. (2004). Explaining Eye Movements in the Visual Search of Varying Density Layouts. Proceedings of the Sixth International Conference on Cognitive Modeling, Pittsburgh, Pennsylvania. Hornof, A. J. (2001). Visual search and mouse pointing in labeled versus unlabeled two-dimensional visual hierarchies. ACM Transactions on Computer-Human Interaction, 8(3), 171-197. Hornof, A. J., & Halverson, T. (2002). Cleaning up systematic error in eye tracking data by using required fixation locations. Behavior Research Methods, Instruments, and Computers, 34(4), 592-604. Kieras, D. E., & Meyer, D. E. (1997). An overview of the EPIC architecture for cognition and performance with application to human-computer interaction. Human-Computer Interaction, 12(4), 391-438. Mackworth, N. H. (1976). Stimulus Density Limits the Useful Field of View. In R. A. Monty & J. W. Senders (Eds.), Eye Movements and Psychological Processes (pp. 307-321). Hillsdale, NJ: Lawrence Erlbaum. Mackworth, N. H., & Morandi, A. J. (1967). The gaze selects informative details within pictures. Perception & Psychophysics, 2(11), 547-552. Mullet, K., & Sano, D. (1995). Designing Visual Interfaces: Communication Oriented Techniques. Englewood Cliffs, New Jersey: Prentice Hall PTR. Ojanpää, H., Näsänen, R., & Kojo, I. (2002). Eye movements in the visual search of word lists. Vision Research, 42(12), 1499-1512. Salvucci, D. D., & Goldberg, J. H. (2000). Identifying fixations and saccades in eye-tracking protocol. Proceedings of the Eye Tracking Research and Applications Symposium. Sanders, M. S., & McCormick, E. J. (1987). Human Factors in Engineering and Design (6th ed.). New York, New York: McGraw-Hill. Wilson, M. D. (1988). The MRC Psycholinguistic Database: Machine Usable Dictionary, Version 2. Behavior Research Methods, Instruments, and Computers, 20, 6-11.