Jan 11, 2010 - Local Ensemble Transform Kalman Filter experiments using radar ... paper would like to thanks to Python ART Radar Toolkit available at ...
Local Ensemble Transform Kalman Filter experiments using radar observations: a case study over central Argentina Juan Ruiz1,2,4 , Luciano Vidal3, Paula Maldonado1, Sofía Suarez Ruiz3, Paola Salio1,2, Yanina García Skabar2,3,6, Celeste Saulo1,2,3, Stephen Nesbitt5, Eugenia Kalnay7, Takemasa Miyoshi4,7 (1)Atmospheric and Oceanic Research Institute – CONICET - University of Buenos Aires – Atmospheric Sciences Department, University of Buenos Aires (2) UMI-IFAECI CNRS (3)National Meteorological Service, Argentina, (4)RIKEN Advanced Institute for Computational Science (5)Department of Atmospheric Sciences, University of Illinois, Urbana – Champaign (6)National Council of Scientific and Technical Research (7)Department of Atmospheric and Oceanic Science, University of Maryland
Motivation: The aim of this work is to present the advances in the development and implementation of a radar data assimilation system that takes advantage of the developing radar network in Argentina. The system assimilate reflectivity and Doppler velocity using the Local Ensemble Transform Kalman Filter coupled with the Weather Research and Forecasting (WRF) model.
Data
Experimental setting
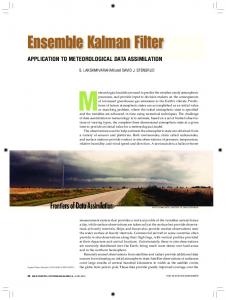
On January 11 2010, strong deep convection was observed by the Anguil radar, located at 36.5S, 64W. Several supercells were detected on that day. Photo by David Odriozola
•C-Band dual polarization Doppler radar •Maximum range (in this experiment) 120 km • Volume obtained every 10 minutes • 500 meters range resolution and 10 elevation angles (from 0.5 to 19.2 ) • Doppler 120km volume is performed in 4 minutes.
The 4D Local Ensemble Transform Kalman Filter (LETKF) coupled with WRF-ARW is used to assimilate radar data. • Assimilation frequency every 10 minutes • Doppler velocity and Z assimilated (2 km super-obbing) • 60 ensemble members • 2 km horizontal resolution, 60 vertical levels. • 240 x 240 km domain. • Initialization using random perturbations. • Horizontal and vertical localization ~ 2 km (R-localization) • Lin et. al. microphysics. • Multiplicative inflation factor 1.1 • Boundary conditions: GFS forecasts (0.5 degree)
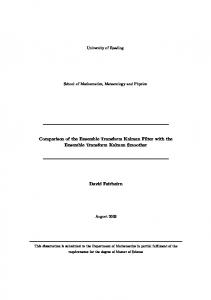
Reflectivity QC •Echo top (to remove shallow echoes) • Co-polar cross-correlation to remove non-meteorological echoes (lower 0.90). • Attenuation estimation to remove highly attenuated echoes. Wind QC • Dealiasing performed using Py-ART 4D approach. • VAD and local mean based QC to remove outliers.
Ze
QC Ze
DV
60 member ensemble forecast up to 120 minutes are performed. Four forecasts initialized every 30 minutes are verified using radar data betewen 17:15 UTC and 18:45 UTC. Errors in the forecast ensemble mean became as big as the control forecast errors after 40-50 minutes. Little to now growth in wind spread.
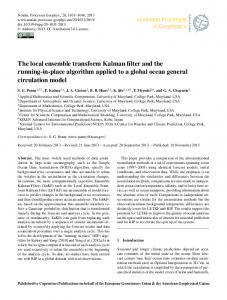
Analysis Analysis cycle starts at 15:55 UTC when the first cells were detected within the 120 km range and ends at 19:45 UTC.
Quality control
Short range forecast
Obs.
Anl.
19:45
19:45
A supercell is correctly forecasted 20 min. in advance. However the 50 min. ensemble mean forecast fails to detect the storm. Probabilistic forecast
20 min.
50 min.
19:45
19:45
Max Ze > 50 dBZ
QC DV The RMSE of the reflectivity and Doppler winds with respect to the observations is computed and compared with a 10 member control ensemble initialized without radar data.
Aknowledgments The following projects partially support this research: ALERT.AR program, CREST- Big Data Assimilation project, UBACYT 20020130100820BA, PICT 2014-1000, PICT 20131299, UBACyT 2013201620020130100618BA. This paper would like to thanks to Python ART Radar Toolkit available at http://arm-doe.github.io/pyart/
There is a possitive trend in the analysis error. Part of this trend can be explainde by the upscale growth of convection.
The more intense convective cells are correctly located in the analysis.
18:45-19:45
0-1 hour probabilistic forecasts correctly identify the areas affected by strong reflectivity.
Quality control Future work
• Better representation of model error: multiplicative inflation, additive inflation, bias correction and parameter perturbation / estimation. • Explore analysis sensitivity to radar scan strategy. • More case studies related with different convective organization.