Compressive Sensing (CS) method which simultaneously yields the PU ..... Xue, L., Hong, S., Zhu, H., Zhiqiang, W.: Bayesian compressed sensing based.
Localization of Primary Users by Exploiting Distance Separation Between Secondary Users Audri Biswas1(B) , Sam Reisenfeld1 , Mark Hedley2 , Zhuo Chen2 , and Peng Cheng2 1
Department of Engineering, Macquarie University, Sydney, NSW 2109, Australia {Audri.biswas,Sam.Reisenfeld}@mq.edu.au 2 Digital Productivity Flagship, CSIRO, Marsfield, NSW 2122, Australia {Mark.Hedley,Zhuo.Chen,Peng.Cheng}@csiro.au
Abstract. Accurate localization of Primary Users (PUs) is an extremely useful procedure which can improve the performance of Cognitive Radio (CR) by more efficient dynamic allocation of channels and transmit powers for unlicensed users. In this paper, we analyze the performance of a Compressive Sensing (CS) method which simultaneously yields the PU transmitter locations and transmit powers for any channel in a Cognitive Radio Network (CRN). Additionally, we propose a novel approach of selectively eliminating Secondary User (SU) power observations from the set of SU receiving terminals such that pairs of the remaining SUs are separated by a minimum geographic distance. The modified algorithm demonstrates substantial performance improvements compared to random deployment of receiving terminals. Simulations were run for both the cases of uniform and Gaussian distributions for the SU random locations. The simulation results indicate that the new approach significantly reduced the number of received power measurements from SU terminals required to achieve a particular level of performance. Keywords: Cognitive Radio · Radio Environment Map sensing · Localization power · Measurements
1
· Compressive
Introduction
The spectrum scarcity along with inefficient spectrum usage has motivated the development of Cognitive Radio (CR). The increasing demand of high data rates due to large numbers of portable hand-held devices initiated significant research in the field of interference mitigation and effective spectral utilization. CR provides a promising solution to the existing problem by efficiently using the underutilized spectrum to facilitate services by Dynamic Spectrum Sharing (DSS) for both licensed and unlicensed users. CR technology is based on the concept of learning the state of channel use of PUs, and subsequent efficient allocation of channels and transmit parameters to SUs. This allocation takes into account maximum acceptable interference levels to PUs and the throughput and performance requirements of SUs. c Institute for Computer Sciences, Social Informatics and Telecommunications Engineering 2015 � M. Weichold et al. (Eds.): CROWNCOM 2015, LNICST 156, pp. 451–462, 2015. DOI: 10.1007/978-3-319-24540-9 37
452
A. Biswas et al.
In a Cognitive Radio Network, both PUs and SUs share the same channels. Since SUs have lower priority, the channel use is constrained by a maximum acceptable level of interference to PUs. Many efforts have been made in previous literature [1][2] to tackle the issue of interference mitigation but only a few research papers have been published on channel collision avoidance based on the utilization of a Radio Environment Map (REM). To generate a REM, the locations of the transmitters and their transmit power levels need to be accurately estimated. From this estimation, the received power level throughout a two dimensional area may be estimated. For the REM, the received power levels interpolated over a two dimensional geographic area are obtained through the use of analytic equations for signal propagation. In CR, the REM is extremely useful in secondary user channel and transmit parameter selection. This selection must be made with the dual requirements of SU communication effectiveness and bounded interference to PUs. The bounded interference to PUs can only be maintained if the PU locations and received power levels from other PUs, are known by SUs. Therefore an accurate REM is crucial for effective CR operation. In [3], a cooperative algorithm is formulated that takes the received signal strength at each SU to create a weighting function and uses it to compute the location of multiple PUs. Although it has relatively low computational complexity, it requires a high density of SUs, and the performance degrades with channel fading. The work in [4] and[5] is based on the concept of using sectorized antennas to detect Direction of Arrival (DOA) of a signal. The phase information of a received signal is exploited to estimate the position of PUs. However, this technique might not be feasible for a practical CRN implementation due to antenna requirements which may be impractical for portable devices. In this paper we adopt a Compressive Sensing (CS) technique to retrieve the locations of multiple transmitting PUs in a CRN. The approach relies on a location fingerprinting approach, where a certain geographic area is discretized into equally spaced grid points. The PUs are assumed to be positioned at a subset of the grid points. The SUs are also assumed to be positioned at some known locations in the area of interest. Each SU measures Received Signal Strength (RSS) from target PUs. From this set of measurements, there is an attempt to recover the PU locations and transmit power levels. It is usually the case that the number of PUs is much smaller than the number of grid points. Consequently, the set of equations for power levels transmitted by PUs is underdetermined and there are many possible solutions. When the number of PUs is much smaller than the number of grid points, the sparsest solution for the set of equations yields accurate power levels at the correct grid points. Compressive sensing can be used to obtain the data required for the formulation of the REM. Similar techniques were used in [6], [7], [8] and [9]. In a physical system, some of the SUs will be closely geographically located. Having closely placed SUs introduces correlated observations which increases the observation coherence. This may have a negative impact upon the performance of CS algorithm. To improve the performance of the CS algorithm, we propose a
Localization of Primary Users by Exploiting Distance Separation
453
novel approach. The measurements of closely spaced SUs are removed from the set such as to increase the minimum distance separation between adjacent SUs in the measurement set. Our method achieved superior detection of multiple PUs with significantly fewer SU measurements, compared to random deployment of SUs. In this paper, the locations of SUs are specified by two dimensional vectors. Both the cases of uniform distribution and Gaussian distribution were considered for the random assignment of SU positions. Irrespective of distribution used, our novel approach of pre-selecting SU power measurements appears to reduce the number of measurements required to achieve reliable detection. Section 2 discusses the background of compressive sensing. Sections 3-5 describe the system model. Section 6 presents the simulation results which validate the effectiveness of our proposed method. The conclusion is given in Section 7.
2
Compressive Sensing
The CS technique is an approach for the solution of an under-determined set of equations for which the solution vector is known to be sparse. Some data vectors are sparse while others can be made more sparse by an appropriate basis transformation. A typical example would be the time frequency pair. A signal, which is a linear combination of several frequency components, can be easily retrieved by exploiting the sparsity in frequency domain. The complex Fourier Transform basis functions can be used to represent the time domain signal with few non-zero coefficients. In such case the CS algorithm can be used to obtain a sparsest solution vector to a set of underdetermined equations. The sparse vector, xN ×1 is the solution with the minimum number of non-zero elements. If yM ×1 is the raw observation vector obtained by the SU power measurments, there exist the following relationship, y = φx,
(1)
where φM ×N is a measurement matrix, representing the power propagation losses from each grid point to each SU. In [7] it states that, a matrix φ satisfies Restricted Isometry Property (RIP) condition, when all subsets of S columns chosen from φ are nearly orthogonal. Once this is true, there is a high probability of completely recovering the sparse vector with at least M = CK × loge (N/K) measurements (where K is the number of PUs and C is a positive constant) using l1 -minimization algorithm [10]. This can be can be expressed as, � min �x�1 = min |xi | i
subject to y = φx.
(2)
This formulation is valid for a noiseless scenario but when external noise is considered the algorithm is modified to a Second-Order Cone Program for an optimized solution for a defined threshold [10]. This can be stated as,
454
A. Biswas et al.
min �x�1 = min
�
|xi |
i
subject to �y = φx�2 ≤ ε,
(3)
where �·�p is the lp −norm and ε is the relaxation constraint for measurement errors. The sparest solution for x is the solution with minimum �x�0 . However, the CS algorithm is effective because the same solution vector usually has minimum l0 norm and minimum l1 norm.
3
System Model
Let us consider a square area discretized into equally spaced P ×P grid where, K PUs are randomly positioned at unique grid points. For simplicity of illustration, we assume that each PU is assigned a single dedicated sub-channel to carry out duplex communication with the base station. Now to observe radio environment and detect the free spectrum, M SUs are deployed randomly in the area of interest. Unlike [6] and [8] the SUs are not placed on the grid points. We adapted a more realistic approach of allowing the SUs to be placed at some known locations in the area. They have the added flexibility of being positioned at non-discretized points on the map. The SUs are controlled and managed by a central node called the Fusion Centre (FC). There exist a common control channel between central node and SUs for effective communication of RSS observations and channel allocation information. The FC processes the signal level measurements and manages SU channel allocation. The most crucial assumption in the model is that, spatial coordinates of both the grid points and SUs are known a priori by the FC which receives sensing information from each individual SU. The received power at a SU is a function of distance between the PU and SU as well as shadowing loss. The wireless channels are corrupted by noise and are also considered to be affected by lognormal shadowing. The simplified path-loss model as a function of distance may be described as, P athlossdB (d) = K1 dB + 10ηlog10 (
d ) + α, d0
(4)
where, d is transmission distance in meters, d0 is the reference distance of the antenna far field, K1 is a dimensionless constant, η is the propagation loss exponent, α is the shadowing loss in dB. K1 is a unit-less constant that relies on the antenna characteristics and average channel attenuation and K1 dB = 10log10 (K1 ) [11]. α accounts for the random attenuation of signal strength due to shadowing where α in dB scale is a Gaussian random variable with zero mean and standard deviation σdB = 5.5dB [3]. This model was used in [3] for both multipath and shadowing characterization.
Localization of Primary Users by Exploiting Distance Separation
4
455
Localization Using Compressive Sensing
This section combines the location dependent RSS information at each SU to formulate a sparse matrix problem, which can then be solved using the CS method to obtain the exact location of PUs in a CRN. Our grid layout consists of N grid points, with grid resolution w in both x-axis and y-axis. The N grid points are located at {Vn , 1 ≤ n ≤ N }, where Vn is a two dimensional position vector. The M SUs are located at {Um , 1 ≤ m ≤ M }, where Um is also a two dimensional position vector. Earlier in Section 3 we mentioned K PUs are positioned only at K discrete grids where K < N . The FC is assumed to have prior knowledge of Vn and Um . Using the distance information and signal propagation model described in (4) a measurement matrix Φ is constructed. The entries of the matrix are the channel gain and are expressed using the following equations, dmn =� Um − Vn �2 , Φmn = 10
−P athlossdB (dmn ) 10
(5) ,
(6)
where dmn is the distance between mth SU and nth grid point and Φmn is the pathloss between mth SU and nth grid point. Let Y be a M × 1 column vector where the mth element, Ym , represents the summation of received power from K PUs on mth SU. K � Ym = Qm,k , (7) k=1
where, Qm,k = 10
Qm,k,dB 10
and, Qm,k,dB = Pk,t − P athlossdB (dmk ) where,
and,
Qm,k is the power received at SU m which was transmitted by PU k, Pk,t is the power transmitted by user k, dm,k is the distance between SU m and PU k.
Equation (6) and (7) may be combined to formulate a CS problem similar to (2). It is assumed that the FC has complete knowledge of Φ. Therefore, Y = ΦX
(8)
with XN ×1 being a N ×1 column vector that is to be recovered using CS approach described in Section 2. In a realistic scenario, the observations are corrupted with noise power vector Pn . The elements of Pn are statistically independent
456
A. Biswas et al.
with variance σn2 , and are chi-square distributed with 1 degree of freedom. We can include the effect of additive noise by, Yn = ΦX + Pn .
(9)
Since the model assumes having only few PUs on a large grid size N , the vector XN ×1 satisfies the sparsity requirement for accurate recovery using a CS algorithm. Due to its sparse condition, the vector will have only few nonzero elements representing the transmit powers while the indices corresponding to nonzero elements indicate the grid points on which transmitting PUs are located. Hence using a single compressed sensing problem we can jointly estimate both the locations and transmit powers of multiple PUs by solving (3) described in Section 2. From the estimation, FS can approximate the received power level throughout a two dimensional area, using the path loss model in (4).
5
Data Processing
Based on the problem formulation in Section 4, YM ×1 is a power observation vector with each row representing sum of RSS received from K PUs on mth SU, and ΦM ×N is the measurement matrix with channel gain from each grid point. The small grid separation adds large coherence between the columns of the measurement matrix and this may violate the RIP condition[12]. A matrix transformation may be employed to increase the incoherence between the columns. We adopt a data processing technique described in [6] and [8] to decorrelate the rows which are the observation of signal strength from grid points on each SU. Let T be a processing operator, T = QR+
(10)
where, Q = orth(ΦT )T . The built in function of Matlab, orth(B) returns an orthonormal basis of the range of B, and B T returns the transpose of B. R+ is the Moore-Penrose pseudoinverse of a matrix R, where R = Φ. Applying the operator T on both sides of (9) yields, QR+ (Yn ) = QR+ ΦX + QR+ Pn = QΦ+ ΦX + QR+ Pn = Ax + ω �
Y = AX + ω. �
(11)
Let Y be QR+ (Yn ), the noisy processed observation vector. A = QΦ+ Φ be the processed measurement matrix and ω = QR+ Pn is the processed measurement noise. The row vectors are being orthogonalised by Q while the columns are decorrelated by the influence of Φ+ Φ. Hence we can claim that matrix A satisfies the RIP condition. Note that [6] and [8] considered Φ+ Φ = IN , as a diagonal identity matrix. Although Φ+ Φ acts like an identity on a portion of the space in the sense that it is symmetric. However it is not an identity matrix. After applying the processing operator, CS may be used to recover the sparse vector � from processed observation Y , via l1 -minimization program [6].
Localization of Primary Users by Exploiting Distance Separation
6
457
Simulation and Results
The localization accuracy of the CS algorithm can be effected by certain external factors such as Signal to Noise Ratio (SNR), shadowing, density of SUs and distribution of SUs. This section analyses the dependency of these factors on the performance parameters of three l1 constrained optimization algorithms (L1Magic, OMP and CoSAMP) to produce an accurate result. L1 Magic, CoSAMP, and OMP are three numerical algorithms for constrained l1 vector optimization [13], [14] and [15]. The performance parameters are categorized as, � � P UDet DetectionRatio = P UT otal
N ormalized Error P er Grid =
1 �Xorg − Xest � N
where P UDet is the number of detected PUs; P UT otal is the sum of the PUs in the network; Xorg is the original sparse vector; Xest the recovered vector using CS algorithms. The average absolute error between the vectors Xorg and Xest is obtained by simulation. This is used to evaluate the accuracy of the algorithms to reconstruct a sparse vector with minimum non-zero coefficient. Furthermore to study the impact of each factor, the simulation is analyzed independently to demonstrate the robustness and reliability of the algorithms. 6.1
Simulation Setup
The simulation is carried out on a 43 × 43 (i.e. N = 1849) square grid with a grid separation of 80m. Among the 1849 grid points, 10 PUs are uniformly distributed on the grid points. The transmit power is random and uniformly distributed over the range of 1 to 5 Watts. The scenario consists of 160 SUs with a two dimensional, zero mean, Gaussian spatial distribution with standard deviation σsd . The shadowing factor is log normal distributed. Simulation (I) - Impact of SNR. Signal to noise ratio is one the crucial factors effecting the performance of each algorithm. SNR is calculated at the receiver as the ratio of sum of received powers at a SU to σn2 . Where, σn2 is the variance of the additive, zero mean, Gaussian noise. Then, SN R(dB) = 10 log10 (
M 1 � Yi ). M i=1 σn2
Yi is the received RSS from all transmitting PUs at ith SU. As the received signal power is position dependent, SNR will vary with respect to the positioning of
458
A. Biswas et al.
SUs. Such scenario prompted us to take the average SNR over M elements of the observation vector. Fig 1(a) and (b) shows the plots for detection ratio of PUs and normalized error per grid versus average received SNR in dB. As shown in Fig. 1 (a) when SNR < 12dB, L1-Magic performs better than CoSAMP however when SNR > 15dB, CoSAMP outperforms L1-Magic and OMP. At a higher SNR = 25dB, both CoSAMP and L1-Magic achieved a detection ratio of 1 while OMP is at 0.6. Fig. 1(b) shows that, with gradual increase in SNR, CoSAMP generates fewer normalized errors per grid compared to L1-Magic and OMP. Even at a low SNR = 15dB, CoSAMP produces 50% and 54% less errors compared to L1-Magic and OMP.
Fig. 1. (a) SNR vs detection ratio and (b) SNR vs normalized error per grid
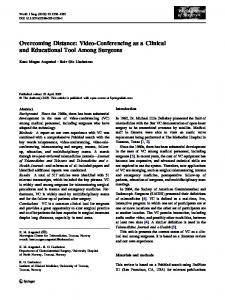
Similation (II) - Sampling Ratio. Sampling ratio M N is another major factor that has a significant impact on the performance of these algorithms. In this simulation we start with 200 SUs to detect the position of 10 PUs, where at each iteration 20 SUs are randomly removed to observe the effect of reduced sampling points. The SNR is kept constant at 25dB. The plots in Fig.2 follows a similar trend as in Fig. 1. At very low sampling ratio of 0.05, almost all three algorithms fails to recover an accurate sparse solution as solving an undermined system with such small number of measurements is not feasible regardless of any methods used. However with increase in sampling ratio CoSAMP achieves detection ratio of 1 using 10% less SUs compared to L1-Magic. OMP seems to require higher number of SUs to meet the accuracy of CoSAMP and L1Magic. Similar conclusion can be drawn from Fig. 2(b), where the graph of normalized error per grid for CoSAMP as a function of sampling ratio decreases much rapidly compared to the other two algorithms. Results from simulation (I) and (II) indicate that, CoSAMP is more robust and can perform with superior results compared to other two algorithms. The next set of simulations will be carried out using CoSAMP algorithm only.
Localization of Primary Users by Exploiting Distance Separation
459
Probability of Detection
1 0.8 0.6 0.4 L1 CoSAMP OMP
0.2 0 0.04
0.05
0.06
0.07 0.08 Compression Ratio
0.09
0.1
0.11
0.06
0.07 0.08 Compression Ratio
0.09
0.1
0.11
−1
Error Per Grid (Log−Scale)
10
−2
10
−3
10
L1 CoSAMP OMP
−4
10
0.04
0.05
Fig. 2. (a) Sampling ratio vs detection ratio (b) sampling ratio vs normalized error per grid
Refinement of Secondary User Set. From the theory of CS we learn that, columns with higher incoherence increases the probability of accurate recovery in CS [12]. In a typical scenario, we randomly distribute the SUs in the area of interest. This might cause a few SUs to be placed very closely to each other. Though close sensor spacing might be useful for some localization algorithms such as weighted centroid [3], this condition produces similar observations at different SUs and does not yield good performance using CS. The effectiveness of our technique to refine the SU measurement set was verified by Matlab. To test our refinement technique, we extracted two sets of SU positions from both a uniform and Gaussian spatial distribution. Our Matlab script takes the 2D position matrix of SUs and min − dist (minimum distance separation parameter) as an input and generates a refined set of SUs such that each SU is separated from an adjacent SU by min − dist. We assume in Section III that the spatial coordinates of the SUs are known a priori to FC. The known coordinates are then used to calculate the distance between pairs of SUs. The script identifies pairs of SUs with min − dist separation and removes one of the SUs from each pair. The script iterates through a loop until all SUs have a min−dist or greater separation between them. Fig. 3 shows that, as we sweep across minimum distance separation between SUs, the number of SU curve deceases even while maintaining a detection ratio of 1 for both sets of SUs. Our novel approach achieved reduction in the number of SU measurements by 21% and 30% for uniform distribution and normal distribution, respectively. The algorithm fails at a minimum distance separation of 400m for uniform and 600m for normal. This because at that point there are insufficient measurements to solve an undetermined linear system. Simulation (III) - SU Distribution. In this section we observe the impact of the spread of a particular spatial distribution, used to obtain location of
460
A. Biswas et al.
Fig. 3. (a) spread of distributions vs detection ratio (b) spread of distributions vs coherence (c) spread of distributions vs SNR
SUs in a CRN. The two dimensional SU positions are two dimensional random vectors with statistically independent elements. Two cases were considered. In the first case each element is uniformly distributed over [−Xmax σsd , Xmax σsd ]. In the second case, each element is zero mean Gaussian distributed with standard deviation {Xmax σsd }. While keeping the SNR constant and the number of SUs and PUs constant, the σsd is varied in the range [1, 6]. The following simulation is carried on CoSAMP algorithm only. Fig. 4 shows the impact of σsd on the detection ratio of CoSAMP; coherence of the measurement matrix Φ and average SNR at SUs. When σsd < 2 both sets of SUs generate poor detection of PUs. This is because of high coherence of Φ as shown in Fig. 4(b). As σsd > 2, coherence of measurement matrix for both plots monotonically decreases which enables CS algorithm to perform efficiently. Fig. 4(a) shows that, each set of SUs from different spatial distribution reaches a maximum detection ratio before dropping to a minimum. This behavior can be explained from the SNR plot in Fig. 4(c). When σsd > 1, SUs are being spread out widely across the area causing some SUs to have large distance separation from target PUs. This reduces the RSS and lowers the average SNR at the SUs. The SNR reaches a minimum, where it is difficult for CS algorithm to offer perfect recovery. However the rate at which average SNR decreases is dependent on distribution. Normal distribution having an infinite tail, might push some SUs further away from the area of interest. This influences the performance by having corrupted observations and can reduce the average SNR significantly. From the plots we can observe that, when σsd is too large, CS fails to perform efficiently in spite of having lower coherence between the columns of Φ.
Localization of Primary Users by Exploiting Distance Separation
461
Fig. 4. (a) spread of distributions vs detection ratio (b) spread of distributions vs coherence (c) spread of distributions vs SNR
7
Conclusion
In this paper we formulated a sparse problem to jointly determine the locations and transmission power of target PUs in a CRN using CS algorithm. Useful information about PUs can be extracted with selective positioning of SUs. We proposed a novel approach of pre-selecting a refined set of SUs from a randomly distributed set. A minimum distance separation is used as a constraint to remove closely placed SUs as well as highly correlated observations. This enables CS algorithms to accurately reconstruct a unique sparse vector with location and transmit power level information for transmitting PUs. Simulation results suggest that our approach achieved a reliable determination of PU positions and transmit powers in a practical CRN with a small number of SUs, as sensing stations. Reliable determination was demonstrated when the number of SUs are very close to the theoretical measurement bound of CS. To further test the effectiveness of our method, simulations were run for two spatial probability distributions for SU positions. In both cases our approach achieved the maximum detection ratio with relatively few secondary users performing receive power sensing.
References 1. Wang, S., Yang, Q., Shi, W., Wang, C.: Interference mitigation and resource allocation in cognitive radio-enabled heterogeneous networks. In: 2013 IEEE of Global Communications Conference (GLOBECOM), pp. 4560–4565, December 2013 2. Hu, D., Mao, S.: Co-channel and adjacent channel interference mitigation in cognitive radio networks. In: Military Communications Conference, MILCOM 2011, pp. 13–18, November 2011
462
A. Biswas et al.
3. Mariani, A., Kandeepan, S., Giorgetti, A., Chiani, M.: Cooperative weighted centroid localization for cognitive radio networks. In: 2012 International Symposium on Communication Communications and Information Technologies (ISCIT), pp. 459–464, October 2012 4. Werner, J., Wang, J., Hakkarainen, A., Valkama, M., Cabric, D.: Primary user localization in cognitive radio networks using sectorized antennas. In: 2013 10th Annual Conference on Wireless On-Demand Network Systems and Services (WONS), pp. 155–161, March 2013 5. Arambasic, I., Casajus, J.Q., Raos, I., Raspopoulos, M., Stavrou, S.: Anchor-less self-positioning in rectangular room based on sectorized narrowband antennas. In: Proceedings of the 2013 19th European, Wireless Conference (EW), pp. 1–6, April 2013 6. Chen, F., Valaee, S., Zhenhui, T.: Multiple target localization using compressive sensing. In: Global Telecommunications Conference, GLOBECOM 2009, pp. 1–6. IEEE, November 2009 7. Xue, L., Hong, S., Zhu, H., Zhiqiang, W.: Bayesian compressed sensing based dynamic joint spectrum sensing and primary user localization for dynamic spectrum access. In: 2011 IEEE of Global Telecommunications Conference (GLOBECOM 2011), pp. 1–5, December 2011 8. Jayawickrama, B.A., Dutkiewicz, E., Oppermann, I., Fang, G., Ding, J.: Improved performance of spectrum cartography based on compressive sensing in cognitive radio networks. In: 2013 IEEE International Conference on Communications (ICC), pp. 5657–5661, June 2013 9. Jamali-Rad, H., Ramezani, H., Leus, G.: Sparse multi-target localization using cooperative access points. In: 2012 IEEE 7th Sensor Array and Multichannel Signal Processing Workshop (SAM), pp. 353–356, June 2012 10. Candes, E.J., Wakin, M.B.: An introduction to compressive sampling. IEEE Signal Processing Magazine 25(2), 21–30 (2008) 11. Goldsmith, A.: Wireless Communications. Cambridge University Press, New York (2005) 12. Foucart, S., Rauhut, H.: A mathematical introduction to compressive sensing. Springer (2013) 13. Candes, E.J., Romberg, J.: l1-magic: Recovery of sparse signals via convex programming, 4(14) (2005). www.acm.caltech.edu/l1magic/downloads/l1magic.pdf 14. Tropp, J.A., Gilbert, A.C.: Signal recovery from random measurements via orthogonal matching pursuit. IEEE Transactions on Information Theory 53(12), 4655–4666 (2007) 15. Needell, D., Tropp, J.A.: Cosamp: Iterative signal recovery from incomplete and inaccurate samples. Applied and Computational Harmonic Analysis 26(3), 301–321 (2009)