to first identify the desired object and re-weight the features, and then to rank ...... distinguishing blue letter and white logo of the Fabric Soft- ener Box were not ... FabricSoftenerBox. DirtyWorkGloves. Apple. DirtyRunningShoe. JuliesPot.
Localized Content Based Image Retrieval [Extended Abstract] Rouhollah Rahmani, Sally A. Goldman, Hui Zhang, John Krettek, and Jason E. Fritts Department of Computer Science and Engineering Washington University St. Louis, Missouri 63130 {rahmani,
sg, huizhang, krettek, fritts}@wustl.edu
ABSTRACT Classic Content-Based Image Retrieval (CBIR) takes a single non-annotated query image, and retrieves similar images from an image repository. Such a search must rely upon a holistic (or global) view of the image. Yet often the desired content of an image is not holistic, but is localized. Specifically, we define Localized Content-Based Image Retrieval as a CBIR task where the user is only interested in a portion of the image, and the rest of the image is irrelevant. Many classic CBIR systems use relevance feedback to obtain images labeled as desirable or not desirable. Yet, these labeled images are typically used only to re-weight the features used within a global similarity measure. In this paper we present a localized CBIR system, Accio! , that uses labeled images in conjunction with a multiple-instance learning algorithm to first identify the desired object and re-weight the features, and then to rank images in the database using a similarity measure that is based upon individual regions within the image. We evaluate our system using a five-category natural scenes image repository, and benchmark data set, SIVAL, that we have constructed with 25 object categories.
Categories and Subject Descriptors H.3.3 [Information Systems]: Information Storage and Retrieval—relevance feedback, retrieval models
General Terms Algorithms, Experimentation
Keywords Image Retrieval, Relevance Feedback, Content Based Image Retrieval, Multiple Instance Learning
1.
INTRODUCTION
Classic Content-Based Image Retrieval (CBIR), when using a query-by-example interface, takes a single query image provided by the user, and retrieves similar images from an image repository. Since the user typically provides a single image with no indication of which portion of the image is of
Permission to make digital or hard copies of all or part of this work for personal or classroom use is granted without fee provided that copies are not made or distributed for profit or commercial advantage and that copies bear this notice and the full citation on the first page. To copy otherwise, to republish, to post on servers or to redistribute to lists, requires prior specific permission and/or a fee. MIR’05, November 10–11, 2005, Singapore. Copyright 2005 ACM 1-59593-244-5/05/0011 ...$5.00.
interest, such a search must rely upon a holistic (or global) view of the image. Yet often the desired content of an image is not holistic, but is localized. Specifically, we define Localized Content-Based Image Retrieval as a CBIR task where the user is only interested in a portion of the image and the rest of the image is irrelevant. Unless the user explicitly marks the region of interest or the region of interest is at a fixed location, localized CBIR must rely on multiple labeled images to learn which portion of the image is of interest to the user. We define the query image set as a set of images labeled by the user as positive or negative depending on whether or not they contain the desired content. The query image set can either be directly provided by a user or can be obtained using relevance feedback by adding labeled feedback images to the original query image (labeled as positive). While many classic CBIR systems use relevance feedback to refine the search, most of those systems use a global similarity measure that is re-weighted based on the feedback images. In Localized CBIR, the query image set must be used to identify the portion of the image that is relevant to the user’s search, as well to determine an appropriate weighting of the features. Furthermore, the relevant portion of the image is often an object that may vary in size, orientation and location. In this paper we present a Localized CBIR system, Accio! . Accio! uses a small query image set in conjunction with a multiple-instance learning algorithm to identify the desired local content, re-weight the features, and then rank images in the image repository by their content. The image representation used within Accio! enables it to perform well even when the desired content is a complex object defined by many parts. Furthermore, Accio! ’s ranking algorithm is general enough for the situation in which the desired images are defined by many different objects. Thus Accio! can be applied to standard CBIR tasks as illustrated by its performance on recognizing natural scenes. We evaluate Accio! both visually and objectively. We introduce the SIVAL (Spatially Independent, Variable Area, and Lighting) benchmark that we constructed with 25 image categories containing 1500 images1 . The SIVAL benchmark emphasizes the task of Localized CBIR. The categories consist of images of single objects photographed against highly diverse backgrounds. The objects may occur anywhere spatially in the image and also may be photographed at a wide1 The SIVAL benchmark, a color version of this paper, and related papers are available from the Accio! website www.cse.wustl.edu/∼sg/accio. A demonstration version of Accio! will be available in the near future.
angle or close up. We have created this benchmark since most of the Corel object images contain close-ups of an object that is centered in the image and typically occupies a majority of the image. We also use a natural scenes image repository with five categories containing 900 Corel images. Our experiments demonstrate that Accio! performs significantly better than both a variation of SIMPLIcity [20] that is designed to use a query image set of any size, and also against SBN [16], another Localized CBIR technique. For the SIVAL benchmark, when eight randomly selected positive and negative images are selected, Accio! obtains an average improvement of 30.9% over SIMPLIcity and 38.8% over SBN. Furthermore, when a single random positive example is placed in the query image set, Accio! obtains an average improvement of 10.0% over SIMPLIcity and 21.6% over SBN. Accio! also performs as well, or better, than both SBN and SIMPLIcity on our experiments using the natural scenes image repository. The remainder of this paper is organized as follows. Section 2 discusses related works. Accio! is described in Section 3 starting with the system architecture, and followed by a discussion of all the components. The SIVAL benchmark is briefly discussed in Section 4. Experimental results are presented in Section 5. Section 6 contains a conclusion and discussion of future work.
2.
RELATED WORK
Content-Based Image Retrieval (CBIR) is the problem of retrieving semantically relevant images from a large image database (or repository). In a typical query-by-example CBIR application, there is a query language used by the human user to specify a set of images that are desired. Some CBIR systems are region-based in that they use a segmentation algorithm to partition the image into regions that are similar in color, texture, or other features. There is an important distinction between region-based systems and Localized CBIR. In particular, whether or not a CBIR system is region-based is a function of how the image is processed, whereas a Localized CBIR system versus standard CBIR system is defined by whether or not the similarity metric used for ranking is global (i.e. combines properties from all regions/blocks of the image) or whether it depends on a subset of the regions/blocks. To help illustrate the distinction between a region-based system and Localized CBIR, we consider SIMPLIcity [20], a region-based standard CBIR system. SIMPLIcity partitions each image into 4x4 blocks, and extracts wavelet-based features from each block. It then uses a variant of the kmeans segmentation algorithm to create a feature vector (with color, texture, and shape components) for each region. SIMPLIcity ranks the images in the repository based on their similarity to the query image based on the integrated region matching (IRM) algorithm [13]. The IRM algorithm computes a global similarity measure based on a weighted sum of region-to-region distances with the weights selected to minimize the distance while ensuring that all regions are matched. Consequently, the top-ranked images in SIMPLIcity are those in which there are regions similar to all regions of the query image. In contrast, with a localized CBIR image, a highly ranked image would have some object(s) that are similar to those in the query set, but the expectation is that many objects will not have a match. Unless the user explicitly marks the region of interest or
the region of interest is at a fixed location, in Localized CBIR, there is no way to identify which portion of the image is of interest to the user from a single query image. One mechanism to get additional labeled images is through relevance feedback , where the user labels images from the results of an initial query as either desirable (positive) or not desirable (negative). These labeled images are commonly referred to as the feedback images. The feedback images are typically used to re-weight the features of the query image and then refine the results [7, 14, 3, 10, 11, 18]. While traditional relevance feedback weights the global features of the image [7, 14], in recent years several papers have focused on weighting spatially local features. Tian et al. [19] introduced two relevance feedback techniques for retrieving images by local content – Region-of-Interest (ROI) and Spatial Layout. Both techniques partition images into a uniform N × N grid, where N is typically between 2 and 5. Spatial Layout employs standard relevance feedback at the block level by weighting each feature of each block in the query image using the spatially corresponding blocks of the feedback images. The images in the image repository are ranked based on the combined similarity of its blocks to the spatially corresponding blocks of the weighted query image. Images with a rank above a given threshold are classified as positive (i.e. desirable). ROI is an extension to Spatial Layout in which the user is asked to draw a bounding box around the region of interest in the query image. ROI then weights each block relative to how much of its area is in the region of interest box. Both ROI and Spatial Layout can be viewed as an approach for localized CBIR that is based on an image-independent partitioning of the image into regions. Furthermore, they assume that the content of interest appears in the same region in the query image, feedback images, and relevant images from the repository. Kim, Park, and Kim [12] describe an image segmentation technique for central object extraction. Their technique aims to segment a possibly complex object that occurs in the center of the image from the background in which it occurs. They then discard the background and employ standard relevance feedback using only the central object. When applied to localized CBIR, this technique requires the object of interest to be in the center of the image. Thus, as with ROI and Spatial Layout, it does not generalize to the retrieval of local content that may occur anywhere within the image. Maron and Lozano-P´erez [15] proposed an approach (SBN) to Localized CBIR that applies multiple-instance (MI) learning to the task of recognizing a person from a series of images that are labeled positive if they contain the person, and are negative otherwise. (See Section 3.3 for further discussion of the MI model.) Their technique is not region-based, but rather divides all images into nine fixed , uniform-size, overlapping regions that consist of a single central block and four neighboring blocks. A new MI learning algorithm, Diverse Density(DD), was used to both learn which block was of interest, and to weight the features. This technique was used to learn descriptions of natural scene images (such as a waterfalls) and to retrieve similar images from a large image repository using the learned concept [16]. The benefit provided by the MI learning algorithm is that the content of interest need not be in the same block in all images. However, since pre-defined blocks are used to divide the image, difficulties arise when the object(s) of interest has important pieces that cross two blocks, or if it is too
small to significantly affect the average feature values in a block. An important distinction between both Accio! and SBN (Single-Blob with Neighbors), is that Maron et al. used an image-independent partitioning into blocks as opposed to a region-based approach. Yang et al. [21] built upon the work of Maron, by using a different fixed partitioning of the image and evaluating the quality of a hypothesis with a weighted correlation similarity measure instead of the diverse density. They divide the image into 20 pre-defined overlapping rectangular regions (1 is the entire image, 4 consist of 75% of the image, 6 consist of 50% of the image, and 9 consist of 25% of the image). They then smooth and sub-sample each region to obtain a 10 × 10 matrix of gray-scale values. This process is performed on the image and its left-right mirror resulting in the representation of the image as forty 10 × 10 matrices. A weighted correlation similarity measure is defined between any two such matrices, and adapted so that it can be used within the DD algorithm as the similarity measure between a hypothesis and an image. Accio! differs from this approach in many ways including that it uses a region-based approach, color and texture are used in the image representation, neighboring information is incorporated, and it uses a different MI algorithm. Zhang and Goldman [24] applied MI learning to localized CBIR using a segmentation algorithm to partition the image into segments (that can vary in size and shape). In addition, they introduced features to capture texture, and used the EMDD MI learning algorithm [25]. However, unlike the work of Maron et al., which uses neighboring blocks to provide information about the context of each block, Zhang and Goldman did not use any such neighboring information, since neighbors are not well defined when using a regionbased segmentation. Huang et al. [11] presented a variation of Zhang and Goldman’s approach that incorporated a different segmentation algorithm, and a neural network based MI algorithm. Andrews et al. [1] also applied the MI model to natural scene selection through two new algorithms which combined the MI learning model and support vector machines. A related, though different task, is to use a large set of images, each annotated with several key words, to learn a correspondence between objects and words. Both Accio! and the system of Duygulu et al. [6] use the EM algorithm [4], though in different ways. Duygulu et al. let the hidden variable be the region of the image associated with a word, whereas Accio! associates the hidden variable with the region of interest to the user. As discussed by Barnard et al. [2], the SBN algorithm can be applied to this object-word association problem by training a classifier for each word in the vocabulary. However, based on our experiments, we have found the the learned region is often only a portion, or even a neighbor, of the object of interest to the user. It is less clear how a system to perform object-word associations can be used to perform Localized CBIR. Furthermore, the systems of Barnard, Duygulu, de Freitas and Forsyth [6, 2] are trained using thousands of images, whereas Accio! performs well with a very small number of training images (≤ 16).
3.
ACCIO!
In this section we describe Accio! . We first describe the overall architecture for our system, as illustrated in Figure 1. A more detailed description of all components can be found
in Rahmani et al. [17]. The user provides a query image set to Accio! . As discussed in Section 1, the query image set can be obtained by adding the feedback set from relevance feedback to a single, initial query image (labeled as positive). There are some settings in which the user may directly create a query image set. For example, frames from surveillance video could be available for times when suspicious activity occurred (labeled as positive) and others for times when nothing out of the ordinary occurred (labeled as negative). Used in conjunction with an image repository containing unlabeled video frames, Accio! could be used to search for frames that have some object in common with those containing suspicious activity. Each image used by Accio! is first segmented and preprocessed as described below in Section 3.1. Next the bag generator is used to convert the segmented image into the format used by the MI learning algorithm. During this phase, a feature vector is created for each segment in the image with color and texture features added for both it and its neighboring segments. To reduce overhead during the ranking phase, all images in the repository are processed when placed into the repository. Each image’s representation as a bag is stored along with the raw and segmented image. For all feedback images in the query set, which already reside in the image repository, the segmentation algorithm and bag generator are bypassed. The next step is to provide the labeled bags from the query image set to the multiple-instance learning algorithm. Accio! uses Ensemble-EMDD, an improved version of the EM-DD algorithm [25] (See Section 3.4). Ensemble-EMDD performs a gradient search with multiple starting points to obtain an ensemble of hypotheses that are consistent with both the positive and negative images in the query image set. Although, one could select the “best” hypothesis returned from among all runs of the gradient search (as done in EMDD), it is beneficial to use all hypotheses when the desired content involves more than one object or a single object that can be defined in multiple ways. This provides a more robust Localized CBIR system. The MI learning algorithm returns a set of hypotheses which together are used to rank the images in the repository. Finally, a ranking algorithm combines the hypotheses returned by the learning algorithm to obtain an overall ranking of all images in the repository. (See Section 3.5.) These ranked images are shown to the user. As with classic CBIR systems that use relevance feedback, if the user is satisfied with his results, the current search has been completed. Otherwise, the user has the option of marking some of the ranked images as “desired” or “not desired,” and can then choose to either augment the query images by this additional set or use these labeled images as a new query set.
3.1 Image Representation All images are transformed into the YCrCb color space2 and then pre-processed using a wavelet texture filter so that each pixel in the image has three color features and three texture features. Typically texture feature extraction is computationally intensive for individual pixels. (The texture values for a pixel are defined using a neighborhood around the pixel.) We use a fast texture feature extraction method which takes advantage of the similarities between the neighboring pixels [23]. If desired, other features such 2
Accio! could use a different color space, if desired.
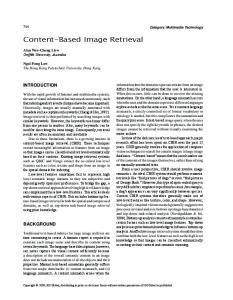
Figure 3: Illustration of the neighbor algorithm. Figure 1: The system architecture of Accio! . Neighbors(I) For each x ∈ I //x is a segment in I For each p ∈ x //p is a pixel in x For each j ∈ {N orth, East, South, W est} If Nj (p) ∈ y for y �= x ⇒ vote for y If Nj (p) ∈ image border ⇒ vote for x If Nj (p) ∈ x ⇒ do not vote For each direction j Nj (x) = segment with the most votes
Figure 2: I is the set of segments in the image, and Nj (p) is pixel neighboring p in cardinal direction j.
as those based on shape could also be included. Next, the Improved Hierarchical Segmentation (IHS) algorithm [22] is used to segment the image into a specified number of segments as set by the user. Including more segments generally leads to better performance but at the cost of increased computational complexity for the learning algorithm. The IHS algorithm uses a bottom-up approach that can make use of any desired similarity measure between two segments. The current implementation uses the Euclideandistance for this similarity measure. IHS begins with a segmentation where each pixel is an individual segment. Until a stopping condition is reached, IHS groups adjacent regions that are the most similar. The output of IHS is a tree in which there is a leaf for each pixel and an internal node represents two or more merged regions (segments) from the next lower level of hierarchy. IHS creates a hierarchy where the top level of the hierarchy is the final segmentation, and each level defines a finer-grained segmentation. Several parameters can be used in IHS to define a stopping condition. The option currently used by Accio! is to segment the images into a fixed number of segments. Another option that would be appropriate for Accio! would be to use a feature distance threshold for a stopping condition. Thus while the stopping condition currently used by Accio! results in all images having the same number of segments, IHS could result in images having a varying number of segments. The content desired by a user cannot always be defined by a single segment. For example, a flower is a set of petals adjacent to green leaves. A mountain is snow and rock adjacent to a blue sky. There is a semantic gap between the information provided by a single segment and the high level content the user perceives. The petals in and of themselves do not define the flower, nor does the snow define the mountain. Often it is the immediate surroundings that allow for a more complex and descriptive definition of the desired contents in
the image. Incorporating this property, our final representation augments the feature information for each segment with feature information of its neighboring segments. While the currently used segmentation algorithm produces contiguous segments3 , Accio! is designed to use any segmentation algorithm. To achieve this, it is necessary to provide a well-defined notion of a neighbor even when segments may or may not border the image on any side, can have any number of adjacent segments, and may not even define a contiguous regions (such as for the k-means segmentation algorithm [9]). Figure 2 presents our algorithm to compute four neighbors for every segment, one in each cardinal direction. Intuitively, the algorithm selects the most prominent neighbor in each direction. Figure 3 illustrates this algorithm on an image of a bird flying past a mountain which has a road leading to it. The segment for the mountain selects the sky as its northern, western, and eastern neighbor. It ignores the clouds, and the bird. The trees are selected as the southern neighbor, and the smaller road is ignored. The segment for the bird, selects the the mountain and the sky as its neighbors. So, a mountain is defined as being below the sky and above the trees. And a bird is defined as being an object surrounded by the sky or by a mountain. The feature vector for each segment is augmented with the difference between its neighbors’ value and its value for each of the six features, for all four neighbors. We use the difference between these feature values to allow for robustness against global changes in the image, such as changes in brightness and hues that result from different lighting. Throughout the remainder of this paper, we use the following geometric view for the image representation. Let I be a segmented image. Each segment x ∈ I can be viewed as a point in a 30-dimensional feature space. Specifically, the first 6 features hold the average color and texture values for x. The next 6 features hold the difference between the average color and texture values of the northern neighbor and x. Similarly there are 6 features for the difference information between x and its other 3 cardinal neighbors. Thus there are a total of 6 + 6 · 4 = 30 features. Each image is thus a set (or bag4 ) of points. For example, an image that is segmented into 8 regions, is represented as a bag holding 8, 30-dimensional points. While it is important that all points have the same number of dimensions, the size of the bag can vary between images. That is |I| need not be the same for all images. Finally, the query image set is stored and 3 A segment x said to be contiguous if there exists a connected path of pixels in x between any two pixels of x. 4 We use the standard terminology of the field, in which a bag of points is a set, not a mathematical bag, of points.
provided to the learning algorithm as a set of labeled bags, with one bag for each image in the query set.
3.2 Hypothesis Representation Accio! uses a MI learning algorithm to learn a set of hypothesis that are then used to rank the images. Each hypothesis captures the “ideal” feature values for the desired object along with a weighting of the features to indicate the degree of importance to the user’s query. Each hypothesis is represented by two 30-dimensional feature the vectors, �h and �s, where �h represents the point in the 30-dimensional space that corresponds to the “ideal” feature vector, and �s is a weight vector used to define the weighted Euclidean metric that is used as a similarity measure between points. For example, suppose the image query set contained several red, yellow, and orange flowers labeled as positive, along with non-flower images (that may contain yellow, orange, or red objects in them) labeled as negative. An ideal hypothesis describing these flowers may be a feature vector that has brightly colored features for the central segment (representing the petals) and dimmer, roughly textured features for the neighbor segments (representing the leaves and stem). The importance of the bright colors and the surrounding rough texture is embodied by the scale vector. In this example, it may not be possible to find a single hypothesis that distinguishes flowers from non-flowers. However, it may be possible to find a hypothesis that distinguishes red flowers from non-flowers, and one that distinguishes orange flowers from non-flowers, and so on. It is in such cases that Accio! can benefit from the multiple hypothesis returned from Ensemble-EMDD. Each hypothesis might describe one flower color and then they are combined by the ranking algorithm (see Section 3.5).
3.3 Multiple-Instance Learning Model The multiple-instance (MI) learning model was first formalized by Dietterich et al. [5] for the problem of drug discovery. Unlike standard supervised learning in which each instance is labeled in the training data, in this model each example is a set (or bag) of instances which is labeled as to whether any single instance within the bag is positive. The individual instances are not given a label. The goal of the learner is to generate a hypothesis to accurately predict the label of previously unseen bags. We now formally define the MI learning model and relate it to standard supervised learning. For ease of exposition, we define this model for learning a target concept that is a d-dimensional weighted hypothesis where each instance is a d-dimensional point. In particular, the target concept (�t, �s) consists of point �t = (t1 , . . . , td ) and scale (weight) vector �s = (s1 , . . . , sd ). For an arbitrary point p � = (p1 , . . . , pd ), we define v u d uX dist�s (�t, p �) = t (si (pi − ti ))2 . (1) i=1 2
The label for p � is given by �p� = e−dist�s (t,�p) . Observe that when the weighted Euclidean distance (based on �s) between p � and the target is 0, then the label is 1, and as the weighted Euclidean-distance between p � and the target approaches ∞, the label approaches 0. Furthermore, the label decays exponential with respect to the distance. For concept learning in which boolean labels are expected, we say that p�i is positive if and only if �pi ≥ 0.5. �
In standard supervised learning, the learner receives the label for each point: �(� p1 , �p1 ), (� p2 , �p�2 ), . . . , (� pm , �p�m )�. For example, consider an application to CBIR in which a global feature vector such as a color histogram is used. In this setting, each image is represented as a single point, and �t is the feature vector corresponding to the ideal value for each color in the histogram and �s as the ideal weighting of the features. Here each image is a single point with a label of positive (if the user likes the image) or negative otherwise. Such an approach captures how relevance feedback is used for re-weighting in standard CBIR. If there is such a target concept so that all desirable images are closer to �t (when weighted by �s) than all undesirable images, then color histogramming will yield good results. We now define the MI model. Here the target is still defined by �t and �s, and the label for an individual point p � is as in the standard supervised learning model. The difference in MI learning is that the examples are not single points but rather bags of points. More formally, the training data is {�B1 , �1 �, �B2 , �2 �, . . . �Bm , �m �} where �i is the label of bag Bi for Bi = {� pi,1 , p �i,2 , . . . � pi,|Bi | }. Let �i,j be the label of point p �i,j ∈ Bi . Then �i = max{�i,1 , �i,2 , . . . , �i,|Bi | }. In standard supervised learning, the learning algorithm receives the label of each point, whereas in multiple-instance learning, the learner only receives the label of each bag. Observe that the assumptions of the MI model match the requirements of Localized CBIR when using the representation described in Section 3.1. In the MI model each example is a bag of points, and we represent each image as set of points with one point for each segment. In a desirable image, many or most of the points represent irrelevant content – content that is not interesting to the user. However, we assume that at least one point is of interest (i.e. is similar to the target). In images that were labeled as negative in the query image set, all of the points are assumed to not be similar to the target.
3.4 Ensemble-EMDD Ensemble-EMDD, the new MI algorithm used by Accio! is built upon EMDD [25] that in turn is built upon the Diverse Density (DD) algorithm [15]. The diverse density of a point p � in the feature space is a probabilistic measure of both how many different positive bags have an instance near � p, and how far the negative instances are from p �. Intuitively, the diverse density of a hypothesis �h is just the likelihood (with respect to the data) that �h is the target. A high diverse density indicates a good candidate for a “true” concept. They then add a scale factor (weighting) for each dimension, and use a gradient search (with multiple starting values) to find the point that maximizes the diverse density. EMDD views the knowledge of which instance corresponds to the label of the bag as a missing attribute and applies the Expectation-Maximization (EM) algorithm of Dempster, Laird, and Rubin [4] to convert the multiple-instance learning problem to a standard supervised learning problem. EMDD starts with some initial guess of a target point �h and scale vector �s, and then repeatedly performs the following two steps. In the first step (E-step), the current �h and �s are used to pick one instance from each bag which is most likely (given the generative model) to be the one responsible for the label. In the second step (M -step), a single-instance variation of the diverse density algorithm is used. These steps are repeated until the algorithm converges. EMDD is
started at an initial value based on every point p � from five randomly selected positive bags from the query set with initial values of �h = p � and �s = �1. The hypothesis returned is the one obtained that maximizes the diverse density5 . There are several key changes the distinguish EnsembleEMDD from EMDD. First, along with starting at an initial point from a randomly selected set of positive bags, different initial scale factors for the weighting given to the segment or its neighbors are used. Specifically the initial weights used for the segment itself is 100%, 80%, 60%, 20% (all 5 regions, equally weighted), and 0%. The most significant change is that instead of returning the single hypothesis that maximizes the diverse density, Ensemble-EMDD returns the set of all hypotheses that are then combined within the ranking algorithm. Finally, all initial scale factors are adjusted based on the characteristics of the training data and the floating point precision of the underlying computer to reduce overflow and underflow problems in the gradient search. The system design for Accio! enables any multiple-instance algorithm to be used in place of Ensemble-EMDD. For example, either the mi-SVM or MI-SVM algorithm of Andrews et al. [1] could have been used for the learning algorithm. Based on the improvements of Ensemble-EMDD as compared to EMDD in our earlier experimental results, we conjecture that Ensemble-EMDD will out perform either of these algorithms and thus we currently use it within Accio! . Further experiments are needed to test this conjecture.
than a mediocre hypothesis. A good hypothesis will reflect more heavily in the average than many mediocre hypotheses. Furthermore, when the scale vectors (i.e. �s) of the hypotheses are unnormalized, the sparseness of the points in the hypothesis space causes the probability of a negative bag being falsely predicted as positive to become very low. Hence, accuracy in label prediction is increased. A second conjecture as to why average labeling works well is that even in Localized CBIR, the desired images may belong to a broad image domain where no single hypothesis can capture what images the user desires. For example, when looking for a mountain, the whiteness of snow neighboring the coarse texture of rock is one way to represent a mountain. The gray color of rock neighboring the smooth blue of the sky is another representation. Each of these are represented by a different hypothesis. By combining all hypotheses, Accio! can capture such disjunctive concepts. Thus, both an image with snow neighbored by rock and an image with rock neighbored by sky will be ranked highly. The combining of all hypothesis enables Accio! to generalize to broad retrieval tasks such as image scenes. Global content in image scenes would be captured by Accio! piecewise by each hypothesis. Then test images containing the most similar set of segments will be ranked the highest.
4. SIVAL BENCHMARK
The final stage of Accio! is to take the set of hypotheses returned by Ensemble-EMDD and combine them to rank the images in the image repository. While the EMDD algorithm used the hypothesis with the highest diverse density value, extensive experiments with CBIR data sets have shown statistically significant improvement in retrieval accuracy when retaining all the hypotheses [24, 17]. The similarity measure Accio! uses is an arithmetic average over the ensemble of the similarity measures given by each hypothesis. Let H = {(�h1 , �s1 ), . . . , (�hk , �sk )} be the set of hypotheses returned by Ensemble-EMDD. Let I be an image in the image repository that is segmented into r seg�r }. The ments and represented by the bag B = {� p1 , . . . , p Hausdorff distance between hypothesis Hi = (�hi , �si ) and B is given by d(Hi , B) = min dist�si (�hi , � pj ) where dist is the
In this section we briefly describe the SIVAL (Spatially Independent, Variably Area, and Lighting) benchmark that we have created. It consists of 25 different objects, and 10 scenes. There are six different images taken for each object-scene pair, and a total of 1500 images in the database. SIVAL emphasizes the task of Localized CBIR through nearly identical scenes which only vary by the localized target objects. It ensures there is one and only target object in each image. For each object class the same physical object was used in all scenes. It is also a difficult data set in that the scenes are highly diverse and often complex. Furthermore, the objects may occur anywhere spatially in the image and also may be photographed at a wide-angle or close up or with different orientations. In most image, the target object occupies less than 10%-15% of the image area but may occupy as much as 70%. Finally, the objects themselves are complex and generally correspond to multiple regions in a segmented image.
weighted Euclidean metric given in Equation (1). The label for bag B is given by
5. EXPERIMENTAL RESULTS
3.5 Ranking Algorithm
j=1,...,r
k 1 X −d(Hi ,B)2 �B = · e . k i=1
Finally, the images are ranked in decreasing order based on the label. Intuitively, normalizing the scale vector of each hypothesis and thus normalizing its Hausdorff distance to bag B would allow each hypothesis to reflect more fairly in label �B . However, when the hypotheses are unnormalized, the method perform better than any variation in our experiments of using a single hypothesis or multiple hypotheses. This ranking method works well since a good hypothesis is one that occurs very close to a point in a positive test bag. The label drops exponentially with relation to the distance of the hypothesis from a point in the bag. Thus a good hypothesis will give a label that is several magnitudes larger 5
Technically, the log of the diverse density is minimized.
We compare the performance of Accio! , SIMPLIcity, and the system of Maron and Ratan [16]. We use Maron and Ratan’s SBN (Single-Blob with Neighbors) representation and hypothesis selection scheme as a baseline [16]. However, we use the EMDD algorithm (as opposed to the DD algorithm), because of its empirical performance gains in both retrieval accuracy and time [24]. Since SIMPLIcity is designed to just use a single positive example, we created a variant of it that is designed to use any query image set. Let P is the set of positive images and N is the set of negative images in the query image set. For image q in the query image set and image x in the image repository, let rq (x) be the ranking SIMPLIcity gives to image x when the query image is q. (The highest rank image is rank 0 and the lowest rank image is n − 1, where n is the number of images in the repository.) The variation of SIMPLIcity we evaluated,
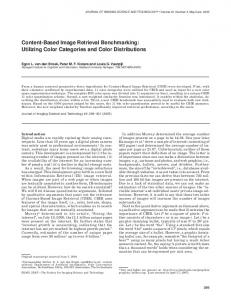
Figure 5: Accio! ’s 4th ranked image segmented (left) and colored to highlight the segments viewed as important (right).
Figure 6: A sample ROC curve for a query image set of 8 positive and 8 negative examples. ranked the images in decreasing order based on « Y Y„ rq (x) rq (x) · . 1− n n q∈P q∈N We selected this measure since it is similar Q to the definition of diverse density of a point t, DD(t) = q∈P∪N Pr(t|q). For an image q ∈ P, (1 − rq (x)/n) can be viewed as the probability that x is positive given that q is positive. Similarly, for an image q ∈ N , rq (x)/n can be viewed as the probability that x is positive given that q is negative. Observe that when given a single positive image, the ranking is the same as that given by SIMPLIcity. We visually evaluate Accio! by showing the top ranked images for a sample query image set as compared to that of other systems. However, one motivation for providing a benchmark data set is to enable systematic comparison between different systems. In order to achieve this goal, we use a single numeric measure to compare across a large number of tasks and to determine when differences in performance are statistically significant. As a measure of performance we have chosen to use the area under the ROC curve [8]. The ROC (Receiver Operating Characteristic) curve plots the true positive rate (i.e. the recall) as a function of the false positive rate. The area under the ROC curve (AUC) is equivalent to the probability that a randomly chosen positive image will be ranked higher than a randomly chosen negative image. Unlike the precision-recall curve, the ROC curve is insensitive to ratio of positive to negative examples in the image repository. Regardless of the fraction of the images that are positive, for a random permutation the AUC is 0.5.
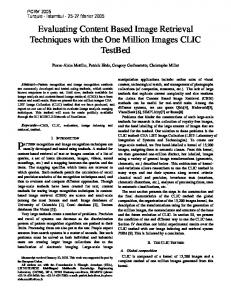
We first report results using the SIVAL benchmark. We used IHS to segment each image into 32 segments. The results from a sample query is shown in Figure 4. The images in the query set are in the image repository and thus included in the ranked images. For Accio! the three positive training images are the top ranked images. That occurs since they have more regions in common with hypotheses in the ensemble than images with just the fabric softener box. All the positive images in the query set have significant amounts of red objects, white objects, and shadows. SIMPLIcity is searching for an image that holistically matches these characteristics. Hence the best matching images are those taken in the newspaper scene, which has a dark red image, and shadowy white newspaper surrounding it. The distinguishing blue letter and white logo of the Fabric Softener Box were not significant enough for SIMPLIcity to diverge from the newspaper scene. SBN suffers from the lack of using a region-based approach and less flexibility in varying the neighbor weights which prevents it from recognizing fabric softener boxes that occur in scenes with different lighting. For Accio! , 28 of the top 30 images contain the fabric softener box. (The 24th and 30th image in Accio! ’s ranking is one with a coke can). Figure 5 shows the 4th ranked image of Accio! in segmented form, and an illustration of which segments were viewed as important. Along with focusing on portions of the fabric softener box, Accio! gives high weight to the object whose northern neighbor is the fabric softener box. To a lesser degree, it also focuses on the building in the upperright hand corner since it was in the background in one of the positive images of the query set. As another form of comparison, a sample ROC curve for an image query set for the checkered scarf object is shown in Figure 6. Next, we systematically compare the performance (using the average AUC as a measure) of Accio! , SIMPLIcity, and SBN for all 25 object categories of SIVAL. The first set of columns in Table 1 compares all 25 object categories of SIVAL when 8 random positive and 8 random negative examples from the image repository are placed in the query image set. For all AUCs reported, we repeat each experiment with 30 random selections of the positive and negative examples and use these to compute the average AUC and the 95% confidence intervals for the AUC. The entries marked by a dash are those in which the SIMPLIcity’s segmentation algorithm failed on a few images and thus results could not be provided. In every category, Accio! ’s performance is statistically better than that of both SIMPLIcity and SBN, with the exception of LargeSpoon for SBN. In most categories, the statistical difference in performance is quite large. Accio! has an average improvement of 30.9% over SIMPLIcity and 38.8% over SBN. Since SIMPLIcity was designed for a single positive query image, we also computed the AUC when a the query set contains only a single positive image. These results are shown in the second set of columns of Table 1. Observe that the version of SIMPLIcity we created to make use of a query image set with multiple images, did improve performance somewhat. In particular, for 12 of these 23 categories for which we obtained data, SIMPLIcity performed statistically better when using 8 positive and 8 negative examples, versus than with just 1 positive example. For the other 11 categories, there was no statistically significant difference.
Query Result Comparison
FabricSoftenerBox
FabricSoftenerBox
FabricSoftenerBox
GoldMedal
SpriteCan
AjaxOrange
Negative Query Images
Positive Query Images
SIMPLIcity
Accio!
SBN
FabricSoftenerBox
FabricSoftenerBox
DirtyRunningShoe
DirtyRunningShoe
FabricSoftenerBox
FabricSoftenerBox
SpriteCan
CheckeredScarf
GreenTeaBox
CandleWithHolder
FabricSoftenerBox
FabricSoftenerBox
DirtyWorkGloves
FeltFlowerRug
CheckeredScarf
SmileyFaceDoll
FabricSoftenerBox
FabricSoftenerBox
FeltFlowerRug
BlueScrunge
GlazedWoodPot
CandleWithHolder
FabricSoftenerBox
FabricSoftenerBox
JuliesPot
CandleWithHolder
CheckeredScarf
CardboardBox
FabricSoftenerBox
FabricSoftenerBox
DirtyWorkGloves
AjaxOrange
DirtyWorkGloves
TranslucentBowl
FabricSoftenerBox
FabricSoftenerBox
Apple
GreenTeaBox
DirtyRunningShoe
DirtyRunningShoe
FabricSoftenerBox
DirtyRunningShoe
Figure 4: Result from a sample query. The images are shown in row-major order based on their ranking.
Object Type CheckeredScarf GreenTeaBox FeltFlowerRug FabricSoftenerBox DirtyRunningShoe WD40Can CokeCan JuliesPot GoldMedal TranslucentBowl SmileyFaceDoll AjaxOrange DataMiningBook GlazedWoodPot SpriteCan StripedNotebook BlueScrunge CandleWithHolder CardboardBox WoodRollingPin Banana DirtyWorkGloves Apple RapBook LargeSpoon
Query Accio! 90.8 ± 1.6 87.3 ± 3.0 86.9 ± 1.7 86.6 ± 3.0 83.7 ± 1.9 82.0 ± 2.4 81.5 ± 3.5 79.2 ± 2.6 77.7 ± 2.6 77.5 ± 2.3 77.4 ± 3.3 77.0 ± 3.4 74.7 ± 3.4 72.7 ± 2.3 71.9 ± 2.5 70.2 ± 3.2 69.5 ± 3.4 68.8 ± 2.3 67.9 ± 2.2 66.7 ± 1.7 65.9 ± 3.3 65.3 ± 1.5 63.4 ± 3.4 62.8 ± 1.7 57.6 ± 2.3
Set (8 pos., 8 SIMPLIcity 69.1 ± 1.0 55.8 ± 0.7 58.2 ± 0.9 55.3 ± 1.1 66.0 ± 0.9 57.9 ± 1.0 58.2 ± 1.1 57.7 ± 0.7 60.1 ± 1.1 54.6 ± 1.5 60.5 ± 1.2 56.8 ± 0.6 52.4 ± 2.1 57.9 ± 0.8 57.6 ± 0.8 55.7 ± 0.9 54.4 ± 1.1 60.1 ± 0.9 57.9 ± 0.8 51.7 ± 0.9 60.1 ± 0.9 52.2 ± 1.0 60.4 ± 0.6 -
neg.) SBN 59.6 ± 1.6 51.6 ± 1.0 53.2 ± 3.1 53.3 ± 2.1 57.5 ± 2.0 50.6 ± 1.2 48.9 ± 1.6 52.3 ± 2.3 53.4 ± 1.6 55.9 ± 3.4 54.4 ± 2.4 52.2 ± 1.8 62.8 ± 4.5 54.9 ± 2.5 50.4 ± 1.8 52.8 ± 2.4 53.2 ± 2.5 53.0 ± 1.2 53.9 ± 1.7 52.5 ± 1.7 53.9 ± 2.3 55.4 ± 1.9 50.2 ± 1.5 52.0 ± 1.7 60.7 ± 3.1
Single Positive Query Accio! SIMPLIcity 78.2 ± 3.5 65.2 ± 1.6 65.6 ± 4.4 53.5 ± 1.5 69.2 ± 3.9 55.4 ± 1.3 70.8 ± 4.8 54.1 ± 1.6 78.6 ± 2.9 61.9 ± 1.1 65.4 ± 5.2 55.8 ± 1.8 65.5 ± 3.8 55.0 ± 1.2 58.9 ± 3.1 55.4 ± 1.6 57.3 ± 2.3 57.1 ± 2.1 61.2 ± 3.7 54.6 ± 3.3 60.0 ± 2.4 55.1 ± 1.5 56.3 ± 2.7 54.6 ± 1.1 53.9 ± 3.1 55.6 ± 4.4 58.0 ± 2.6 55.6 ± 1.9 60.8 ± 3.4 54.4 ± 1.5 56.3 ± 2.4 56.9 ± 1.5 50.4 ± 3.2 53.9 ± 2.7 62.5 ± 2.2 61.6 ± 2.2 56.6 ± 1.4 60.2 ± 1.5 55.1 ± 0.8 52.8 ± 1.7 50.8 ± 1.7 60.7 ± 1.4 56.6 ± 1.2 52.2 ± 3.0 50.5 ± 1.4 56.4 ± 1.1 57.0 ± 0.9 53.2 ± 1.9 -
Image SBN 58.0 ± 3.6 50.1 ± 1.0 45.9 ± 1.5 52.1 ± 2.1 57.6 ± 1.8 49.4 ± 1.3 47.0 ± 1.6 49.6 ± 2.0 51.6 ± 3.1 45.8 ± 2.8 46.7 ± 3.2 52.4 ± 2.0 46.0 ± 3.6 49.3 ± 2.0 48.6 ± 1.3 51.9 ± 1.8 46.7 ± 3.5 54.1 ± 0.8 50.6 ± 2.6 50.0 ± 3.7 49.6 ± 2.2 51.8 ± 2.7 45.0 ± 3.0 51.2 ± 1.5 55.3 ± 5.0
Table 1: Results for the SIVAL repository. category Field
Flower
Mountain
Sunset
Waterfall
system Accio! SIMPLIcity SBN Accio! SIMPLIcity SBN Accio! SIMPLIcity SBN Accio! SIMPLIcity SBN Accio! SIMPLIcity SBN
1 (1,0) 71.5 ± 4.1 72.9 ± 3.4 57.5 ± 7.1 65.3 ± 4.2 65.7 ± 6.6 62.5 ± 5.5 76.3 ± 3.1 79.4 ± 3.0 68.5 ± 4.9 78.5 ± 7.9 70.5 ± 8.4 52.3 ± 5.4 80.9 ± 2.6 80.3 ± 5.4 66.2 ± 3.3
Query Set Size (#pos, #neg) 4 (2,2) 8 (4,4) 16 (4,12) 83.1 ± 3.0 86.2 ± 2.1 86.6 ± 1.9 77.9 ± 2.6 78.1 ± 2.0 78.2 ± 2.0 73.0 ± 1.8 71.7 ± 2.6 72.2 ± 2.5 72.5 ± 4.1 78.1 ± 3.1 80.5 ± 1.9 60.8 ± 5.6 63.3 ± 3.4 63.1 ± 3.0 63.0 ± 4.4 68.3 ± 4.2 72.6 ± 4.2 78.4 ± 2.4 81.5 ± 1.1 82.4 ± 1.4 78.7 ± 2.1 81.1 ± 1.4 80.8 ± 1.2 67.3 ± 3.8 68.8 ± 3.6 72.5 ± 3.7 93.9 ± 1.2 95.1 ± 0.8 96.1 ± 0.3 64.8 ± 7.3 68.9 ± 4.8 67.5 ± 5.2 61.4 ± 4.1 65.6 ± 5.0 67.5 ± 3.4 82.3 ± 2.5 87.3 ± 1.0 86.4 ± 0.9 81.0 ± 1.2 82.8 ± 0.9 82.6 ± 1.1 65.4 ± 3.8 64.6 ± 3.7 65.5 ± 4.2
16(8,8) 87.6 ± 1.4 79.7 ± 1.3 73.0 ± 2.3 82.5 ± 2.0 61.2 ± 3.3 74.8 ± 3.2 82.9 ± 0.9 81.0 ± 0.9 74.8 ± 3.8 96.5 ± 0.3 69.4 ± 4.5 73.8 ± 3.0 89.0 ± 0.5 83.2 ± 0.8 71.8 ± 2.8
Table 2: Results for natural scenes image repository. However in 10/11 of them, the average AUC was slightly higher when using the 16 training images. While it is possible, that a different way of adapting SIMPLIcity to use multiple training images may yield a better performance, we believe the cause of this behavior is the global similarity metric used by SIMPLIcity cannot separate the properties of the desired object from the other objects in the image. When given a single positive example, Accio! obtains an average improvement of 10.0% over SIMPLIcity and 21.6% over SBN. For these experiments, Accio! performs significantly better than SIMPLIcity in 12 of the 23 experiments. Of the remaining 11 experiments, Accio! had a higher AUC average than SIMPLIcity in 7 experiments. On average Accio! obtains a 8.3% improvement in performance over SIMPLIcity. We believe the reason for this behavior is that Accio! is able to find images with individual objects that are similar to any object in the query image. While many of these objects are those found in the scene (as opposed
to parts of the desired object), Accio! is able to locate the desired object in a variety of scenes. This behavior enables Accio! to perform better than SIMPLIcity even with a single positive query image. More significantly, Accio! can dramatically improve its performance when given a small query image set as illustrated both in the average AUC values in Table 1, and in the sample results of Figure 4. Finally, we compare these systems using a natural scene images from the Corel image suite with 5 image categories. (See Table 2.) The results we report are all based on an image repository of 900 images with 180 from each of the five categories. Thus for the task of retrieving images from one particular category, there are 180 positive images in the repository (i.e. from the desired image group) and 720 negative images in the repository (180 from each of the remaining four image groups). The natural scene database we used is strongly characterized by high variation between images within any category, and the categories are not disjoint. For
example, some waterfall images are of a waterfall in the mountains. While we used IHS with 32 segments per image, we have also performed experiments with other segmentation algorithms. To illustrate, the ability of Accio! to work with other segmentation algorithms, we report the results when using the k-means segmentation method where k = 5 for 8 positive and 8 negative images in the query image set: field (88.5 ± 1.0), flower (75.7 ± 2.8), mountain (82.9 ± 0.9), sunset (94.5 ± 0.7), waterfall (87.1 ± 0.7). Again, the performance of Accio! is significantly better than that of both SIMPLIcity and SBN in almost all cases. The only exceptions were that the performance of Accio! and SIMPLIcity are comparable when give only one positive query image. Also the performance of Accio! and SIMPLIcity is similar when retrieving mountains and retrieving waterfalls with less than 8 images in the query set. In summary, Accio! significantly outperforms existing systems on the SIVAL benchmark designed for Localized CBIR. It obtains such performance partly due to its similarity metric that is based upon individual regions of the image. This similarity metric enables Accio! to find images with regions similar to those that occur in positive example images but not in negative example images. Perhaps the most surprising results are that Accio! performs better than to SIMPLIcity when given a single positive query image on the SIVAL benchmark, and comparable to SIMPLIcity on natural scenes image repository. The advantage of the localized CBIR approach of Accio! , in such a setting, is also based on the localized aspect of the similarity metric that enables it to give a high ranking to any image that contains similar regions as those in the single positive query image. For example, when retrieving sunsets, Accio! , can focus on the orange color of the sun without being distracted by the other objects in the image.
6.
CONCLUDING REMARKS
We have presented, Accio! , a Localized CBIR system that does not assume the desired object(s) are in a fixed location or have a fixed size. We have demonstrated that Accio! outperforms existing systems for Localized CBIR on a natural scenes image repository and a benchmark data set for Localized CBIR that we have provided. There are many directions for future work. We plan to compare Accio! , to existing CBIR systems that use relevance feedback. We also believe that Accio! can be improved further by making further improvements to Ensemble-EMDD, by employing improved segmentation algorithms, and perhaps by the careful introduction of some features to represent shape.
7.
ACKNOWLEDGMENTS
We would like to thank Sharath Cholleti, Ibrahim Noorzaie, and Ian Bushner for all of their valuable feedback and ideas. This material is based upon work supported by the National Science Foundation under Grant No. 0329241.
8.
REFERENCES
[1] S. Andrews, T. Hofmann, and I. Tsochantaridis. Multiple instance learning with generalized support vector machines. Artificial Intelligence, pages 943–944, 2002. [2] K. Barnard, P. Duygulu, N. de Freitas, and D. Forsyth. Matching words and pictures. Journal of Machine Learning Research 3, pages 1107–1135, 2003.
[3] I. Cox, M. Miller, S. Omohundro, and P. Yianilos. Pichunter: Bayesian relevance feedback. Int. Conf. on Pattern Recognition, pages 361–369, 1996. [4] A. Dempster, N. Laird, and D. Rubin. Maximum likelihood from incomplete data via the em algorithm. Journal of the Royal Statistics Society, pages 1–38, 1977. [5] T. G. Dietterich, R. H. Lathrop, and T. Lozano-P´ erez. Solving the multiple-instance problem with axis-parallel rectangles. Artificial Intelligence, pages 31–37, 1997. [6] P. Duygulu, K. Barnard, N. de Freitas, and D. Forsyth. Object recognition as machine translation: learning a lexicon for a fixed image vocabulary. 7th European Conf. on Computer Vision, pages IV:97–12, 2002. [7] T. Gevers and A. Smeulders. Emerging Topics in Computer Vision, chapter Image Search Engines: An Overview. Prentice Hall, 2004. [8] J. Hanley and B. McNeil. The meaning and use of the area under a receiver operating characteristic (ROC) curve. Radiology 143, 29–36, 982. [9] J. Hartigan and M. Wong. Algorithm as136: a k-means clustering algorithm. Applied Statistics, pages 100–108, 1979. [10] X. He, W.-Y. Ma, O. King, M. Li, and H. Zhang. Learning and inferring a semantic space from user’s relevance feedback for image retrieval. Proc. of 10th ACM Int. Conf. on Multimedia, 2002. [11] X. Huang, S.-C. Chen, M.-L. Shyu, and C. Zhang. User concept pattern discovery using relevance feedback and multiple instance learning for content-based image retrieval. 8th Int. Conf. on Knowledge Discovery and Data Mining, pages 100–108, 2002. [12] S. Kim, S. Park, and M. Kim. Central object extraction for object-based image retrieval. 2nd Int. Conf. Image and Video Retrieval, pages 39–49, 2003. [13] J. Li, J. Wang and G. Wiederhold. IRM: integrated region matching for image retrieval. Proc. of 8th ACM Int. Conf. on Multimedia, pages 147–156, 2000. [14] F. Long, H. Zhang, and D. Feng. Multimedia Information Retrieval and Management- Technological Fundamentals and Applications, chapter Fundamentals of Content-Based Image Retrieval. Springer, 2003. [15] O. Maron and T. Lozano-P´ erez. A framework for multiple-instance learning. Neural Information Processing Systems, 1998. [16] O. Maron and A. Ratan. Multiple-instance learning for natural scene classification. 15th Int. Conf. on Machine Learning, pages 341–349, 1998. [17] R. Rahmani, S. Goldman, H. Zhang, and J. Fritts. Accio: A localized content-based image retrieval system. Technical report, Washington University in St Louis, 2005. [18] Y. Rui, T. Huang, M. Ortega, and S. Mehrotra. Relevance feedback: A power tool in interactive content-based image retrieval. IEEE Transactions Circ. Sys. Video Technology, pages 644–655, 1998. [19] Q. Tian, Y. Wu, and T. S. Huang. Combine user defined region-of-interest and spatial layout for image retrieval. Int. Conf. on Image Processing, 2000. [20] J. Wang, J. Li, and G. Wiederhold. SIMPLIcity: semantics-sensitive integrated matching for picture libraries. IEEE Transactions on Pattern Analysis and Machine Intelligence, pages 947–963, 2001. [21] C. Yang and T. Lozano-P´ erez. Image database retrieval with multiple instance techniques. Proc. of the 16th Int. Conf. on Data Engineering, pages 233-243, 2000. [22] H. Zhang, J. Fritts, and S. Goldman. An improved fine-grain hierarchical method of image segmentation. Technical report, Washington University in St Louis, 2005. [23] H. Zhang, J. Fritts, and S. Goldman. A fast texture feature extraction method for region-based image segmentation. Proc. of IS&T/SPIE’s 16th Annual Symposium on Image and Video Communication and Processing, SPIE Vol. 5685, 2005. [24] Q. Zhang, S. Goldman, W. Yu, and J. Fritts. Content base image retrieval using multiple-instance learning. In 19th Int. Conf. on Machine Learning, pages 682–689, 2002. [25] Q. Zhang and S. Goldman. EM-DD: An improved multiple-instance learning technique. Advances in Neural Information Processing Systems 14 (Proc. for NIPS 2001), pages 1073–1080, 2002.