Feature selection was carried out using a combination of bootstrap resampling procedure with the stepwise selection technique. Additionally, due to the ...
Logistic Regression Models for Predicting Resistance to HIV Protease Inhibitor Nelfinavir L.M. Raposo1, M.B. Arruda2, R.M. Brindeiro2, and F.F. Nobre1 1
Department of Electronics, Informatics and Bioengineering, Politecnico di Milano, Milano, Italy 2 Fresenius Medical Care, Bad Homburg, Germany 3 Center for Biomedical Technology at the Danube, University of Krems, Austria
Abstract — The development of models to predict the resistance to the antiretroviral drugs can be useful in making a decision regarding the best therapy for HIV+ individuals. This study developed predictive models of resistance to the protease inhibitor Nelfinavir using logistic regression. The data comprises a total of 625 patients for which HIV-1 genotype was available, with 130 resistants to Nelfinavir in the last regimen. Feature selection was carried out using a combination of bootstrap resampling procedure with the stepwise selection technique. Additionally, due to the unbalanced nature of the dataset, we develop four balanced final models. The accuracies of the models ranged from 70.40 to 76.80% and areas under the ROC curve (AUC) ranged from 0.657 to 0.687. The best model had AUC equal to 0.687, accuracy of 76.80%, specificity of 84.21% and sensitivity of 53.33%. The agreement between this model and the known resistance level was fair, Kappa index of 0.3712. Keywords— HIV, Logistic Models, Drug Resistance
INTRODUCTION In Brazil, since 1996 the antiretroviral therapy has been offered freely and universally [1], with a reduction in morbidity and mortality as well as an increased quality of life of patients [2]. In some cases, the therapy did not show durable clinical benefit due to several factors such as poor adherence to the treatment, loss of one or more clinic visits, high viral load, low count of CD4 + T cells and resistance to antiretroviral drugs [3-5], which has been a major obstacle in getting a lasting treatment. HIV drug susceptibility can be evaluated either by genotyping or phenotyping. Genotyping identifies genetic mutations associated with resistance to antiretroviral drugs. It is faster, has a lower cost and is more accessible [6]. Phenotyping provides a direct measure of susceptibility to HIV antiretrovirals, but is very expensive, and requires special laboratories [6,7]. Several studies have proposed models to predict HIV resistance using genotyping. The range of methods varies from basic statistical methods [8,9] to modern machine learning algorithms [6,10,11]. Here, we develop models to predict resistance to the HIV protease inhibitor Nelfinavir using logistic regression, a generalized
linear model widely used to make predictions or to explain the occurrence of a specific event when the response variable is binary, and a combination of bootstrap with stepwise procedure to select the variables for the model.
MATERIAL AND METHODS The data used in this study are from 625 infected individual, and was made available by the Laboratory of Molecular Virology from the Center of Health Sciences, Federal University of Rio de Janeiro, Brazil. It consists of the amino acid sequences of the protease enzyme of the pol gene from HIV-1 subtype B, counting of CD4+ T cells, and viral load in the last period of treatment as markers of treatment failure for Nelfinavir. For patients that were not using or did not show resistance to the drug in the last therapeutic regimen, the response variable was coded as 0 and, for those who showed resistance to the therapy, the variable was coded as 1.The set of explanatory variables were the mutations described by the International AIDS Society (IAS) [12] associated with resistance to Nelfinavir: L10, D30, M36, M46, A71, V77, V82, I84, N88 and L90. The sequence is represented by a letter corresponding to one of the 20 amino acids and a number, indicating the wild type amino acid residue and its position in the sequence. The amino acids were coded according to the hydrophobicity scale of Eisenberg [13] and used as input in the logistic model. Additionally, we used the count of CD4 + T cells and the viral load in the last period of drug use. The sample was initially split into two subsets. The first, with 500 subjects; 100 with therapeutic failure, was used for the selection of variables and to obtain four models. The second subset, with 125 patients; 30 with therapeutic failure, was used as a test set to evaluate the models. The best set of features was selected using the bootstrap technique [14] such that the logistic regression is applied 1000 times to bootstrap samples obtained by resampling with repetition from the 100 samples with therapeutic failure in the training set, and combining with 100 patients randomly selected from the 400 non-resistant samples,
L.M. Roa Romero (ed.), XIII Mediterranean Conference on Medical and Biological Engineering and Computing 2013, IFMBE Proceedings 41, DOI: 10.1007/978-3-319-00846-2_306, © Springer International Publishing Switzerland 2014
1237
1238
L.M. Raposo et al.
generating a balanced set for model estimation. The variables at each bootstrap were selected by the stepwise method, using the Akaike Information Criterion (AIC) [15]. The most frequent (> 60%) variables in the models were D30 (90.7%), M36 (77.0%), V77 (78.7%) and L90 (91.1%). From four subsets obtained from the training set (100 resistant individuals and 100 non-resistant randomly selected from a total of 400 non-resistant), we created four models using as explanatory variables the most frequently variables. The performance of the four models was evaluated at the cutoff of 0.5, according to accuracy, sensitivity, specificity and Kappa index. In addition we obtained the area under the receiver operating characteristic (ROC) curve (AUC). The accuracy (A) is defined as the proportion of correct classification by the model over the total sample. This metric is given by the following formula: A = (TP + TN) / (TP + FP + VN + FN)
(1)
where TP, FP, TN and FN are true positives, false positives, true negatives and false negatives, respectively. The sensitivity (S) is defined as the proportion of true positives as compared to the total positive class, whereas specificity (E) comprises the proportion of true negatives in relation to the total negative class. S = TP / (TP + FN)
(2)
E = TN / (TN + FP)
(3)
The ROC curve is obtained by drawing pairs of sensitivity and false positive rate (1 – specificity) at different cutoff points. It shows the relationship between the sensitivity and specificity of a test and can be used in deciding the best cutoff [16]. The Kappa index measures the degree of agreement between different techniques beyond what would be expected by chance. It is calculated by dividing the difference between the expected and observed agreement and the difference between the absolute and expected agreement. The Kappa index is evaluated according to the scale of Landis, where a value equal to 1 indicates perfect agreement, between 1 and 0.80 indicates almost perfect agreement, between 0.60 and 0.79 represents considerable agreement, between 0.40 and 0,59 indicates moderate agreement, between 0.20 and 0.39 indicates reasonable agreement, between 0 and 0.19 represents low concordance and values less than 0 indicate no agreement [17]. All analyzes were performed using the software R version 2.15.
RESULTS The average age of patients was 38.46 years (± 11.55), with a predominance of males (67.36%). About clinical characteristics, viral load had an average of 4.57 million copies of HIV/ml of blood, with inter-quartile range equal to (4.09 to 5.00), and the count of CD4 + T cells showed an average from 300.50 cells/mm ³ of blood, with inter-quartile range equal to (127.0 to 420.0). The four models obtained using logistic regression showed the following equations and AICs: Model 1: Resistance = 18.83 + 23.73D30 – 1.59L90 + 0.87M36 + 2.21V77, AIC equal to 231.26. Model 2: Resistance = 3.09 + 6.22D30 – 2.15L90 + 1.58M36 + 2.36V77, AIC equal to 259.55. Model 3: Resistance = 17.15 + 23.91D30 – 1.75L90 + 0.99M36 + 3.79V77, AIC equal to 226.27. Model 4: Resistance = 11.44 + 17.72D30 – 2.41L90 + 1.53M36 + 4.07V77, AIC equal to 231.87. Table 1 shows the confusion matrices indicating the distribution of patients according to the classification given by the models and the actual outcome and table 2 shows the performance of the models. Table 1. Distribution of patients in the test set according to the models and the actual outcome (n = 125). Model 1 Resistant Non-resistant Model 2 Resistant Non-resistant Model 3 Resistant Non-resistant Model 4 Resistant Non-resistant Total Total
Resistant
Non-resistant
Total
17 13
23 72
40 85
18 12
24 71
16 14
15 80
31 94
17 13 30 30
24 71 95 95
42 83 125 125
42 83
Model 3 showed, in general, better performance compared to the other models with higher values to accuracy (76.80%), specificity (84.21%), AUC (0.6877) and Kappa coefficient (0.3712).
IFMBE Proceedings Vol. 41
Logistic Regression Models for Predicting Resistance to HIV Protease Inhibitor Nelfinavir
Table 2
Performance of the logistic regression models.
Model 1 Model 2 Model 3 Model 4 [CI95%] [CI95%] [CI95%] [CI95%] AUC 0.6623 0.6737 0.6877 0.657 71.20 71.20 76.80 70.40 Accuracy [62.72 – 78.41] [62.72 – 78.41] [68.67 – 83.33] [61.89 – 77.70] 60.00 53.33 56.67 56.67 Sensitivity [39.20 – 72.62] [42.32 – 75.41] [36.14 – 69.77] [39.20 – 72.62] 74.74 84.21 74.74 75.79 Specificity [66.28 – 83.29] [65.16 – 82.40] [75.57 – 90.19] [65.16 – 82.40] Kappa Index 0.2913 0.3056 0.3712 0.2790
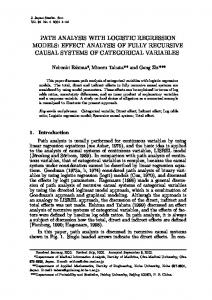
Figure 1 shows the ROC curves of the four models. The circles marked on the graph indicate the sensitivity and specificity of the models when a cutoff equal to 0.5 was assumed.
DISCUSSION In the present study, we developed logistic regression models to predict the resistance to the antiretroviral Nelfinavir. We used data from the National Network of Genotyping (RENAGENO). This is the first study where these data were used for developing resistance models. Our modeling approach differs from most others that used logistic regression by using a bootstrap technique combined with the classical stepwise method for feature selection. A particular advantage of this approach is that it
1239
allows to better assess the relative importance of each variable for the final logistic regression. The use of balanced data was also considered in our study. In classification problems it is not adequate to use imbalanced data sets, since there is a tendency of the model to be biased towards the majority class over the minority one. The accuracies and areas under the ROC curves ranged from 70.40 to 76.80% and from 0.657 to 0.6877, respectively. The four logistic regression models showed performances very similar, with no significant difference between them at the significance level of 5%. The best model was model 3, showing better AUC (0.6877), accuracy (76.80%) and specificity (84.21%), but a reduction in sensitivity (53.33%). This model also had the highest Kappa coefficient (0.3712), indicating reasonable agreement. When selecting a model, it is important to know different performance parameters such as sensitivity and specificity. Many studies do not present these parameters, reducing the interpretation of their results. In the study developed by Prosperi (2009) [8], the values of accuracy (68.27 to 73.32%) and AUC (0.619 to 0.773) were very close to those of this study. Logistic regression has some limitations since it exploits a linear combination of the variables. However, it is simple to implement and is available in several statistical packages, easy to interpret and a well-known model approach in different areas. Additionally, there are still some controversies regarding the use of more sophisticated and non-linear models in predicting antiretroviral drug resistance [8]. The models proposed in this study may contribute for the classification of new individuals in relation to the development of resistance to Nelfinavir and is a simple tool that can help in each HIV+ individual. Nelfinavir was used for being a drug extensively used in the therapy and so, a rich database of information is available. However, this first generation protease inhibitor is currently has little clinical use. Nevertheless, the proof of the the proposed mathematical model will enable its use to uncover other complex patterns of resistance due to new antiretroviral drugs , which still lack extensive data on associated resistance mutations associated, especially considering the genetic variability of HIV-1 and its several subtypes.
REFERENCES 1.
Dourado I, Veras M A D S M, Barreira D et al. (2006) Tendências da epidemia de Aids no Brasil após a terapia anti-retroviral. Revista de Saúde Pública 40:9-17
IFMBE Proceedings Vol. 41
1240
2. 3. 4.
5. 6. 7.
8.
9. 10. 11. 12. 13.
14. 15. 16. 17.
L.M. Raposo et al.
Bushman F, Landau N R, Emini E A. (1998) New developments in the biology and treatment of HIV. Proc Natl Acad Sci USA 95(19):11041-11042 Fätkenheuer G, Theisen A, Rockstroh J et al. (1997) Virological treatment failure of protease inhibitor therapy in an unselected cohort of HIV-infected patients. Aids 11(14):F113-F116 Zolopa A R, Shafer R W, Warford A et al. (1999) HIV-1 genotypic resistance patterns predict response to saquinavir-ritonavir therapy in patients in whom previous protease inhibitor therapy had failed. Ann Intern Med 131(11):813-821 Robbins G K, Daniels B, Zheng H et al. (1999) Predictors of antiretroviral treatment failure in an urban HIV clinic. Journal of Acquired Immune Deficiency Syndromes 44(1):30 Wang D, Larder B. (2003) Enhanced prediction of lopinavir resistance from genotype by use of artificial neural networks. J Infect Dis 188(5):653-660 Vermeiren, H., Van Craenenbroeck, E., Alen, P., et al. (2007) Prediction of HIV-1 drug susceptibility phenotype from the viral genotype using linear regression modeling. J Virol Methods 145(1):47-55 Prosperi M C F, Altmann A, Rosen-Zvi M et al. (2009) Investigation of expert rule bases, logistic regression, and non-linear machine learning techniques for predicting response to antiretroviral treatment. Antivir Ther 14:433-442 Van Der Borght K, Verheyen A, Feyaerts M et al. (2013) Quantitative prediction of integrase inhibitor resistance from genotype through consensus linear regression modeling.Virology journal 10(8):1-12 Draghici S, Potter R B. (2003) Predicting HIV drug resistance with neural networks. Bioinformatics 19(1):98-107 Beerenwinkel N, Däumer M, Oette M et al. (2003) Geno2pheno: Estimating phenotypic drug resistance from HIV-1 genotypes. Nucleic Acids Res 31:3850-3855 Johnson V A, Calvez V, Günthard H F et al. (2011) 2011 update of the drug resistance mutations in HIV-1. Top Antivir Med 19(4):156-164 Eisenberg D, Weiss R M, Terwilliger T C. (1984) The hydrophobic moment detects periodicity in protein hydrophobicity (protein structure/a helix/, sheet/31, helix/secondary structure). Proc. Nadl. Acad. Sci. USA 81:140-144 Efron B. (1979) Bootstrap methods: another look at the jackknife. The annals of Statistics 1-26 Akaike H. (1974) A new look at the statistical model identification”, IEEE Trans. Automatic Control AC-19:716-723 Zweig M H, Campbell G. (1993) Receiver-operating characteristic (ROC) plots: a fundamental evaluation tool in clinical medicine. Clin Chem 39(4):561-577 Landis J R, Koch G G. (1977) The measurement of observer agreement for categorical data. Biometrics 33(1):159-174
IFMBE Proceedings Vol. 41