component analysis (KPCA); drift compensation; e-nose. I. INTRODUCTION. An electronic nose (e-nose) is a common sensing system, which consists of gas ...
2015 12th International Conference on Fuzzy Systems and Knowledge Discovery (FSKD)
Long-term Drift Compensation Algorithms Based on the Kernel-Orthogonal Signal Correction in Electronic Nose Systems Hang Liu, Renzhi Chu, Jian Ran, Jinhui Xia School of Electronic Science and Technology Dalian University of Technology Dalian, China 116023 Abstract—In order to compensate the drift of the performance of gas sensors in recognition, the kernel-orthogonal signal correction algorithm (K-OSC) is proposed. In the K-OSC, the feature space is mapped into a higher dimension space by using the kernel principal component analysis (KPCA) at first. Then the orthogonal signal correction (OSC) is used to remove undesired components which do not correlate to the label from the feature vector. The feature vector processed by the K-OSC can improve the accuracy of pattern recognition tools, such as support vector machines (SVMs) or deep neural networks. The experimental results of K-OSC demonstrate that the K-OSC has a better performance than other methods considered over a longer interval time between training samples and test samples. Keywords—orthgonal signal correction (OSC); kernel principal component analysis (KPCA); drift compensation; e-nose
I. I NTRODUCTION An electronic nose (e-nose) is a common sensing system, which consists of gas sensors array, gas delivery channels and the supporting software for measurements. As time goes by, the sensor aging and changes in measuring environment result in the drift of sensors. The fluctuation generated by the pattern response with increasing time is called long-term drift [1]. The long-term drift leading to the decline of the gas recognition accuracy, thereby reducing the reliability and life of the sensors, is one of the important issues. All potential avenues, including algorithms, sensor structures and novel materials should be considered to compensate for the drift of e-nose. The common algorithms of compensating the drift include the signal processing and the pattern recognition methods. Both the two types of algorithms are not alternative and antagonistic, but rather these methods are complementary and mutually supportive. In general, the application of gas recognition must recognize gas under the affect of the drift [2]. The excellent pattern recognition methods can improve the accuracy and stability in gas recognition. Common pattern recognition methods include the artificial neural network (ANN), the support vector machine (SVM) and other excellent methods. Hinton proposed a fast learning algorithm for deep belief nets (DBNs) [3]. Lee proposed a multi-layer neural network based on an error backpropagation learning algorithm to recognize gas [4]. Polikar maximized performance of a neural network classifier by using the hill-climb search algorithm [5]. Some researchers used
978-1-4673-7682-2/15/$31.00 ©2015 IEEE
the SVM as a classifier for recognition in the e-nose gas recognition. In addition to recognition methods, the long-term drift can be compensated by signal processing methods. The signal processing methods are based on two types of approaches: univariate or multivariate, and linear or non-linear. The univariate methods comprise the frequency analysis, the baseline manipulation and differential measurements [6]. Each group of these methods is independent in the sensor drift compensation. The univariate methods are simple and can partially compensate the sensor drift but susceptible to change with the sampling rate. The multivariate methods utilize all of the sensor responses. The signal correction method, which is one of the multivariate methods [7], can remove the irrelevant information to compensate the drift [8]. This paper focuses on signal processing methods for the metal oxide gas sensor array. The main purpose is to separate the drift from real responses. The procedure enhances the posterior classification and regression tasks. Linear methods such as the common principal component analysis (CPCA) [9], the partial least squares (PLS), the orthogonal signal correction (OSC) [10], the component correction (CC) based on the PCA [11] and the canonical correlation analysis (CCA) [12] have been proposed to provide a good performance and the CC has draw much attention. However, the CC method assumes that drift present in the same way in all measurements and the condition is not always met. As a signal correction method, the OSC has been proven to be an effective component correction method [10]. Let X is an independent variable response matrix in the sensor array. Then X is a n × m matrix, where n is the number of measurements and m is the length of the feature vector. Let Y is the dependent variable matrix of the species of analytes. Then Y is a n × 1 matrix. According to the principle of the OSC, X includes the output response required and the signal of drift. The information of analyte species is not relevant with the interference and the signal drift, so that the component of the interference and drift is orthogonal with the matrix Y . It is possible to obtain and remove the irrelevant information by using the OSC method, thereby reducing the influence of a long-term drift in response to the signal of the sensor array. The OSC algorithm requires the PCA to reduce dimension
1583
of data. The PCA is linear that provides the assumptions on the linear relationships among variables and the KPCA is a non-linear extension of the correspondence PCA [13]. Both of PCA and KPCA work for the same mission that extract the most principal components from original data. The KPCA is affected by the option of the kernel. KPCA nonlinearly maps the feature space to a higher dimensional space using kernel functions to efficiently acquire principal components. Based on the KPCA and the OSC, the kernel-orthogonal signal correction (K-OSC) is proposed as a long-term drift compensation signal correction method that can effectively improve pattern recognition tools. In the remainder of this paper, we first introduce the principle of related algorithms including the OSC and the KPCA in the section 2. Next, the K-OSC algorithm is proposed in the section 3 and the experimental results are presented and compared with other algorithms in the section 4. Finally the conclusions drawn from the results presented in this paper are discussed in the section 5.
the PCA will get a n × n non-sparse matrix. As a linear mapping method, the PCA obtains linear mapping components that do not contain information of data higher than the second order, so features extracted are not the best, which will reduce the accuracy. As an extension of nonlinear algorithm for the linear PCA, the KPCA extracts principal components through nonlinear functions: mapping data through nonlinear functions to realize the PCA in the feature space. Compared with the PCA, the KPCA is better to solve nonlinear features problems and offers more features than the PCA. The number of features and samples are equal in the KPCA while the number of PCA features is only equal to input dimension of sample, so the KPCA offers more features than PCA and extracts more sample information [13]. Let xi ∈ RN , x1 , x2 , · · · , xl is a training data set. The KPCA maps data from the input space RN to the feature space F by a nonlinear function ϕ : RN → F , x → X. The KPCA uses the PCA in the feature space F to solve the problem of features:
II. RELATED ALGORITHMS
λi ui = Cui , i = 1, 2, · · ·, l
A. Orthogonal Signal Correction (OSC) Since Wold et al. proposed the OSC in 1998 [7], several related OSC algorithms have appeared [14][15]. The OSC method can get orthogonal components by using an internal iteration of time. It needs 5 − 20 iterations but often converges rapidly. It does not provide a only answer but depends on the starting vector t. So that the OSC uses the PCA to get the starting vector because the PCA gives the most appropriate score vector t which can be predicted by the matrix X. Both of the standards above are met. During the OSC standards the criterion of the OSC component will decrease for converging. This paper uses the Wolds OSC algorithm to preprocess data as follows. a) Center and scale the original data to provide the raw matrices X and Y ; b) Compute the first principal component t0 of X by PCA; c) Orthogonalize t0 to Y : tnew = (I − Y (Y T Y )−1 Y T )t0 ; d) Compute the PLS weight vector w, which satisfies Xw = tnew ; e) Compute a new score vector t0 from X and w: t0 = Xw; f) Repeat c∼e steps until t0 has converged; g) Compute a loading vector p0 : p0 = (X T t0 )/(tT 0 t0 ); h) Deduct the correction from X to obtain the corrected data XOSC : XOSC = X − t0 pT o; B. Kernel Principal Component Analysis (KPCA) The PCA is a common signal processing for the feature extraction and the dimensionality reduction method in the pattern recognition. But the PCA needs large storage space and computation. Assuming the dimension of data as the n,
l ∑
where C =
(1)
ϕ(xi )ϕ(xi )T /l is the covariance matrix
i=1
in the feature space, λi is a non-zero feature, ui is the corresponding feature vector of λi . Equation (1) can be changed into the following features problem: λir αi = Kαi , i = 1, 2, · · ·, l
(2)
where K = (kij )l×l is the kernel matrix, kij = ⟨ϕ(xi ), ϕ(xj )⟩,λir is a non-zero eigenvalue of K, and αi is the corresponding feature vector of λir . Function (1) and (2) have the following relationship: λir = lλi ui =
l ∑
αi (j)ϕ(xj )
(3)
j=1
To ensure the feature vector ui is a unit vector, √ set the corresponding αi standardized through αi = αir / λir and reconstructed by the following equation: st (i) = uT i ϕ(xt ) =
l ∑
αir (j)K(xj , xt ), i = 1, 2, · · ·, l
(4)
j=1
III. KERNEL ORTHOGONAL SIGNAL CORRECTION (K-OSC) The K-OSC is proposed based on the OSC and the KPCA. In b-f steps of OSC, the first principal component is calculated from the PCA of X to get an initial score vector. During each iteration step, the initial vector t0 is orthogonal to Y , but tnew is not a linear combination of X.The KPCA maps the original data from the input space to the feature space to realize the PCA in the feature space. Thus the KPCA is used
1584
TABLE I SAMPLES OF EACH BATCH Batch ID 1 2 3 4 5 6 7 8 9 10
Ammo 83 100 216 12 20 110 360 40 100 600
Acetal 30 109 240 30 46 29 770 33 75 600
Acet 70 532 275 12 63 606 630 143 78 600
GAS Ethy 98 344 490 43 40 574 662 30 55 600
Etha 90 170 365 64 28 514 649 30 61 600
Tolu 74 5 0 0 0 467 568 18 101 600
Total 445 710 1763 161 197 2300 3613 294 470 3600
100
Accuracy
80 60 40 20 0 2
KOSC−SVM KOSC−DBN DBN RBF−SVM 3
4
5
6 Batch
7
8
9
10
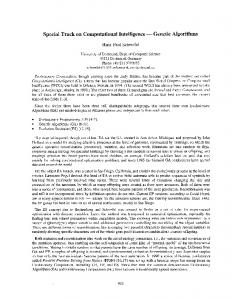
Fig. 1. Recognition accuracy. The previous batch is used as a training dataset, and the next batch as a test dataset. The KOSC-SVM and the KOSC-DBN represent the SVM and the DBN with the K-OSC, and the RBF-SVM and the DBN represent the SVM and the DBN without the K-OSC.
to recalculate t0 , which is the linear combination of X and orthogonal to Y , so t0 contains only the required information. The steps of the K-OSC as follows: a) Center and scale the data to provide the raw matrices X and Y ; b) Input data: S = {x1 , x2 , · · ·, xl }; c) Calculate the kernel matrix: K = (kij )l×l , where kij =K(xi , xj ); d) Center the kernel matrix; e) Calculate the features and features of kernel matrix; f) Standardized feature vector: √ αi =αir / λir ; g) Reconstruct of data: l ∑ st (i)= αir (j)K(xj , xt ); j=1
h) Get the transformed data set Sr = {s1 , s2 , · · ·, sl }; i) Correct reconstruction data X by OSC; IV. EXPERIMENT RESULT The data used in the experiments was collected by UCI [1]. The authors used 16 metal oxide gas sensors (TGS2600, TGS2602, TGS2610 and TGS2620, each type have four sensors). These sensors were manufactured by Figaro Inc. The original dataset of measurement consist of 13910 recordings
of the 16-sensor array. The dataset include six distinct pure gas(ammonia, acetaldehyde, acetone, ethylene, ethanol and toluene). The concentration of each gas ranged from 5 to 1000 ppmv. Authors extracted the response of the e-nose into a 128-dimensional feature vector. The feature vector was used as a combination of eight features defined by each of the 16 sensors. The results were collected for 36 months; for more information about this dataset, refer to [1]. The measurements were merged into 10 datasets to ensure the number of dataset was as uniformly distributed as possible. These measurements were numbered in chronological order as 1, 2, · · · , 10, as shown in TABLE I. The larger index of the dataset demonstrate that the data was collected later. Note that 5 months separate the collection of the batch 9 and 10. This gap is highly important for this study. There are two reasons: (1) This gap enables us to validate our proposed method. We used an annotated set of dataset which were collected after five-month; and (2) during this five-month period,the sensors were contaminated severely for the reason that external interferes attached to the sensing layer easily and irreversibly, and the environmental temperature of the e-nose was below the operating temperature. In this paper, two experiments are designed to evaluate the performance of the K-OSC. The SVM and the deep belief network (DBN) are chosen as classifiers to classify the feature vectors after implement of the K-OSC. A. Experiment 1 In this experiment, we compared the performance of pattern recognition tools with and without the K-OSC. At first, the previous batch is used as a training dataset, and the next batch as a test dataset. The training dataset is processed with the K-OSC to get the load vector and score vector, then the correction of the training dataset is used to train the classifiers. During the test procedure, the test dataset is corrected with the load vector and score vector of the OSC. The corrected data are identified by the SVM and DBN. The experimental results are shown in the Fig. 1. For the most of test datasets, a classifier with the K-OSC outperforms that without the K-OSC. According to the experiment set, the time gap between the training and test dataset is so small that the performances improve slightly. Then, the first batch is used as a training dataset, and the following nine batches as test datasets. The experimental results are shown in the Fig. 2. The accuracy of data preprocessed by the K-OSC is superior to that of other non-preprocessed especially on the fifth to the eighth batches. This illustrates that the K-OSC can significantly improve the accuracy of the classifiers and compensate for the long-term drift. B. Experiment 2 In this experiment, the performances of pattern recognition tools with the K-OSC are compared with other methods, such as the RBF-ELM of the RBF kernel [16], the ELM
1585
100
Accuracy
80 60 KOSC−SVM
40
COMGFK−M L RBF−ELM
20
KOSC−DBN 0 2
4
6 Batch
8
10
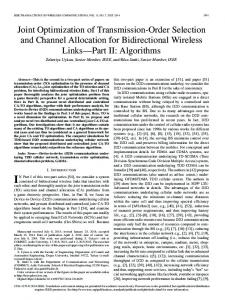
Fig. 3. Recognition accuracy. The previous batch is used as a training dataset, and the next batch as a test dataset. 100
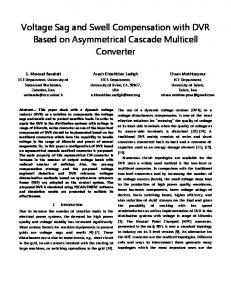
At first, the previous batch is used as a training dataset, and the next batch as a test dataset. The experimental results are shown in the Fig. 3. The COMGFK-ML has a best performance, while the K-OSC is slightly lower than the COMGFK-ML. Because the shorter time gap between training samples and testing samples, the less long-term drift cumulative, so that the K-OSC algorithm does not reflect enough advantages. Then, the first batch is used as a training dataset, and the following nine batches as test datasets. The experimental results are shown in the Fig. 4. It illustrates that only the accuracy of the K-OSC in the fourth batch is lower clearly than the best result, and accuracy of the K-OSC for other batches is the best or close to the highest accuracy. The result demonstrates that the K-OSC for long time interval of the training and test set is better, in other words, the K-OSC has a better performance in the compensation to long-term drift. V. CONCLUSION
Accuracy
80 60 KOSC−SVM COMGFK−M L DAELM−T(0) RBF−ELM KOSC−DBN
40 20 0 2
4
6 Batch
8
10
Fig. 4. Recognition accuracy. The first batch is used as a training dataset, and the following nine batches as test datasets.
100
Accuracy
R EFERENCES
60 40 20 0 2
3
4
5
6 Batch
7
8
9
ACKNOWLEDGMENT This work is supported by the National Natural Science Foundation of China (No. 61131004), and in part by the Fundamental Research Funds for the Central Universities (No. DUT14RC(4)03).
KOSC−SVM KOSC−DBN DBN RBF−SVM
80
In order to compensate the long-term drift, this paper proposed the K-OSC based on the KPCA and the OSC. The K-OSC can extract nonlinear information by the KPCA and subtract drift information by the OSC to compensate longterm drift. The data are disclosed in the UCI and this paper designs two experiments to verify the performance of the KOSC. The feature vector processed by the K-OSC can improve the accuracy of pattern recognition tools, such as SVM and DBN. The experimental results show that the K-OSC has a better performance the other methods considered over a longer interval time between training samples and test samples.
10
Fig. 2. Recognition accuracy. The first batch is used as a training dataset, and the following nine batches as test datasets. The KOSC-SVM and the KOSCDBN represent the SVM and the DBN with the K-OSC, and the RBF-SVM and the DBN represent the SVM and the DBN without the K-OSC.
DAELM-T (0) based on the ELM [17] and the COMGFK-ML that is a semi-supervised method of manifold regularization with a combination of kernel [8]. All of the methods in the experiment use the same training and test datasets.
[1] A. Vergara, S. Vembu, T. Ayhan, M. A. Ryan, M. L. Homer, and R. Huerta, “Chemical gas sensor drift compensation using classifier ensembles,” Sensors and Actuators B: Chemical, vol. 166-167, no. 0, pp. 320–329, 2012. [2] C. Distante, N. Ancona, and P. Siciliano, “Support vector machines for olfactory signals recognition,” Sensors and Actuators B: Chemical, vol. 88, no. 1, pp. 30–39, 2003. [3] G. Hinton, “A fast learning algorithm for deep belief nets,” Neural Computation, vol. 18, no. 7, pp. 1527 – 1554, 2006. [4] D.-S. Lee, H.-Y. Jung, J.-W. Lim, M. Lee, S.-W. Ban, J.-S. Huh, and D.-D. Lee, “Explosive gas recognition system using thick film sensor array and neural network,” Sensors and Actuators B: Chemical, vol. 71, no. 1C2, pp. 90–98, 2000. [5] R. Polikar, R. Shinar, L. Udpa, and M. D. Porter, “Artificial intelligence methods for selection of an optimized sensor array for identification of volatile organic compounds,” Sensors and Actuators B: Chemical, vol. 80, no. 3, pp. 243–254, 2001. [6] E. L. Hines, E. Lobet, and J. W. Gardner, “Electronic noses: a review of signal processing techniques,” Circuits, Devices and Systems, IEE Proceedings, vol. 146, no. 6, pp. 297–310, 1999. [7] S. Wold, H. Antti, and F. Lindgren, “Orthogonal signal correction of near-infrared spectra,” Chemometrics and Intelligent Laboratory Systems, vol. 44, no. 1-2, pp. 175–185, 1998.
1586
[8] Q. Liu, X. Li, M. Ye, S. S. Ge, and X. Du, “Drift compensation for electronic nose by semi-supervised domain adaption,” Sensors Journal, IEEE, vol. 14, no. 3, pp. 657–665, March 2014. [9] A. Ziyatdinov, S. Marco, A. Chaudry, K. Persaud, P. Caminal, and A. Perera, “Drift compensation of gas sensor array data by common principal component analysis,” Sensors and Actuators B: Chemical, vol. 146, no. 2, pp. 460–465, 2010. [10] M. Padilla, A. Perera, I. Montoliu, A. Chaudry, K. Persaud, and S. Marco, “Drift compensation of gas sensor array data by orthogonal signal correction,” Chemometrics and Intelligent Laboratory Systems, vol. 100, no. 1, pp. 28–35, 2010. [11] T. Artursson, “Drift correction for gas sensors using multivariate methods,” Journal of Chemometrics, vol. 14, no. 5-6, pp. 711–724, 2000. [12] R. Gutierrez-Osuna, “Drift reduction for metal-oxide sensor arrays using canonical correlation regression and partial least squares,” in Proceed-
[13] [14] [15] [16] [17]
1587
ings of the 7th International Symposium On Olfaction & Electronic Nose, 2000, pp. 1–7. B. Sch¨olkopf, A. Smola, and K.-R. M¨uller, “Nonlinear component analysis as a kernel eigenvalue problem,” Neural computation, vol. 10, no. 5, pp. 1299–1319, 1998. C. A. Andersson, “Direct orthogonalization,” Chemometrics and Intelligent Laboratory Systems, vol. 47, no. 1, pp. 51–63, 1999. T. Fearn, “On orthogonal signal correction,” Nir News, vol. 50, no. 99, p. 47C52, 2000. D. A. P. Daniel, K. Thangavel, R. Manavalan, and R. S. C. Boss, ELMBased Ensemble Classifier for Gas Sensor Array Drift Dataset. Springer India, 2014. L. Zhang and D. Zhang, “Domain adaptation extreme learning machines for drift compensation in e-nose systems,” IEEE Transactions on Instrumentation and Measurement, vol. 64, pp. 1790–1801, 2014.