Various 3-layered feed-forward networks were trained using the Quasi Newton. Backpropagation algorithm with 2,500 traini
paper ID: A027 /p.1
Loudness Model using Artificial Neural Networks V. Espinozaa, R. Venegasb ,S. Floodyc. a
b
Universidad Tecnológica de Chile, Brown Norte 290, Santiago, Chile,
[email protected] Universidad Tecnológica de Chile, Brown Norte 290, Santiago, Chile,
[email protected] c Universidad Tecnológica de Chile, Brown Norte 290, Santiago, Chile,
[email protected] English Translation by A. Osses.
ABSTRACT: This article presents a simple loudness model, starting from the standardised equal loudness contours, ISO 226:2003. The followed strategy was to use a feed-forward artificial neural network multilayer 119-1 for determining the values of the equal loudness contours for different frequencies and sound pressure levels of a time-variant signal, i.e., to weight each SPL and each frequency with their respective isophonic curve. The model is compared with other loudness estimators such as dB(A) and RMS values using voiced signals recorded in an anechoic environment. KEYWORDS: Loudness, Artificial Neural Networks , Equal-loudness Contours.
paper ID: A027 /p.2
1. INTRODUCTION It is known the response of the human ear at different levels and frequencies, in the so-called isophonic curves [3]. These curves are conceived for pure tones and normal incidence of the sound toward the observer, who perceives the same loudness sensation or “intensity” for a sound having a different frequency. The unit to measure of the loudness level is the Phon. Commonly, for measuring or estimating the loudness for different audio applications, are used methods such as the use of RMS values, the weighting curves A, B or C and different integration times, related to the human hearing. The problem comes up when comparing different indicators with the listener perception. Moreover, these methods are static because they don’t adapt their response when varying either the level, the frequency or length of the signal. Our proposal is a dynamic weighting model, i.e., the weighting process depending on the frequency spectra of a determined signal.
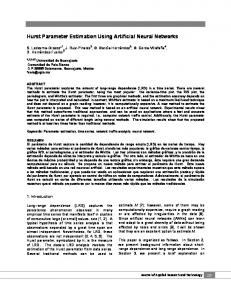
2. METHODS 2.1 Determination of the training set for the Artificial Neural Network The first problem stated is that the isophonic curves (or equal-loudness contours) [3] [4] are published as 10-Phones stepped curves, as shown in Figure 1. Any other value or curve must be approximated or interpolated using a determined method. For considering a real time application of the equal loudness contours, it will be determined those values by using an Artificial Neural Network (ANN).
paper ID: A027 /p.3
Figure 1: Isophonic curves according to [4] The procedure was the following: By means of image signal processing, each equal loudness contour was split and then obtained the SPL in dB and the frequency for each pixel belonging to the curves. Each curve was labelled with its corresponding Phon value. Both the SPL and the frequency data were imported into the Curve Fitting Toolbox in MATLAB® [5], where they were smoothed by means of a method called Loess, suppressing the noise introduced when scanning the original image. The smoothed data was used as input of the Smoothing Splines approximation method (SS), determining a polynomial able to describe in an approximately way each equal loudness contour in the range from 20 Hz to 12.5 kHz. An example of the curves generated by the obtained polynomials is shown in Figure 2.
paper ID: A027 /p.4
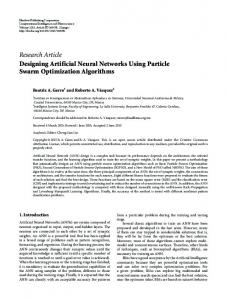
Figure 2: Isophonic curves generated by the Splines apprximation from 0 up to 80 Phon. Using these polynomials, It was created the input data set for the training of the artificial neural network. 2.2 Implementation and test of the Artificial Neural Network (ANN). In simple terms, an ANN is a network of functions that emulates the basic characteristics of a biological neurone, which has the capability to “learn” a determined behaviour, as a result of the presentation of some data series to respond, later, in an autonomous way when similar data is introduced to the network. Further information about the theory besides the Artificial Neural Networks can be found in [1] [2]. Various 3-layered feed-forward networks were trained using the Quasi Newton Backpropagation algorithm with 2,500 training epochs for each network, having a target error or goal of 10-5. The training data set was taken from the data provided by the approximation of the Smoothing Splines polynomials from 0 up to 80 Phons. The corresponding transfer functions are the Tangent Hyperbolic Sigmoid function, the Logarithmic Sigmoid function and the Linear function for the input, hidden and output layers respectively. The inputs to the ANN are the frequency in Hz and the sound pressure level SPL of the signal in dB. The output is the loudness level in
paper ID: A027 /p.5
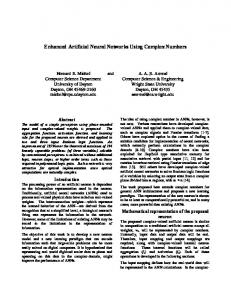
Phons. The number of output neurones is determined by the nature of each problem. In this case corresponds to 1 neurone (loudness level). For finding the input and hidden number of neurones, 175 different configurations were trained and tested, assigning randomly the number of neurones for both layers (random uniform distribution from 1 to 13 neurones for each layer). It was defined a cost function which weights the total number of neurones of the input and hidden layers respect to the possible maximum number (13+13 = 26 neurones) and the RMS value (normalised respect to the maximum value already found). The latter parameter has more importance than the number of neurones to be used for the ends of this article, therefore, It was given an importance of 0.9 for the error and 0.1 for the number of neurones. The cost function was minimised in order to obtain an optimal configuration. The results indicate that the final topology is an ANN with 11, 9 and 1 neurones for the input, hidden and output layers respectively. In Figure 3, It is shown the network output as a function of the expected values (network targets) for the optimal configuration.
Figure 3: Network output versus the targets for the optimal configuration. When the minimum error was achieved, the result of the ANN training process was stored and then implemented in a MATLAB® function: NeuLoud(frequency, SPL dB) = Phons.
paper ID: A027 /p.6
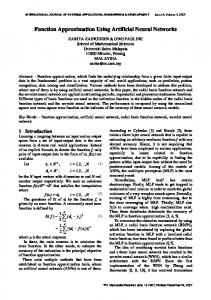
2.3 Results For testing the NeuLoud function, their results were compared with the values returned by the Smoothing Splines polynomials. The errors are presented in Figure 4 and, as it could be seen, the deviation is not greater than ±3 dB at low frequencies (< 100 Hz) and near to ±1 dB for higher frequencies.
Figure 4: NeuLoud v/s SS polynomials Error Para una comparación con distintos valores de Fones se presenta Curvas de igual contorno de NPS versus Frecuencia (figura 5), esto es, la cantidad de fones necesarios para tener un mismo NPS. Notar que aparecen curvas cada 5 dB.
paper ID: A027 /p.7
Figure 5: Equal SPL-level-contours versus frequency. For testing the ANN with audio signals, it was implemented a script in MATLAB®. First, it was needed to calibrate the SPL dB with the dB Full Scale of the digital signal. In this case -14 dBFS corresponds to 70 SPL dB. Then, the signal was transformed into frequency domain by means of a 256point FFT and using a Hanning window at a sampling frequency of 22,050 Hz, 24 bits and 0% of overlap. For avoiding to introduce data being out of the values taken by the equal loudness contours, the level data corresponding to each frequency is compared with the threshold curve (0 Phon). If the data is under the threshold, its level is reassigned to the curve threshold level. After taking these precautions, the vector of frequencies and the level of the signal (in dB) are presented to the NeuLoud function. Afterwards, the dB RMS and the A-weighted dB RMS values are compared with the sum of all the frequencies weighted using the NeuLoud function for two cases. The first case (Figure 7) is a signal of a voice recorded at an anechoic chamber without any processing and appropriately calibrated. The second case is the same signal but applying to it a spectral modification, as shown in the Figure 8. The Figure 6 shows the spectral modification.
paper ID: A027 /p.8
Figure 6: Spectrum of the test signal with and without spectral modifications
Figure 7: Envelope for the different estimations of loudness without spectral modification: dB RMS (red), dB(A) RMS (black) and NeuLoud (blue).
paper ID: A027 /p.9
Figura 8: Envelope for the different estimations of loudness with a spectral modification: dB RMS (red), dB(A) RMS (black) and NeuLoud (blue). The previous examples are bisyllabic Spanish words. These words are: kiwi, cruces, kilo, alma, fruta, dedo and suerte. It is observed in the modified signal (Figure 8), that the phonemes which contain more energy in the sensitive region of the ear, present a greater level for the ANN model. These are mainly consonants.
3. CONCLUSION It has been implemented a mathematical function which is able to calculate the loudness level for any frequency and level lying in the established ranges. The computational cost of such function is extremely low: between 10 and 14 micro seconds being, therefore, applicable to real time calculations, for implementations working with digital audio or others. Its application it could be extended to the area of noise control and environmental acoustics, using it as a complementary estimator for the A and C weighting curves.
paper ID: A027 /p.10
REFERENCES [1] Freeman, J. A., and Skapura, D. M., “Neural networks, Algorithms, Applications and Programming Techniques”, Adisson-Wesley, (1991). [2] Gupta, M., Jin, L., and Homma, N., “Static and Dynamic Neural Network”, IEEE Press, John Wiley and Sons, (2003). [3] ISO 226:2003, Acoustics - Normal equal-loudness-level contours [4] Suzuki, Y., Takeshima, H. “Equal-loudness-level contours for pure tones”, J. Acoust. Soc. Am., Vol 116, No. 2, August (2004). [5] Matlab v6.5 Release 13.