International Journal of Engineering & Technology IJET-IJENS Vol: 12 No: 02
23
Low Cost Configuration of Data Acquisition System for Wireless Sensor Network M. Rahmat 1,6, M. Azis 2, E. Rustami 2, W. Maulina 2, K.B. Seminar 3, A.S. Yuwono 4, H. Alatas 5 1)
Agricultural Engineering Science of Graduate School 2)
Biophysics Study Program of Graduate School
3)
Department of Mechanical Engineering & Biosystem 4) Department of Civil and Environmental Engineering 5) Theoretical Physics Division, Department of Physics 6) Applied Physics Division, Department of Physics Bogor Agricultural University (IPB). Bogor 16680. West Java - Indonesia. E-mail :
[email protected]
Abstract - In this study we have developed a low cost configuration wireless data acquisition system (WDAS). The low cost configuration of WDAS must be consist of low cost material or part and component, low power consumption, free charge application development using any open software that is possible and compatible with recent operation systems. We use the Arduino-based open hardware with DFRduino module, which is equipped with a LMC660-based signal conditioning for voltage follower, active low pass filter and PGA Instrumentation amplifier 204. The wireless communication system comprises IEEE 802.15.4 ZigBee platform using XBee-PRO module. The display of data can be performed in desktop and web applications using a graphical user interface (GUI) and programming language Visual Basic (VB 6.0), hypertext preprocessor (PHP), asynchronous JavaScript and XML (AJAX) and J-Query techniques. The data are stored in a database server accessible in real time in MySQL. The data can also be logged in Microsoft Excel file format. Index Terms — low-cost configuration, acquisition, wireless, realtime, microcontroller.
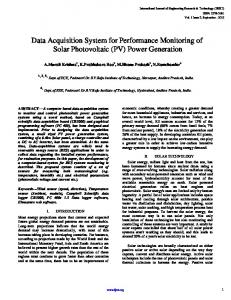
adopted [3]. Notification can be done through various media, such as the internet or short message service (SMS). In addition, information from sensors in a WSN is usually coupled with a geographic information system (GIS), so it is possible to find out where the safe point which is protected from disaster. The residents can then take that information and check the GPS to see a map of the location of areas that survive from disaster. In the field of agriculture, WSN can be applied to monitor the crop or agricultural area, such as tea plant harvesting. To harvest the tea plant, one can determine the correct leave to be plucked by looking at their color. The sensor can monitor the image of tea leaves, send it wirelessly to the central station, the image processing techniques can be determine which area of the plantation is ripe and ready to be plucked. Fig 1 shows application of WSN for precision agriculture that used to monitor growth of the plant [4]. Integrated information and production-based farming system is designed to increase long-term, site-specific and whole-farm production efficiency and productivity [5].
I. INTRODUCTION Wireless sensor network (WSN) is an equipment package system that consists of one or more automatic sensors, and communication systems. Each point of sensor in the sensor network is equipped with a radio transceiver or microcontroller and energy source (battery or solar cell) [1]. This sensor network is used to monitor the condition of the physical environment, such as: temperature, motion, sound, vibration, color changes, and others, which is usually in real time mode. In the field of disaster anticipation and prevention, the sensors can be used as an early warning system. The sensors are placed in various areas, and when the possible disaster is detected the sensors will send related data to the central station. Further process occurs at the central station data, providing an early warning of the possible catastrophe for the residents. A more natural candidate for an online monitoring framework is based on WSN technology [2]. In order to resolve the issues related to wired systems, the paradigm of WSN has recently been
Fig 1. Illustration of the use of WSN for precision agriculture monitoring [4]
The rapid development of information technology (IT) in recent years has expanded into many areas of life, including in
124402-5757 IJET-IJENS @ April 2012 IJENS
IJENS
International Journal of Engineering & Technology IJET-IJENS Vol: 12 No: 02 agriculture. The utilization of information technology in agriculture is widely used to disseminate information about fresh products and agricultural industries to be traded and it is widely used by business people in agriculture, and also to spread information about research results, and dissemination policies that of government agencies, universities, nongovernmental organizations (NGO) and business people in the farming and agricultural industry [6]. Precision agriculture is a controlled environment, a combination of agriculture, horticulture and engineering to optimize crop production, improvement, and product efficiency. Plants in a controlled environment can be maintained by environmental conditions using additional lighting, nutrition, temperature and humidity. All those parameter can be controlled using a computer [7][8][9]. Before using IT in agriculture with a controlled environment, it needs little introduction to the concepts underlying its use. The initial concept which is known as speaking plant approach (SPA) is introduced and developed since the 1980s by Japanese scientists [4]. SPA concept is based on the response of plants caused by environmental growth conditions and observed by the sensor. In this case the environmental factors are considered as input and the output response of plants. This SPA is also accepted as an important concept for the optimization of plant production processes, especially in the greenhouse, although difficult to understand the response of plants to the environment based on the complexity of the physical and physiological [8][9]. Recent sensor technology leads to the of use wireless sensor in SPA that can be connected to the internet. This is the easier and cheaper way for user to access. Wireless sensor technology is a system consisting of several components of radio frequency receivers, sensors, microcontrollers and resources. This technology can manage, work, configure, suspect and make things better and also was developed to solve problems which cannot be done using conventional method. Utilization of IT is conducted in an integrated and thoroughly covers the several sectors. Implementation in agriculture, IT can be used for a new business development in rural areas, policy making and evaluation, knowledge transfer and decision-making for agriculture, inexpensive and competitive agriculture (including the development of sales and marketing, virtual business, the small as well as transfer of technology to improve the results). For sustainability of agriculture based on food security which is include precision farming, IT can monitor the optimal pest management, growth predictions by setting the optimal fertilizer and food supply adequacy and feasibility and searches of agricultural products with good agriculture practices (GAP). Therefore, it must be emphasized that the application of IT should be used in agriculture in the broad sense, not just limited to the cultivation of the criteria (on farm agriculture) only [4][8][10]. WSN application in the fields of environment is better known as the environmental sensor network (ESN). The fundamental study ESN facility related to the process and the development of an alarm system contamination. ESN has been developed starting from a passive storage system that requires
24
the downloading of the manual, sensor networks that enable intelligent network stain combination of automatic sensor, and communication systems that can actively communicate data in a sensor network server (SNS), where data can be integrated with the other’s environmental data sets. Several sensors can be placed in fixed area or moving in mobility scale suitable for measuring environmental parameters specified. Classification of ESN function consisting large scale single function networks (LSSFN) tend to be used in a particular destination that covers a wide geographical area. The localized multifunction sensor networks used to monitor a small area in more detail for the frequent user of wireless ad-hoc system. The Biosensor Network used in biotechnology applications to monitor the environment in the development process and the intermediary system. In the future, all three sensor network system will be integrated into heterogeneous sensor networks [2][10][11]. Fig 2 shows the environmental monitoring facility as LSSFN [11].
Fig 2. Illustration of the use of WSN for weather monitoring [11]
Fig 3. Illustration of the use of WSN as body area network (BAN) in medical application [12]
Recent development of wireless and mobile technologies in the health sector has laid the foundation for a new generation of wireless smart sensor. This technology has made implementation of intelligent medical monitors that can provide real-time feedback to the patient's worth, both as a medical emergency alert or as a tool for monitoring during exercise. Intelligent medical monitors can significantly
124402-5757 IJET-IJENS @ April 2012 IJENS
IJENS
International Journal of Engineering & Technology IJET-IJENS Vol: 12 No: 02 decrease the number of hospitalizations and visits nursing by acting as a watchdog to warn users of personal medical emergency response service or contact a medical specialty as shown in Fig 3 [12]. Wearable health monitoring systems allow an individual to closely monitor changes in her or his vital signs and provide feedback to help maintain an optimal health status [13]. The first step involves a monitoring equipment connection to the hospital information system (HIS) and to support data acquisition and archiving. With wider acceptance of the internet, HIS is connected to the Internet, paving the way for health tele-medical applications. This step allows accessing personal medical record (PMR) and storing in remote telemedical server. Mobility of the patients in hospital became possible with the introduction of wireless local area network (WLAN) connectivity between patient monitors and static gateways to HIS. However, in such systems, individual sensor is wired to monitor the personal use of a body area network (BAN). A wearable health monitoring device using a BAN can be integrated into the user's clothing. This organization system, however, is not suitable for long, continuous monitoring, especially during normal activities, such as intensive training or computer-assisted rehabilitation. On a larger scale, wireless wide area network (WAN) connectivity allows the monitoring of patients outside the hospital using satellite and cell phone link [12]. Low cost IT is the IT that can reach most people and provide benefits for them. In agriculture, low cost information system must be capable of covering a wide area reaching farmers in the villages [14]. Therefore, a distributed instrumentation required to submit the results of this monitoring. Technological developments currently allow the use of applications to deliver an informative data at a low cost, fast, and easily accessible. The database is displayed on a web server to be distributed to the public through internet network. Measurement data should be packaged in the form of informative data, so that ordinary people can use it [11][12][15][16]. Current low-end sensors employ low cost reduced instruction set computer (RISC) microcontrollers with a small program and data memory size (about 100 kb). An external flash memory with large access times may be added to provide secondary storage and to alleviate the application size constraints imposed by the onchip memory. Common on-board I/O buses and devices include serial lines such as the universal asynchronous receiver-transmitter (UART), analog to digital converters and timers [17]. Many techniques have been developed to perform data acquisition and wireless communication like general pocket radio system (GPRS)/global system for communication mobile (GSM), radio frequency (RF), and wireless fidelity (WiFi) [18][19][20]. Every technique has own advantages and disadvantages. The advantages of GSM are wide covered area and large number of users. But for some applications that require data transmission in real time and simultaneously, GSM will become high cost technique because there will be more data to be processed. This means more costs to the GSM provider for any data transmission process.
25
In this paper we report our recent attempt to design a low cost configuration WDAS using DFRduino microcontroller module. DFRduino is a microcontroller based on Arduino hardware that cheaper than Arduino standard module. In wireless data communication we use XbeePRO module that operate based on ZigBee platform. The advantageous of XbeePRO are no configuration needed for out of the box RF communication, common XBee footprint for a variety of RF modules, fast 250 kbps RF data rate to the end node, 2.4 GHz has been spread around the world, sleep mode supported for extended battery life, and low price. This communication protocol is widely used in diverse technical environments, so there is a wide range of adaptors of small size, low cost and high performance on the market [21]. Here, we did not only develop software and application using open software whatever possible but also it must be compatible with recent operating system. II. SCOPE AND LIMITATION In this study, we built WDAS using open source and open hardware platform based on Arduino platform. Data acquisition system was performed using standard module DFRduino, while data communication using X-Bee Pro and some self-built modules. We tested our WDAS using dummy sensors to ensure data communication performance. In this case, we use three stations which are having five sensors in each station.
Fig 4. Flowchart of data acquisition system and transmitter block
124402-5757 IJET-IJENS @ April 2012 IJENS
IJENS
International Journal of Engineering & Technology IJET-IJENS Vol: 12 No: 02
Fig 5. Flowchart of data receive and display.
III. METHODOLOGY To build an inexpensive system, we must take into consideration the use of open hardware and open software. But it all depends on the capabilities and objectives of the system are built. Based on that reason, the data acquisition system is built with open hardware and several types of open software. In the development of wireless data acquisition system, we use the Arduino platform. Fig 4 and 5 shows WDAS development process flow and test phases. The system was developed in several stages from the development of hardware data acquisition system, transmitter block, receiver block, software development for desktop application and web application. Each stage is tested to ensure the next stage can proceed. Arduino is an open hardware microcontroller board. Arduino hardware is programmed by using the wiring language, similar to the C language that has been simplified and modified. Arduino comes in several models, Diecimila, Due, Duemilanove, Fio, Leonardo, Lilypad, Mega1280, Mega2560, Nano, Uno and among others. Because the design of Arduino hardware and software are open-source, then other manufacturers are free to copy it. Some derivatives of the Arduino, such as are Freeduino, Cosmo Black Star, Freeduino MaxSerial, Zigduino, Seeduino, and DFRobot.
26
The use of Arduino hardware has several advantages. First, it does not take the chip programmer because it has no boot loader that will handle the uploading of computer programs. Second, it has a USB communication facility, making it easier for laptop users who do not have serial/RS232 port. Third, it uses the programming language is relatively easy because the Arduino software is equipped with a set of libraries ready to use and quite complete. Fourth, it has a module (shield) that can be plugged in ready to use the Arduino board. For example, I/O Expansion shield, shield ethernet, relays shield, shield GPS, SD Card shield, and so forth. In this development we use DFRduino module. DFRduino is a microcontroller board designed with the original artificial DFRobot Arduino platform (http://www.dfrobot.com) that features almost 100% the same as the Arduino made in Italy. We use DFRduino Mega 1280 and I/O Expansion Shield. The chip is the ATmega1280 microcontroller which consists of 54 pin digital input / output (which is 14 of which can be used as PWM outputs), 16 analog inputs, 4 UARTs (hardware serial ports), 16 MHz oscillator, a USB port, power connector, the reset, 128 Kbyte flash memory. Fig 6 shows Microcontroller module and I/O Expansion Shield for DFRduino Mega 1280. As for the communication of data, we use the standard ZigBee platform. ZigBee protocol is a wireless networking protocol which is intended for automation and wireless applications. ZigBee protocol is expected to provide a low cost and low power (low data rate) so that even if only supplied with the usual battery is able to turn on, check, send the data on and off in less than 30 ms. It has a 2.4 GHz operating frequency. Xbee-Pro is a communication module that we use (See Fig 7). Xbee is a module designed to meet the standard ZigBee/IEEE 802.15.4. This module is used for sensor network applications at low cost and low power. ZigBee has 3 network topology models are a star topology, mesh (peer to peer) using grid [22] and cluster tree. While in this development, we use a star topology.
Fig 6. Microcontroller module of DFRduino Mega 1280 and I/O Expansion Shield (http://www.dfrobot.com)
Fig 7. XBee Pro module for wireless communication (http://www.dfrobot.com)
124402-5757 IJET-IJENS @ April 2012 IJENS
IJENS
International Journal of Engineering & Technology IJET-IJENS Vol: 12 No: 02
Fig 8. Block diagram of data communication in Xbee Pro (http://www.dfrobot.com)
27
case, we use LMC660 op amp. Low pass active filter consists of two parts; part is a simple structure of the RC low pass circuit and followed by a buffer circuit that functions to deal with high impedance input. Sallen and Key circuit is used as a active low pass filter with a series resistor and capacitor in the input, which has advantages in interference filter. In this case IC op-amp LMC660 with cut-off frequency of 1 Hz is used. Instrumentation amplifier (IA) has two inputs and one output. The main function of IA is to produce output that is proportional to the voltage difference between the two inputs. In this case, we used the PGA204, as it has many advantages among low-cost, multipurpose, programmable gain, low offset, high impedance, and others. Fig 10 shows signal conditioning block schematic. Analog data from signal conditioning circuit is converted into digital data using analog to digital converter (ADC) that is integrated in the microcontroller. This data was processed by DFRduino module and transmitted wirelessly by the Xbee transmitter and received by Xbee PRO receiver to be stored in the database server. Flowchart interfacing of these devices is shown in Fig 11. The process of data storage and user interface display was created by using Visual Basic programming. Test was performed on each block of data systems. When data is entered, then immediately recorded and stored on a database in MySQL. Data-Grid component in VB will display the data recorded on the database through a connection ADODC. The data can also log in Microsoft Excel format. The log data is then displayed in a web browser by a website monitoring is built using PHP (Hypertext Pre-processor) and JQuery techniques. Meanwhile, to display graphs in real time used free fusion chart combined with PHP and AJAX (Asynchronous JavaScript and XML).
Fig 9. Configuration Xbee Pro using X-CTU Software (http://www.embedded.arch.ethz.ch/xbee-setup.pdf)
Data received by the Xbee module via the DI pin (pin 3) in the form of an asynchronous serial signal. Signal should be at high idle when no data is transmitted. Each data byte consists of one start bit (low), 8 data bits (the LSB first), and one stop bit (high). Fig 8 shows the internal data flow diagram with a five-pin of the most frequently used. Xbee have two modes of operation in its configuration, that transparent mode (AT) and packet mode (API). To configure Xbee network, we used special software provided by the manufacturer Xbee (Maxstream / Digi) the X-CTU. So that two or more Xbee can communicate with each other, then the Xbee should have the same channel (CH), the same ID (PAN ID), and must match between source ID of the Xbee receiver and destination ID of the Xbee transmitter. Configuration must be implemented in the X-CTU software as shown in Fig 9. Signal conditioning block was conducted using voltage follower circuit, active low pass filter and instrumentation amplifier. Voltage follower circuit used to convert the high impedance of the input to output with lower impedance. These characteristics are used to secure the performance of the interface between the sensor signal processing devices. In the
Fig 10. Signal conditioning circuit schematic
Fig 11. The flow chart in the interface of two devices (http://www.digi.com)
124402-5757 IJET-IJENS @ April 2012 IJENS
IJENS
International Journal of Engineering & Technology IJET-IJENS Vol: 12 No: 02
Fig. 12. Ilustration of wireless data capture from 5 sensors [23].
28
The last part of the signal conditioning circuit is instrumentation amplifier. The selection is based on the PGA204 IC possessed miraculous advantages, including high impedance input, ideal common mode rejection ratio (CMRR), and reinforcement that can be controlled. Output signal from the sensor into the input on the V- and V+ is given a fixed voltage value. Performance test dummy sensor in real time to observe changes in the sensor environment from time to time, with the aim that the sensor can be used for continuous monitoring of environmental conditions based on the observation time. Fig 13 shows devices of wireless data acquisition system after packaging for transmitter and receiver. Fig 14 shows how to operate WDAS in desktop application mode. WDAS transmitter has five dummy sensors that could be operated simultaneously. Measurement data from the sensors are transferred to the receiver wirelessly. The receiver that connected to PC using USB port will receive the data. The measurement results are shown on the desktop application display.
Fig 13. Devices of wireless data acquisition system for transmitter and receiver
Retrieval of data simultaneously performed using five sensors, as shown in Figure 12. Performance test was carried out using a wireless communication system through desktop user application. If it has been deemed sufficient, then the data will be stored in a database and can be directly accessed through the internet application. In web applications, data can be accessed per unit sensor, can also be accessed in full 5 sensors simultaneously. Furthermore, the stored data can be accessed and downloaded as needed by a certain time period. The data can be stored in the form of a portable document format (pdf) file or Microsoft Excel file format. Desktop application is used as a means of testing to see performance data communication systems. IV. RESULTS AND DISCUSSION Instrumentation devices have been designed to transform the resistance value of dummy sensor into voltage. These dummy sensors are chosen to anticipate the actual sensor, since the signal in the form of voltage is more easily processed in a digital circuit system. There is an additional signal conditioning circuits in the block, the voltage follower. This circuit is used to generate high impedance. Therefore, the condition does not impose on the input output. Op-amp LMC660 is used to generate sufficient voltage follower with negative feedback directly. The next circuit is active low pass filter with a LMC660 opamp as the core processing signal. Value of the expected cutoff frequency is 1 Hz, so that all the oscillating signal frequency is above the indicated sources of noise will be blocked and not passed on. Based on the simulations that were performed using the software Texas Instruments Filterpro output, get the value of C1 = 47 µF, C2 = 10 µF, R1 = 1.8 kΩ, and R2 = 22 kΩ.
Fig 14. Illustration of devices set up for desktop application
124402-5757 IJET-IJENS @ April 2012 IJENS
Fig 15. Display of desktop-based WDAS.
IJENS
International Journal of Engineering & Technology IJET-IJENS Vol: 12 No: 02
29
Fig 16. Display of the web-based, real time wireless data acquisition system with 5 sensors.
The next stage is the acquisition of data and storing in the database and then display it on internet based data online. It is observed that the distribution of information can be used as wide as possible by the parties concerned. Data acquisition is performed by two platform-based data acquisition and webbased desktop. Desktop-based data acquisition was developed to anticipate the weaknesses and deficiencies in the data acquisition system and also to allow for repairs and preventive measures of potential problems that may arise in a web-based data acquisition system. The sample display of the desktopbased data acquisition system is shown in Fig 15.. Further development of the appearance of web-based data via the Internet is very useful for monitoring by multi sensor observations in a WSN. The log data is then displayed in a web browser by a website monitoring is built using PHP (hypertext preprocessor) and JQuery techniques. To display graphs in real time, the system used a fusion chart free edition which is integrated with PHP and AJAX (asynchronous JavaScript and XML), as it is exemplified in Fig 16.
Tabel 1. Result of sort data (a sample display)
Fig 17. Display of selection time period to sort data from database
124402-5757 IJET-IJENS @ April 2012 IJENS
IJENS
International Journal of Engineering & Technology IJET-IJENS Vol: 12 No: 02
Fig 18. Ilustration of individual sensor curve.
30
the preview directly in the web application, or downloaded in a pdf file or Microsoft Excel file format. Table 1 shows examples data with time constraints selectable by the user (see Fig 17). To view the performance of each individual sensor on the display, we can show a graph per sensor which is shown to give special attention to the particular sensor that is considered a priority in the event or a particular case. Graphical display of individual sensor can be seen in Fig 18. All data stored in a database of observations file in MySQL. Data Grid component in VB will display the data recorded in a database through ADODC connection. The data can also be logged in Microsoft Excel file format that is shown by Fig 19. Furthermore, we developed a multi-station system. In this study, we made three stations each of which is equipped with five sensors to measure the five types of parameters in simultaneously. The purpose of this development is to ensure system compatibility to cope with multiple stations. A system is constructed to evaluate the mechanism of storing data which are coming from multiple sensors of different stations. The results are shown in Fig 20. Each station can be monitored via a page that displays data in graphical and table simultaneously. In the process of data collection, it is possible that a graph display shows visible undesired input in the form of outliers datum. This may be derived from the problematic data acquisition process. So, it needs to be provided with a stable operational amplifier, accurate data filtering to reduce the noise, and the multi-sensor data collection by using the internal ADC must consider the characteristics of the components. The system has been developed in a modular, independent sub-system. This allows more flexible interfacing with various types of instrumentation and sensor systems to support different needs and applications. For example, WDAS applications to agriculture requires monitoring of various parameters, on farm such as humidity, ambient temperature, soil moisture parameters, and other nutrients.
Fig 19. Log data in a Microsoft Excel file.
V. CONCLUSION This study has successfully developed an integrated wireless data acquisition system. This configuration allow users to access data easier. It is not only posible to handle of data by the user directly but also possible to support decision making based on artificial intelligent approach. Development of WDAS has been using low price open hardware component, low power consumption, and several open source software. This WDAS can be operated with three stations each of which is equipped with five sensors in real-time mode.
Fig 20. Display of desktop-based monitoring system for multistation WDAS
Saved data can be accessed and downloaded via the web application by selecting the desired time period. This results in
124402-5757 IJET-IJENS @ April 2012 IJENS
IJENS
International Journal of Engineering & Technology IJET-IJENS Vol: 12 No: 02 VI. FUTURE WORK Our further work, we will develop a web application to access multi station WDAS based on the results of the development of desktop applications that have been made previously. The target is WDAS that can work well when combined with a new station. The next stage is testing the durability and power management of the device. ACKNOWLEDGMENT The research was supported by Integrated Outstanding Scholarship (Beasiswa Unggulan Terpadu) Program from Ministry of Education of the Republic of Indonesia, Center for Environmental Research - IPB (PPLH-IPB), Department of Physics, Department of Civil and Environmental Engineering, Department of Mechanical Engineering and Bio-systems Bogor Agricultural University (IPB), West Java, Indonesia. REFERENCES [1] [2]
[3]
[4]
[5]
[6] [7]
[8]
[9]
[10]
[11]
[12]
[13]
[14]
[15]
M.F.F. Affan. 2006. Perspektif Pertanian dalam Lingkungan yang Terkontrol. Inovasi Vol.6/XVIII/Maret 2006. E.S. Nadimi, H.T. Søgaard, T. Bak, F.W. Oudshoorn. 2008. ZigBeebased wireless sensor networks for monitoring animal presence and pasture time in a strip of new grass. Computers and Electronics in Agriculture. 61 : 79–87. A. Somova, A. Baranov, A. Savkin, D. Spirjakin, A. Spirjakin, R. Passeronec. 2011. Development of wireless sensor network for combustible gas monitoring. Sensors and Actuators A, 171 : 398– 405 Fukatsu, T., Hirafuji, M. 2003. Development of Field Servers for a field monitoring system, Agricultural Information Research 12: 1-12. A. Matese, S.F. Di Gennaro, A. Zaldei, L. Genesio, F.P. Vaccari. 2009. A wireless sensor network for precision viticulture: The NAV system. Computers and Electronics in Agriculture 69 : 51–58. I. Thysen. 2000 Agriculture in the Information Society. Journal of Agriculture. Engineering Research, 76, 297-303. Ninomiya, S. 2004. Successful information technology (IT) for agriculture and rural development. http://www.agnet.org/library /article/eb549.html. Accessed on Dec. 20 2006. T. Morimoto, Y. Hashimoto. 2000. AI approaches to identification and control of total plant production systems. Control Engineering Practice, 8, 555-567. N. Wang, N. Zhang, M. Wang. 2006. Wireless sensors in agriculture and food industry—Recent development and future perspective Computers and Electronics in Agriculture, 50, 1 C. Serodio, J.B. Cunha, R. Morais, C. Couto, J. Monteiro. 2001. A networked platform for agricultural management systems. Computers and Electronics in Agriculture,31, 75–90. J.K. Hart, K. Martinez. 2006. Environmental Sensor Networks: A revolution in the earth system science?. Earth-Science Reviews 78 : 177–191. E. Jovanov, A. O’donnell Lords, D. Raskovic, P.G. Cox, R. Adhami, F. Andrasik. 2003. Stress Monitoring Using a Distributed Wireless Intelligent Sensor System. IEEE Engineering In Medicine And Biology Magazine. 0739-5175/03. A. Milenkovic´, C. Otto, E.Jovanov. 2006. Wireless sensor networks for personal health monitoring: Issues and an implementation. Computer Communications. 29 : 2521–2533 H.K. Purwadaria, I.W. Budiastra, Suroso, I.W. Astika, D.R. Heldman. 2006. Low Cost IT for Developing Countries. CIGR Handbook of Agricultural Engineering, vol. VI: 501-523. I.F. Akyildiz, W. Su, Y. Sankarasubramaniam, E. Cayirci. 2002. Wireless sensor networks: a survey. Computer Networks 38 : 393–422.
31
[16] S.C.S. Jucá , P.C.M. Carvalho, F.T. Brito . 2011. A Low Cost Concept for Data Acquisition Systems Applied to Decentralized Renewable Energy Plants. Sensors,11 :, 743-756. [17] P. Baronti, P. Pillai, VWC. Chook , S. Chessa, A. Gotta, Y. Fun Hu. 2007. Wireless sensor networks: A survey on the state of the art and the 802.15.4 and ZigBee standards. Computer Communications. 30 : 1655– 1695. [18] S. Yaiparoj, F. Harmantzis, V. Gunasekaran. 2008. On the economics of GPRS networks with Wi-Fi Integration. European Journal of Operational Reasearch. 187 : 1459 – 1475. [19] C.L Tseng, J.A Jiang, R.G Lee, F.M Lu, C.C Ouyang, Y.S Chen, C.H Chang. 2006. Feasibility SM-SMS technology to field data acquisition. Computers and Electronics in Agriculture 53 : 45 – 49. [20] M. Benghanem. 2009. Measurement of meteorological data based on wireless data acquisition system monitoring. Applied energy 86: 2651 2660. [21] L.Boquete, JMR. Ascariz, J. Cantos, R.l Barea, JM. Miguel, S. Ortega, N. Peixoto. 2012. A portable wireless biometric multi-channel system. Measurement. [22] Y. Ma, M. Richards, M. Ghanem, Y. Guo, J. Hassard. 2008. Air Pollution Monitoring and Mining Based on Sensor Grid in London . Sensors, 8: 3601-3623. [23] M. Azis, E. Rustami, W. Maulina, M. Rahmat, H. Alatas, K.B. Seminar. Measuring Air Pollutant Standard Index (ISPU) with Photonics Crystal Sensor based on Wireless Sensor Network (WSN). IEEE Proceeding of ICICI-BME. Bandung, Indonesia. 8-9 November 2011.
124402-5757 IJET-IJENS @ April 2012 IJENS
BIBLIOGRAPHY Mamat Rahmat is currently a PhD candidate at the Department of Agriculture Engineering of Bogor Agricultural University, Indonesia. He obtained his B.S. in Physics in 2000 and M.S. in Bio-physics in 2010 both from Bogor Agricultural University, Indonesia. His research interests are include photonic crystal sensor, and wired/wireless sensor networks. E-mail :
[email protected]
Muhamad Azis is currently Master Student at Biophysics Program, Graduate School, Bogor Agricultural University. He received a BS degree in Physics from the same university in 2008. His research interests are include electronic, instrumentation, and embedded system E-mail :
[email protected]
Erus Rustami is currently Master Student at Biophysics Program, Graduate School, Bogor Agricultural University. He received a BS degree in Physics from the same university in 2008. His research interests are include electronic, instrumentation, and software development. E-mail :
[email protected]
Wenny Maulina is currently Master Student at Biophysics Program, Graduate School, Bogor Agricultural University. She received a BS degree in Physics from the same university in 2008. Her research interests are biosensor, photonic crystal, and membrane. E-mail :
[email protected]
IJENS
International Journal of Engineering & Technology IJET-IJENS Vol: 12 No: 02
32
Kudang Boro Seminar is a Professor in Computer Technology in the Department of Mechanical and Biosystem Engineering, Bogor Agricultural University (IPB), Indonesia. He received M.Sc. and Ph.D. in Computer Science from University of New Brunswick, Canada. His research interests are include Information Engineering, Software Engineering, Intelligent System, Distance Learning, Internetworking, Computer Based Instrumentation and Control system. He has published many papers in referred international journals. He has also presented many research articles in national and international conferences. He has written few books related to his research work. He has written few books related to his research work. He is a board member of AFITA (Asean Federation for Information Technology in Agriculture) & ISAI (Indonesian Society of Agriculture Informatics). E-mail :
[email protected]
Arief Sabdo Yuwono is an Associate Professor in the Civil and Environmental Engineering at the Bogor Agricultural University. He received BS degree in Agricultural Engineering from Bogor Agricultural University, Indonesia, in 1989, MSc in Environmental Sanitation from Universiteit Gent, Belgium, in 1996, and PhD degree in Bio-Environmental Engineering from Universitaet Bonn, Germany, in 2003. His research interests are including environmental monitoring, environmental instrumentation, and water and air pollution quality control. He was an air quality and noise expert, air emission expert, and environmental and agricultural specialist. E-mail :
[email protected] Husin Alatas is an Associate Professor in Physics Department at the Bogor Agricultural University, Indonesia. He received BS, M.Sc, and PhD degree from Bandung Institute of Technology, Indonesia, in 1995, 1998, and 2005, respectively. Currently, he is Head of Theoretical Physics Division at Bogor Agricultural University. He is also member of Indonesia Center for Theoretical and Mathematical Physics (ICTMP), Indonesian Optical Society (InOS), and Optical Society of America (OSA). His research interest include the theory and modeling of photonic crystal based sensor. E-mail :
[email protected]
124402-5757 IJET-IJENS @ April 2012 IJENS
IJENS