Testing is considered a linear, independent task. â Testing is assumed to ... Area file/edit view insert format tools
A Low-Tech Testing Dashboard James Bach, Principal Consultant
[email protected] http://www.satisfice.com STAR ‘99 East 1
The Problem “What’s the status of testing?” “What are you doing today?” “When will you be finished?” “Why is it taking so long?” “Have you tested _______, yet?” 2
The Problem Management has little patience for detailed test status reports. n Management doesn’t understand testing. n
– – – – – – –
Testing is confused with improving. Testing is considered a linear, independent task. Testing is assumed to be exhaustive. Testing is assumed to be continuous. Test results are assumed to stay valid over time. Impact of regression testing is not appreciated. Test metrics are hard to interpret. 3
A Solution Report test cycle progress in a simple, structured way... n ...that shows progress toward a goal... n ... manages expectations... n ...and inspires support... n ...for an effective test process. ? cess o r p No em! l b o r Easy setup No P n
4
The Dashboard Concept Project conference room
Large dedicated whiteboard “Do Not Erase”
Project status meeting 5
The Test Cycle drive
Development
Quality Criteria
creates
drives
Product
focus examined by
Perceived Quality
Testing reveals
6
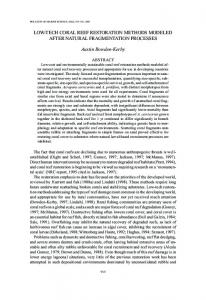
Test Cycle Report Product Areas vs.
Test Effort Test Coverage
Quality Assessment
vs. Time 7
Testing Dashboard
Updated:
Build:
2/21
38
Area
Effort
C. Q. Comments
file/edit view insert format tools slideshow online help clipart converters install compatibility general GUI
high low low low blocked low blocked none none start 3/17 start 3/17 low
1 1+ 2 2+ 1 2 0 1 1 0 0 3
1345, 1363, 1401 automation broken crashes: 1406, 1407 animation memory leak new files not delivered need help to test... need help to test... lab time is scheduled 8
Product Area
Area file/edit view insert format tools slideshow online help clipart converters install compatibility general GUI
n n n n
n n n
15-30 areas (keep it simple) Avoid sub-areas: they’re confusing. Areas should have roughly equal value. Areas together should be inclusive of everything reasonably testable. “Product areas” can include tasks or risks- but put them at the end. Minimize overlap between areas. Areas must "make sense" to your clients, or they won’t use the board. 9
Test Effort
None Not testing; not planning to test. Start No testing yet, but expect to start soon. Regression or spot testing only; maintaining coverage. Low Focused testing effort; increasing coverage. High Pause Temporarily ceased testing, though area is testable. Blocked Can’t effectively test, due to blocking problem. Going through final tests and signoff procedure. Ship 10
Test Effort Use red to denote significant problems or stoppages, as in blocked, none, or pause. n Color ship green once the final tests are complete and everything else on that row is green. n Use neutral color (such as black or blue, but pick only one) for others, as in start, low, or high. n
11
Test Coverage
0 1 1+ 2 2+ 3
We have no good information about this area.
Sanity Check:
major functions & simple data.
More than sanity, but many functions not tested.
Common Cases:
all functions touched; common & critical tests executed.
Some data, state, or error coverage beyond level 2.
Corner Cases:
strong data, state, error, or stress testing. 12
Test Coverage n n n n
n
Color green if coverage level is acceptable for ship, otherwise color black. Level 1 and 2 focus on functional requirements and capabilities: can this product work at all? Level 2 may span 50%-90% code coverage. Level 2+ and 3 focus on information to judge performance, reliability, compatibility, and other “ilities”: will this product work under realistic usage? Level 3 or 3+ implies “if there were a bad bug in this area, we would probably know about it.” 13
Quality Assessment “We know of no problems in this area that threaten to stop ship or interrupt testing, nor do we have any definite suspicions about any.” “We know of problems that are possible showstoppers, or we suspect that there are important problems not yet discovered.” “We know of problems in this area that definitely stop ship or interrupt testing.” 14
Comments Use the comment field to explain anything colored red, or any non-green quality indicator. Problem ID numbers. n Reasons for pausing, or delayed start. n Nature of blocking problems. n Why area is unstaffed. n
15
Using the Dashboard n
Updates: 2-5/week, or at each build, or prior to each project meeting.
n
Progress: Set expectation about the duration of the “Testing Clock” and how new builds reset it.
n
Justification: Be ready to justify the contents of any cell in the dashboard. The authority of the board depends upon meaningful, actionable content.
n
Going High Tech: Sure, you can put this on the web, but will anyone actually look at it???
16