fied as nonrecovery or recovery experiments. ..... drive liquid nitrogen from an external reservoir ... clean with acetone and ethyl alcohol, in that or- ... The plates are optically aligned at room tem- ...... in the second flyer plate, although its hard-.
Low-Velocity Impact Testing Horacio Dante Espinosa, Northwestern University Sia Nemat-Nasser, University of California, San Diego
IMPACT TESTS are used to study dynamic deformation and failure modes of materials. Low-velocity impact techniques can be classified as plate-on-plate, rod-on-plate, plate-onrod, or rod-on-rod experiments. Two types of plate-on-plate impact tests have been developed: wave propagation experiments and thin-layer high-strain-rate experiments. The plate-on-plate experiments are further classified as nonrecovery or recovery experiments. The focus of this article is on plate-on-plate experimental techniques. At the end of this article, rod-on-plate and plate-on-rod experiments are briefly examined. Observation of plane waves in materials provides a powerful method for understanding and quantifying their dynamic response (Ref 1–9) and failure modes (Ref 10–29). Plate impact experiments are used to generate such plane waves (Ref 30–32). These experiments provide controlled extreme stress-state loading conditions, involving one-dimensional stress-pulse propagation. The recovery configurations in plate-on-plate impact experiments are performed with the objective of examining the microstructural changes in the specimen after it is subjected to loading under a uniaxial strain condition. The experiments are designed to achieve a controlled plane-wave loading of the specimens. In practice, this is limited by the finite size of the plates employed, which generate radial release waves. This has the potential for significant contribution to the damage processes by introducing causes other than the uniaxial straining of the material. Hence, this aspect of the plate impact experiment has been a subject of considerable research in the past (Ref 11, 13, 33–39). The plate impact experiments are performed in two main modes: normal impact and pressure-shear, or oblique, impact. Both modes have been specialized to several new configurations to achieve different aspects of control over the imposed loading. In these experiments, the time histories of the stress waves are recorded and used to infer the response of the specimen with the goal of constitutive modeling. To enable the formulation of correct constitutive behavior for the considered material, knowledge of the micromechanisms of defor-
mation that occur during the passage of the stress waves is necessary. Such knowledge is also necessary for damage-evolution studies. Hence, it is important that the specimen is recovered after it is subjected to a well-characterized loading pulse so that it can be analyzed for any changes in its microstructure. This is achieved in the normal plate impact mode by using an impedance-matched momentum trap behind the specimen (Ref 1, 7, 11). Ideally, the momentum-trap plate captures the momentum of the loading pulse and flies away, leaving the specimen at rest. Initially, the recovery technique was developed for the normal plate experiments (Ref 1, 38, 39), and it has been implemented in the pressure-shear mode to study shear stress-sensitive, high-rate deformation mechanisms. The difficulty in conducting pressure-shear recovery experiments stems from the fact that both the shear and longitudinal momenta must be trapped and that there is a large difference in the longitudinal and shear wave velocities for any given material. To overcome this problem, one idea that had been proposed was to use a composite flyer made of two plates of the same material that are separated by a thin layer of a low shear resistance film, such as a lubricant (Ref 40, 41). This design would enable the shear pulse to be unloaded at the interface, while the pressure pulse would be transmitted to the next plate. The pressure pulse would return to the specimen momentum-trap interface as an unloading wave after the unloading of the shear wave has taken place. The thickness of the momentum-trap plate is chosen such that the normal unloading wave from its rear surface arrives at this interface much later, and hence, the momentum trap would separate just as in the normal recovery experiment, but after trapping both the shear and normal momenta. The plate impact experiments can be performed at different temperatures by providing temperature-control facilities in the test chamber. This may consist of a high-frequency (0.5 MHz) induction heating system, for high-temperature tests, or a cooling ring with liquid nitrogen circulating through an inner channel, for low-temperature experiments (Ref 42–44).
Confined and unconfined rod experiments have been performed (Ref 45, 46) with the aim of extending the uniaxial strain deformation states imposed in the plate impact experiments. The bar impact and pressure-shear experiments provide a measurement of yield stress at rates of 103 to 105/s−1. They also allow the experimental verification and validation of constitutive models and numerical solution schemes under two-dimensional states of deformation. In-material stress measurements, with embedded manganin gages, are used to obtain axial and lateral stress histories. Stress decay, pulse duration, release structure, and wave dispersion are well defined in these plate and rod experiments.
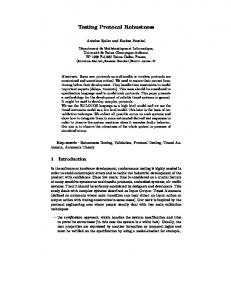
Plate Impact Facility Gas Gun. The low-velocity impact experiments are generally performed in single-stage gas guns that are capable of firing projectiles of complex shapes as well as various materials and weights at limited velocities. Plate impact experiments discussed in this section were carried out on single-stage light-gas guns capable of projectile velocities from a few tens of meters per second to 1200 m/s (3940 ft/s). A light gas gun facility generally has four interconnected parts: a pressure chamber or breech, a gun barrel, a target chamber, and a catcher tank (Fig. 1). Different types of breeches have been used. The most common is a wraparound breech, which employs no moving parts under pressure except the projectile itself as a fastopening valve. The projectile back piston, which closes the breech, is designed to withstand the gas pressure. The breech holds gas at pressures between 1.4 and 20.7 MPa (200 and 3000 psi) to accelerate the projectile through the gun barrel and into the target chamber. The gun barrel diameter and length may be different, depending on the design. Examples include:
• 76.2 mm (3 in.) diameter and 6.09 m (20 ft) •
long gun with velocities in the range of 50 to 1000 m/s (165 to 3280 ft/s) 60 mm (2.4 in.) diameter and 1.2 m (3.9 ft) long gun with moderate velocities up to 200 m/s (660 ft/s)
540 / High Strain Rate Testing
• 56 mm (2.2 in.) diameter and 10 m (33 ft) • •
long high-velocity gun with velocities up to 1200 m/s (3940 ft/s) 152 mm (6 in.) diameter and 5 m (16.4 ft) long gun with moderate velocities up to 400 m/s (1300 ft/s) 25 mm (1 in.) diameter and 5 m (16.4 ft) long gun with velocities up to 1200 m/s (3940 fts/s)
The inner surface of the barrel is honed to an almost mirror polish to reduce friction. To prevent projectile rotation, either a keyway is machined along the barrel, or the barrel is lightly broached. The target chamber is equipped with a special mounting system to hold the target assembly at normal or oblique angles. This system may allow remote rotation of the target, in any direction, to preserve the alignment upon target heating/cooling or simply prior to firing. The chamber and gun barrel are evacuated using a vacuum pump to a pressure of approximately 50 mtorr. Among other things, this prevents the formation of an air cushion between the target and flyer at impact. To avoid overpressure in the target chamber, after gas expansion, an exhaust system to ambient air may have to be implemented if the volume of the target chamber and the catcher tank is not adequate. The target and specimen leave the vacuum chamber through a rear port. A catcher tank filled with cotton rugs is used to decelerate and recover the projectile and target. Projectile. The projectile used for these experiments consists of a fiberglass tube, usually about 25 cm (10 in.) in length, with an aluminum back piston on the rear end and a polyvinyl chloride (PVC) holder on the front. The flyer plate or rod is glued to the PVC holder, which has a machined cavity. The fiberglass tube is centerless ground so that it slides smoothly in the gun barrel. A set of two holes in the fiberglass tube ensures that the pressure
Fig. 1
Gas gun facility for low-velocity impact testing
inside the projectile remains essentially the same as that on the outside. This prevents unwanted deformation of the projectile when the system is under vacuum. The aluminum back piston is screwed or glued to the fiberglass tube for high and low velocities, respectively. It holds a sealing set of two O-rings to withhold the breech pressure. A plastic key fitting the barrel keyway is placed in a slot machined on the wall of the fiberglass tube. The PVC holder carries the flyer backed by foam material to achieve wave release. All the pieces are glued together with five min epoxy. Velocity Measurements. The velocity of the projectile just prior to impact is measured by means of a method that is similar to the one described in Ref 47. Ten pins of constantan wire, less than 0.1 mm (0.004 in.) in diameter, are positioned in pairs at the exit of the gun barrel. The pins are connected to an electronic box in which output, recorded in an oscilloscope, consists of steps every time a pair of pins closes the circuit. The PVC holder is coated with a silver paint to achieve conductivity between pins. The distance between the positive pins is measured with a traveling microscope with a resolution of 1 µm or better. When this distance is divided by the time between steps, as recorded in the oscilloscope, an average velocity is obtained. The accuracy of the system is better than 1%. The motion of the target or anvil velocity is measured by interferometric techniques (Ref 48–51). In the case of low-velocity experiments, the variable sensitivity displacement interferometer (VSDI) is employed (Ref 52). Alternatively, for high- and low-temperature planar impact tests, an air-delay-leg normal velocity interferometer for any reflecting surface (ADL-VISAR) is used. In both cases, disposable mirrors are positioned at a certain distance from the rear surface of the specimen to allow
illumination and interrogation of the target back surface. A side window on the target chamber provides access to the laser beam of the interferometer. Two digital oscilloscopes record the interferometer traces and velocity/tilt signals. Maximum sample rate, up to 4 million samples per second, 1 GHz bandwidth and 8 MB of memory may be used. The oscilloscopes are employed at full bandwidth and with a sample rate of 1 million samples per second or higher. Tilt Measurement. The tilt during impact is measured by means of four contact pins placed on the surface of the target (Ref 1). When the target or the anvil plate can be drilled, four self-insulated metallic pins lapped flush with the front surface of the target/anvil plate are positioned in the periphery. When these pins are grounded by the flyer, a staircase signal is recorded on the oscilloscope at a ratio of 1 to 2 to 4 to 8. The tilt can be estimated by fitting a plane through the tilt pins by a least-square analysis. When the previous technique cannot be used, a special shape-conductive coating can be applied, using a mask, to the target impact surface and the same principle applied (Ref 7, 11). In some cases, such as in high-temperature testing, neither of the previous approaches is feasible, and tilt cannot be measured without major modifications. High-and Low-Temperature Facilities. A high-temperature facility consists of an induction heating system and a heat exchanger for cooling the device and the coil around the specimen. A schematic of the high-temperature target assembly is shown in Fig. 2. This type of system is capable of delivering 25 kW of constant power at high frequency (0.5 MHz). Temperatures up to 1200 °C (2200 °F) in metallic and ceramic materials have been achieved in calibration tests. A photograph of the target chamber and high-temperature setup is shown in Fig. 3. The temperature is externally monitored by a K-type thermocouple glued close to the back face of the sample. An electronic control is employed to regulate the temperature. The system adjusts the heating ramp to minimize thermal shock and deformation in the specimen. The induction copper coil is mounted in the mentioned target holder and connected to the heating system by means of a specially designed feedthrough. The coil is made from copper tubing. The copper section conducts the high-frequency electrical energy, whereas the inner core carries refrigeration water. The intense electromagnetic field inside the coil induces parasite currents in the magnetic target. A graphite susceptor holder is employed to position the target and heat nonconductive materials. Ceramic foam is placed between the sample and the copper coil to confine heat to the sample. A copper tube is connected to a water line to keep its temperature low and shield electromagnetic radiation. This shield is attached to the alignment rings, which support the whole target assembly.
Low-Velocity Impact Testing / 541 For low-temperature testing, a cooling ring with liquid nitrogen circulating through an inner channel is used to reduce the temperature of the samples down to –150 °C (−238 °F). The ring consists of two pieces of aluminum machined to fit together with special seals for low temperature to make the holder leak proof. Appropriated stainless steel hoses are used to drive liquid nitrogen from an external reservoir tank. The sample is kept in place inside the cooling ring by means of a disposable aluminum ring and polymethyl methacrylate (PMMA) pins. The liquid nitrogen is provided by a 175 kPa (25 psi) external tank. Once the heat exchange has taken place, the nitrogen in gaseous state is bled from the vacuum chamber. The temperature is monitored by means of a type J thermocouple glued to the rear surface of the specimen (Ref 27).
Specimen Preparation and Alignment To generate plane waves at impact and upon reflection off interfaces, the faces of the flyer and specimen plates must be flat. The flyer
plate and specimen are lapped flat (using, e.g., 15 µm alumina abrasive first, and then 6 µm diamond abrasive). The accepted flatness of these surfaces is around 1.5 to 2 wavelengths of green light (λ = 550 nm). This is measured by counting the number of interference fringes (Newton’s rings) formed between the polished surface and an optical flat. The procedure is continued until only two fringes are visible over the whole surface. The rear surface of the target plate is polished using 1 µm and 1 4 µm diamond abrasive to obtain a reflective surface for interferometric purposes. For a pressure-shear recovery experiment, the surfaces corresponding to the solid or liquid lubricant interface are highly polished. All other surfaces are roughened by lapping with 15 µm diamond paste. This is to ensure sufficient surface roughness to transfer the shear loading by dry friction. The specimen is cleaned ultrasonically in ethyl alcohol. The polished surface is wiped clean with acetone and ethyl alcohol, in that order, and stored. The final surface is often scanned using a profilometer. When certain materials are tested at high temperatures, oxide thin films may form, which can reduce reflectivity significantly. For instance, Ti-6Al-4V surfaces oxidize very fast. Thin lay-
ers of oxide form at temperatures between 315 and 650 °C (600 and 1200 °F). The film is barely perceptive, but with increasing temperature and time, it becomes thicker and darker, acquiring a straw-yellow color at about 370 °C (700 °F) and dark blue at 480 °C (900 °F). Temperatures high enough to produce oxidation may be reached even under a vacuum of less than 50 mtorr. This oxide layer reduces the reflectivity of the titanium surface, making it difficult to obtain a good interferometric signal. To overcome this difficulty in Ti-6Al-4V, a platinum coating (0.1 µm thick) has been applied to the back surface of the specimen. A pre-etching of the surface guarantees a good adhesion of the coating. Platinum is stable at high temperature; however, due to mismatch in coefficients of thermal expansion, debonding may occur if the surface temperature of the specimen is increased too fast. Therefore, the induction heating power must be controlled at all times with a feedback loop and coating materials selected to match the target thermal properties. The plate dimensions are selected such that at the center of the specimen, a unidimensional strain state is kept for a few microseconds before release waves from the periphery arrive to the observation point(s). These dimensions are B
Ceramic plate
Flexible lead
A Water tubing for shield
Coil (in/out)
Coil Ceramic pi Shield and tubing water Ring# Refractory material A
B
Slot for ceramic pins
½8 in. water tubing for shield
½ 16 in. copper plate ½8 in. water tubing for shield
½8 in. water tubing for shield
½8 in. water tubing for shield
Copper shield Section A-A
Fig. 2
Target assembly for high-temperature, low-velocity impact tests. Dimensions in inches. Source: Ref 44
542 / High Strain Rate Testing a function of the type of experiment and configuration and are therefore discussed separately. The plates are optically aligned at room temperature using the technique described in Ref 1. For this technique, the projectile is advanced to a position near the target, and a specially coated precision prism is placed between the two surfaces to be impacted. An autocollimator is used to first align the prism to the flyer and then the specimen to the prism. In this way, the surfaces of the flyer and the specimen are aligned with an accuracy of 0.02 milliradians. After alignment, the projectile is pulled back to the other end of the launch tube. To preserve target alignment, especially in the case of high- and low-temperature experiments, the position of a collimated laser beam, reflected from the rear surface of the target plate, is monitored on a stationary screen roughly 12 m (40 ft) away. A target plate tilt of 1 milliradian results in a beam translation of 1.2 cm (0.47 in.) on this screen. This remote beam system allows monitoring of the tilt along the vacuum process and during the heating or cooling of the sample. Remote mechanical controls attached to the target holder screws are employed to drive the target back to its original position, thereby ensuring that the target and the flyer plates maintain their original room-temperature alignment. The quality of the interferometric signals is usually an indication of the parallelism at impact.
Surface Velocity Measurements with Laser Interferometric Techniques Barker and Hollenbach (Ref 48) developed a normal velocity interferometer (NVI), where normally reflected laser light from a target plate was collected and split into two separate beams, which are subsequently interfered after traveling through different path lengths. The sensitivity of the interferometer is a function of the delay time between the interfering beams. The resulting fringe signal is related directly to changes in the normal particle velocity. Barker and Hollenbach (Ref 49) then introduced a significantly improved NVI system termed a velocity interferometer for any reflecting surface (VISAR), developed based on the wide-angle Michelson interferometer (WAM) concept, resulting in an interferometer capable of velocity measurements from either a spectrally or diffusely reflecting specimen surface. Another improvement incorporated into the VISAR was the simultaneous monitoring of two fringe signals 90° out of phase. In most VISAR systems, three signals are recorded—the two quadrature optical signals obtained from horizontally and vertically polarized components of light that differ in phase because of the retardation plate and the intensity-monitoring signal used in data reduction. However, higher signal-to-noise ratios can be obtained by subtracting the two s-polarized beams and the two p-polarized
Fig. 3
Gas gun vacuum chamber with high-temperature setup. Source: Ref 44
beams, both pairs 180° out of phase (Ref 53). This feature, known as push-pull, significantly reduces the noise introduced by incoherent light entering the interferometer. Another laser interferometer to emerge in the 1970s was the laser Doppler velocimeter (LDV) developed by Sullivan and Ezekiel (Ref 54). The LDV can be used to monitor in-plane motion but does not lend itself to the simultaneous monitoring of normal motion. The need to measure both normal and in-plane displacements prompted the development of the transverse displacement interferometer (TDI) by Kim et al. (Ref 50). The TDI takes advantage of diffracted laser beams generated by a grating deposited or etched onto the specimen rear surface. In this technique, the 0th order reflected beam is used to monitor longitudinal motion in a conventional way, for example, by means of an NVI or normal displacement interferometer (NDI), while any pair of nth order symmetrically diffracted beams is interfered to obtain a direct measure of the transverse particle displacement history. The sensitivity of the TDI is given by 1 2 σ n (mm/fringe) where σ is the grating frequency and n represents the order of the interfering diffracted beams. Chhabildas et al. (Ref 55) presented an alternative interferometric technique particularly suited for monitoring in-plane particle velocities in shock wave experiments. The technique employs two VISARs that monitor specific diffracted laser beams from a target surface. Both techniques, the two-VISAR and the NDI-TDI, have advantages and disadvantages. The combined NDI-TDI system has a much better resolution at low velocities but requires the deposition of grids on the free surface of the target plate. On the other hand, the two-VISAR
technique provides velocity profiles directly without the need to differentiate displacement profiles. Although the two-VISAR technique is simpler to use when optical window plates are needed, it was shown that a combined NVI-TDI with window interferometer is feasible (Ref 56). The relatively small range of velocities that can be measured by the NDI motivated the development of the NVI. The sensitivity of the NDI is given by λ/2 (mm/fringe) where λ represents the laser light wavelength. The extreme sensitivity of this interferometer severely limits its application in wave propagation experiments due to the inordinately high signal frequencies that may be generated. An NVI or a VISAR, on the other hand, has a variable sensitivity given by λ /[2τ + (1 + δ)](mm/µs/fringe), where τ represents a time delay between the interfering light beams introduced by an air-delay leg or etalon in the interferometer. The factor (1 + δ) is a correction term to account for the refractive index of the etalon. An appealing feature of this interferometer is that the fringe record is a direct measure of particle velocity, thereby alleviating the need for differentiation of the reduced signal. Moreover, signal frequencies generated by an NVI are proportional to particle acceleration and are, therefore, lower than equivalent signal frequencies generated by an NDI. However, during an initial time period τ, an NVI is functioning as an NDI since the delayed light arriving at the detector from the delay leg or etalon is reflected from a stationary target (Ref 57). Ironically, it is the interpretation of the NVI in the interval where it operates as an NDI that limits the usefulness of the NVI in the low-velocity range (0.1–0.25 mm/µs). In this velocity range, values of τ in the
Low-Velocity Impact Testing / 543 neighborhood of 5 ns or more are required to obtain records with at least three or four fringes. This in turn leads to a greater averaging of the velocity measurements. Furthermore, elastic precursors causing velocity jumps of more than 0.1 mm/µs in a time less than τ cannot be detected because the early time NDI signal frequency may exceed the frequency response of the light-detection system. This feature is described as lost fringes in Ref 58. Clearly, the NDI and VISAR principles described here indicate that there is a velocity range between 0.1 and 0.25 mm/µs over which particle velocities may not be measured with the desired accuracy. Barker and Hollenbach (Ref 49) investigated the accuracy of the VISAR experimentally. They found that measurements with 2% accuracy could be obtained when a delay time of approximately 1 ns corresponding to a velocity per fringe constant equal to 0.2 mm/µs is used. Certainly, velocities below 0.2 mm/µs can be measured, but the uncertainty of the measurement increases because only a fraction of a fringe is recorded. In this case, signals in quadrature have to be recorded immediately before the experiment and assume the amplitude remains the same during the experiment (Ref 59). It should be pointed out that the VISAR data reduction is very sensitive to the position and shape of the Lissajous (Ref 59). Despite these minor subtleties, the VISAR is currently the more versatile and easy-to-setup interferometer. Many laboratories around the world have adopted the VISAR as a routine tool for particle velocity measurement in normal impact experiments. Typically, delay times between 1 and 1.5 ns are employed. In this working range, the VISAR possesses a very high accuracy and sensitivity. A common feature of all interferometers discussed in this section is that successful signal acquisition requires good fringe contrast during the time of the experiment. Contrast losses arise from two main causes, interferometer imperfections and target motion (displacement and tilt). These losses can be, in general, time varying. For instance, a beam splitter that does not split light equally will produce a constant loss of contrast, while unevenly curved surfaces will produce a variable contrast change as a function of the light path in the interferometer. Target rotations that change the light path can be very detrimental to most interferometers. In this respect, interferometers that use scatter light from the target and fiber optics to transfer the laser light will minimize the loss in fringe contrast because the light path in the interferometer is fixed. Furthermore, even target rotations of a few milliradians will not result in signal loss in such systems. By contrast, standard interferometer setups, without fiber optics, require tilts smaller than 1 milliradian to avoid a change in the light path that can offset the beam from the optical components of the interferometer. This feature is particularly relevant in two- and three-dimensional wave propagation problems (e.g., penetration experiments, in which significant surface rotations are expected
at diagnostic points). In the early 1990s, Barker developed a VISAR with these features (Ref 58). In 1998, the same company introduced a multipoint fiber optics VISAR to the market. Espinosa et al. (Ref 52) introduced a variable sensitivity displacement interferometer (VSDI) to provide an alternative to the NDI, as well as to VISAR interferometers as applied to plate impact experiments, particularly when normal and in-plane velocity measurements need to be recorded simultaneously in the range of 50 to 250 m/s (165 to 820 ft/s). The sensitivity of such an interferometer is variable, and thus, it can operate over a wide range of particle velocities without exceeding the frequency response of the light-detection system. The VSDI interferometer is discussed in more detail subsequently. Variable Sensitivity Displacement Interferometer (VSDI) Theory. To examine the results of this method, consider the effect of interfering a normally reflected beam with a beam diffracted at an angle θ with respect to the specimen normal as shown in Fig. 4. The normally reflected beam is split at beam splitter BS1. Each half of the normal beam is then made to interfere with one of the diffracted beams via beam splitters BS2 and BS3. The resulting signals generated by each interfering beam pair are monitored by photodetectors. The combined field for either pair of interfering plane waves leads to a classical interference expression, from which the following result is deduced (Ref 52). For purely normal motion (desensitized normal displacement interferometer, DNDI): normal displacement λ λ = = fringe 1 − cos θ 1 − 1 − ( nλσ ) 2
where σ = 1/d represents the frequency of a diffraction grating with pitch d. The fringe constant varies from infinity at θ = 0° to λ (mm/fringe) at θ = 90°. Therefore, a VSDI is obtained that is particularly well suited for normal plate impact experiments with particle velocities in excess of 100 m/s (330 ft/s). Clearly, the selection of the appropriate angle θ should be based on deductive knowledge of the frequency range that will be spanned. For purely in-plane motion (desensitized transverse displacement interferometer, DTDI): λ 1 transverse displacement = = sin θ σn fringe
The DTDI sensitivity ranges from a complete loss of sensitivity at θ = 0° to a theoretical sensitivity limit of λ (mm/fringe) at θ = 90°. The interferometer is “desensitized” in the sense that, for the same diffraction orders, it exhibits one-half the sensitivity of the transverse displacement interferometer (TDI) (Ref 50). For combined normal and in-plane motions (VSDI system): normal displacement λ = fringe 2 (1 − cos θ) transverse displacement λ = fringe 2 sin θ
This last sensitivity is the same as the one exhibited by the TDI (Ref 50). It should also be noted that the normal displacement sensitivity is twice the sensitivity obtained by a single VSDI system in the case of pure normal motion principally because the signal obtained by the addition of two VSDI systems exhibits a double recording of the normal displacement.
Plate Impact Soft-Recovery Experiments Normal and pressure-shear plate impact soft-recovery experiments (Ref 16–18) offer attractive possibilities for identifying the principal mechanisms of inelasticity under dynamic tension and compression, with and without an accompanying shearing. The samples are recovered, allowing their study by means of microscopic characterization. This feature, together with the real-time stress histories, may be used to assess the validity of constitutive models (Ref 8, 14, 20–22, 29, 60). This kind of experiment on brittle materials provides information on the onset of elastic precursor decay, spall strength, and material softening due to microcracking. A plate impact experiment involves the impact of a moving flat plate, called a flyer, with another stationary plate, called the target, which may be the specimen. In the normal plate impact experiment, the specimen is subjected to a compression pulse, and the material at the center of the specimen is under a strictly uniaxial strain condition. In the pressure-shear experiment, the specimen undergoes a combined compression and shearing. Thus, the material undergoes a transverse shearing while it is in a compressed condition. The wave propagation is one dimensional, since both the pressure and shear pulses travel along the same axis. The recovery configuration in the normal impact mode employs a backing plate for the target to capture the longitudinal momentum. In the pressure-shear recovery mode (Ref 16–19, 52) two flyer plates that are separated by a thin lubricant layer (which is a thin film of minimal shearing resistance and very high bulk modulus) are used along with the backing plate to capture the longitudinal and shear momenta. A liquid lubricant was used by Machcha and Nemat-Nasser (Ref 16), while a solid lubricant (photoresist AZ 1350J-from Hoechst Celanese) was used by Espinosa and coworkers (Ref 17–19, 52). In practice, the amount of the trapped shear momentum depends on the shear properties of the lubricant thin film. All plates have to be reasonably impedance matched to obtain good results. Good discussions of the requirements for normal recovery can be found in Ref 7, 11, and 38. Figure 5 shows the configuration of the plates and the time-distance, t-X, diagram for the normal impact recovery experiment (Ref 1, 7, 11). Figures 6 and 7 show the experimental layouts and t-X diagrams for the high-strain-rate (Ref 17–19) and wave propaga-
544 / High Strain Rate Testing tion (Ref 16, 18, 19) pressure-shear recovery experiments, respectively. To reduce the boundary release wave effects, guard rings and confining fixtures have been used around the circumference of the sample (Ref 33, 36, 37). This requires close tolerances
was implemented in experimental studies by a number of researchers (Ref 11, 13, 14, 35, 37, 61, 62). Three-dimensional simulations on different configurations have also been conducted by many authors (Ref 13, 36, 63, 64) for the normal impact configuration, leading to
in machining, making the specimen preparation and assembly difficult. A better approach was proposed by Kumar and Clifton (Ref 38), who made use of a star geometry for the flyer to redirect the release waves and decrease their damaging effect at the center. This approach
Beam expander M0
Argon ion laser Photodetector 1 M4
BS3
d
e
(Θ+ VSDI system) Photodetector 2
M2
BS2
M1 c′
BS1
Photodetector 3
e′–
c M5
b
(Θ– VSDI system)
Photodector 4 Focusing lens (F)
a Vacuum chamber
–nth order Θ– Target
LeCroy
Path lengths: l 0 = l + = l – Θ− System: ac′e′ = ab′d′–e′– Θ+ System: abce = ade
Projectile and flyer
Breech
M3
d′−
b′−
Trigger signal
0th order Grating +nth order Θ+ Tilt box
Velocity pins Vacuum pump High-pressure gas tank Oscilloscope (velocity signal)
Optical layout of a variable sensitivity displacement interferometer (VSDI) system. The Θ± system is obtained by combining a normally reflected beam and a diffracted beam at an angle Θ±. In this figure, mirrors M0–M5 and beam splitters BS1–BS3 are used to obtain the VSDI systems. The lens with focal length F is used to focus the beam at the grating plane in the anvil back surface. Source: Ref 52
Fig. 4
Fig. 5
Soft-recovery, normal impact testing. (a) Test configuration. (b) Lagrangian time-distance (t-X) diagram for soft recovery experiment. Source: Ref 7
Low-Velocity Impact Testing / 545 several recommendations to improve this configuration. Experimental evidence shows that it is difficult to recover brittle specimens intact, even at moderate stresses of about 2.0 GPa (290 ksi). Results from numerical simulations suggest that thin flyer plates must be used, which lead to short loading duration. This is difficult to implement in the pressure-shear recovery experiments since very thin plates produce negligible shear pulse duration. Investigation of the release effects in the pressure-shear and normal plate impact recovery experiments on brittle materials shows that the geometry of the plates may be used to mitigate release effects (Ref 16–19). Independently of the geometry of the pressure-shear configuration, some fraction of the energy always remains in the sample as shear momentum and may affect the radial release waves before they are trapped. The question of the residual shear pulse, which arises because of the shear strength of the lubricant layer, must always be addressed.
Normal Plate Impact Experimental facilities, projectile characteristics, measurement techniques, and specimen
Fiberglass tube
preparation and alignment are discussed in the preceding sections of this article. To illustrate the basic procedure and the corresponding results, consider first the normal configuration shown in Fig. 5(a), with the t-X diagram of Fig. 5b, in the context of the investigation of inelasticity in a ceramic composite (Ref 7). The fiberglass tube projectile carries steel and starshaped Ti-6Al-4V flyer plates that are separated by a low-impedance foam to prevent reloading of the specimen by reflected waves. The Ti-6Al-4V flyer has sufficiently high yield strength and acoustic impedance lower than the tested ceramic composite sample. The target assembly consists of an inner cylinder for supporting the specimen and an outer anvil for stopping the projectile. The anvil has a disposable brass nose, which absorbs part of the impact energy. The 22 by 22 mm2 (0.87 by 0.87 in.2) specimen is a thin plate of AlN/AlN/Al composite, backed up by the same size plate, which, ideally, has matching impedance. This plate flies off the back of the specimen after the main compressive pulse reflects from the rear surface and returns to the interface. Experimental Procedure. A 63 mm (2.5 in.) gas gun was used (Ref 7). The specimen characteristics and relevant test data are reported in Tables 1 and 2. For the purpose of aligning and
Multiplate flyer
Target
V
triggering the oscilloscopes, a multilayer thin film mask was sputtered onto the impact face of the specimen. Since the AlN/AlN/Al composite is conductive, a 1 µm thick insulating layer of Al2O3 was first sputtered. Then, by using a mask, a 0.1 µm thick layer of aluminum was sputtered in the form of four diagonal strip pins at the corners and two ground strips crossing at the center. Tilt and impactor velocity were measured using the techniques discussed in the section “Plate Impact Facility” in this article. The normal motion at four points on the rear surface of the momentum-trap plate was monitored by means of a normal displacement interferometer (NDI) to identify nonplanar motions that can be correlated with the microcracking process and the unloading waves from the star-shaped flyer. Wave Propagation Analysis. At impact, plane compression waves are produced in both the thin star-shaped flyer and the specimen. The reflection from the foam-flyer interface unloads the compressive wave, resulting in a compressive pulse of duration equal to the round-trip travel time through the thickness of the star flyer. When the compressive pulse reaches the rear surface of the specimen, the gap between the specimen and the momentumtrap plate produces a reflected wave, which un-
Specimen
Momentum trap
Θ– VSDI α Specimen
Multiplate flyer
(a)
(a)
Compression Multiple flyer
Shear
t Anvil
Plate 1
Multiplate flyer
Plate 2
Compression release at lubricant interface
t Specimen
Interferometer windows
Wafer Shear wave
Momentum trap
Plate 1
Interferometer windows
Plate 2 4 Shear motion
Normal wave
Shear motion
Lubricant film Normal motion
3
s
2
UL
First signal
1
Normal motion
Us
Residual shear wave
Transmission of shear motion
x d1
(b)
d2
Solid or liquid lubricant
Specimen
Pressure-shear high-strain-rate testing. (a) Test configuration. (b) Lagrangian t-X diagram for pressure-shear high-strain-rate recovery experiment. Source: Ref 18, 19
Fig. 6
Normal wave
d3
x (b)
d1
d2
d3
Pressure-shear wave propagation testing. (a) Test configuration. (b) Lagrangian t-X diagram for pressure-shear wave propagation recovery experiment. Source: Ref 18, 19
Fig. 7
546 / High Strain Rate Testing loads the compressive pulse. Tensile stresses are generated after crossing the compressed region. By the time this pulse reaches the flyer-specimen interface, separation between the flyer and specimen has taken place, and the pulse reflection causes compressive stresses. The initial compressive pulse, minus the pulse reflected at the gap, propagates into the momentum trap and reflects back. When this tensile pulse reaches the interface between the specimen and the momentum trap, the momentum trap separates because this interface cannot withstand tension. At this time, the specimen is left unstressed and without momentum. Because of the impedance mismatch between the specimen and the momentum trap, an additional compressive wave is reflected at the interface and makes a round trip through the specimen. This relatively small compressive reloading occurs later than the principal loading of interest and is expected to have minor influence on the observed damage. This one-dimensional analysis is valid in the central region of the specimen (Ref 38), where the effects of diffracted waves from the corners and the edges of the flyer are minimized. The only cylindrical wave, which passes through the central octagonal region, is a shear wave diffracted from the boundary upon the arrival of a cylindrical unloading wave at 45°. To fully assess the role of the cylindrical waves diffracted from the edges of the star and the spherically diffracted waves from the corners of the flyer and the specimen, three-dimensional elastic computations have been performed (Ref 13). The principal unloading waves that travel in the central octagonal region are diffracted spherical waves emanating from the corners of
Properties of materials used in normal impact recovery experiments Density, g/cm3
Material
Hampden steel Ti-6Al-4V AlN/AlN/Al
7.86 4.43 3.165
Longitudinal wave speed, mm/µs
Transverse wave speed, mm/µs
Acoustic impedance, GPa · µs/mm
Shear impedance, GPa · µs/mm
5.983 6.255 9.50
3.264 3.151 5.5
47.03 27.71 30.07
25.66 13.96 17.41
Source: Ref 7
0.10
Experimental records
Table 2 Summary of results from normal impact recovery experiments Projectile Shot No. velocity, mm/µs
Normal stress GPa ksi
Shear stress MPa ksi
91-01 91-02
1.417 1.889
475 633
0.0804 0.1070
206 273
69 92
Experimental records Elastic solution
1000
0.04
500
0.02
0 0
200
400
600 800 Time, ns
1000
1200
Normal velocity, mm/µs
1500
0.06
Normal stress, MPa
Elastic solution
Normal velocity, mm/µs
Inclining the flyer, specimen, and target plates with respect to the axis of the projectile produces compression-shear loading. By varying the inclination angle, a variety of loading
2500
2000
Fig. 8
Pressure-Shear Plate Impact
Source: Ref 7
0.08
(a)
between the specimen and the momentum trap. Its close resemblance to the main pulse is an indication of the dominance of plane waves in the central region of the sample. In the experiment at lower impact velocity (Fig. 8a), the compressive pulse has the full amplitude of the elastic prediction. This implies that, initially, the material did not undergo inelastic processes at this level of stresses. The small reduction in amplitude at the end of the pulse can be interpreted from the analysis of release waves from the star-shaped flyer corners (Ref 13). The tail at the end of the first compressive pulse appears to be the result of the inelastic strain rate produced by the nucleation and propagation of microcracks (Fig. 8a). If so, the duration of the tail can be associated with the time required for the stress, at the wave front, to relax to the threshold value required for initiating crack propagation. Strong evidence of microcracking is found in the attenuation and spreading of the second compressive pulse. In Fig. 8(b), some indication of inelasticity in compression appears toward the end of the pulse. This feature is consistent with the increase in dislocation density, within the AlN filler particles, the AlN reaction product, and the Al phase, observed in transmission electron microscopy (TEM) samples made from the recovered specimens (details can be found in Ref 7).
2000
0.08
1500
0.06 0.04
1000
0.02
500
0
0 1400
0
200
400
600 800 Time, ns
1000
1200
Normal stress, MPa
Table 1
the flyer. These waves produce tensile stresses within the sample. The maximum amplitudes of such stresses occur for transverse tensile stresses at the rear surface of the specimen. These amplitudes are of the order of 15% of the longitudinal compressive stress in the incident plane wave. It should be pointed out that this amplitude represents an upper bound for such stresses. First, in real experiments there is a lack of simultaneity for the time of contact of the eight corners due to the tilt between the flyer and the specimen. Second, the divergence of the unloading waves from the corners will induce microcracking near these corners and thereby reduce the level of tensile stresses that propagate into the central octagonal region to a value below a fracture stress threshold. These features have been observed systematically in Al2O3 and AlN/AlN/Al composite tested samples. Experimental Results. A summary of the experiments is given in Tables 1 and 2. The velocity-time histories of two typical results are given in Fig. 8(a) and (b). The reported stresses are at the interface between the specimen and the momentum trap. The maximum shear stress is given. The stress-time histories at the front surface of the momentum trap can be read from the secondary vertical axis. Dashed lines in the plot are the elastic solution results, which are used as a reference to discuss several observed inelastic effects. The main compressive pulse, with duration between 240 and 195 ns, is followed by a second compressive pulse corresponding to the tensile pulse generated by an intentional gap of 30 and 85 ns in Fig. 8(a) and (b), respectively. The third pulse results from the reflection of the main pulse at the interface
0 1400
(b)
Velocity-time profiles for normal impact recovery experiments. (a) Profile for shot No. 91-01 in Table 2. Second compressive pulse is attenuated due to material dynamic failure in tension. (b) Profile for shot No. 91-02 in Table 2. A strong spall signal and attenuation of the first compressive pulse are observed. Source: Ref 7
Low-Velocity Impact Testing / 547 states may be achieved. For small angles of inclination, small shear stresses are produced, which can be used to probe the damage induced by the accompanying pressure. This pressure-shear plate impact experiment was modified by Ramesh and Clifton (Ref 6) to study the elastohydrodynamic lubricant response at very high strain rates. The idea of recovery pressure-shear plate impact experiment was presented by Nemat-Nasser et al. (Ref 40), Espinosa (Ref 41), and Yadav et al. (Ref 65) and was first successfully implemented to study the response and failure modes of alumina ceramics by Machcha and Nemat-Nasser (Ref 16) and later by Espinosa et al. (Ref 17–19, 52) in their studies of dynamic friction and failure of brittle materials. Wave Propagation Analysis. The Lagrangian time-distance (t-X) diagrams for pressure-shear high-strain-rate and wave propagation configurations, designed for specimen recovery, are shown in Fig. 6(b) and 7(b). In the case of pressure-shear high-strain-rate experiments, the specimen is a thin wafer, 100 to 500 µm thick, sandwiched between two anvil plates. At impact, plane compression waves and shear waves are produced in both the impactor and the target. Since the shear wave velocity is approximately half the longitudinal wave velocity, a thin film with very low shear resistance needs to be added to the flyer plate such that the arrival of the unloading shear wave, to the impact surface, precedes the arrival of the unloading longitudinal wave generated at the back surface of the second flyer plate. The longitudinal and shear wave fronts arriving to the anvil-free surface are shown in Fig. 6(b). These wave fronts determine the longitudinal and shear windows measured interferometrically. These velocity histories contain information on the sample stress history as discussed in the next paragraph. A similar wave analysis applies to the wave propagation pressure-shear configuration (Fig. 7b). According to one-dimensional elastic wave theory (Ref 5), the normal stress is given by σ = ρc1 u0/2, in which ρc1 is the flyer and anvil longitudinal impedance, and u 0 is the normal component of the impact velocity V (i.e., u0 = V cos θ). The strain rate is given by the velocity difference between the two faces of the sample divided by its thickness (i.e., λ& = (vf − va ) / h = (v0 − vfs ) / h), where vf and va are the flyer and anvil transverse velocities, respectively, at their interfaces with the specimen, and v0=V sin θ and vfs are, respectively, the transverse components of the impact velocity and the velocity of the free surface of the anvil plate. The integration of the strain rate over time gives the shear strain γ(t). One-dimensional elastic wave theory can be used again to express the shear stress in terms of the measured free surface transverse velocity (i.e., τ = ρc2vfs/2), where ρc2 is the anvil shear impedance. These equations can be used to construct τ − γ curves at strain rates as high as 1 × 10⁵ s−1 and pressures in the range of 2 to 5 GPa (290 to 725 ksi). It must be emphasized that this analy-
sis is based on the assumption that inelasticity takes place only in the specimen. An investigation of this requirement at high strain rate and temperatures can be found in Ref 42. Numerical simulations have been performed by Machcha and Nemat-Nasser (Ref 23) for the pressure-shear recovery experiments. The results confirm the advantages of the star-shaped geometry. Machcha and Nemat-Nasser positioned the star-shaped flyer as a second flyer plate, which does not fully mitigate lateral release waves, in the central portion of the sample. Espinosa and coworkers (Ref 18, 19) positioned the star-shaped flyer plate as the first plate of the multiplate flyer assembly. The selection of materials for the manufacturing of flyer plates depends on the application for which experiments are conducted. In the characterization of hard materials, demanding requirements are placed on the manufacturing of flyer and momentum-trap plates. These plates must be hard enough in compression and shear to remain elastic at the high stress levels required for the inelastic deformation of the specimen. The momentum trap must be strong enough in tension to prevent failure at 45° when the shear wave propagates through the unloaded region adjacent to the rear surface of the momentum trap. These requirements are met by using Speed Star (Carpenter Technology Corp.—Specialty Alloys, Reading, PA) steel plates with a 0.2% offset yield stress greater than 2200 MPa (320 ksi) in shear and a tensile strength in excess of 1500 MPa (220 ksi). Another important feature in the selection of the flyer material is that its longitudinal and shear impedances must be smaller or equal to those of the specimen. In this way, a single compression-shear pulse is introduced in the sample. Moreover, the longitudinal and shear impedances of the momentum-trap plate must match the impedances of the sample to avoid wave reflections at the specimen momentumtrap interface. Density, wave speeds, and impedances for the materials used in this investigation are reported in Table 3. Experimental Procedure. The 76 mm (3.0 in.) gas gun described in the section “Plate Impact Facility” was used. The multiplate flyer and target plates were made of Speed Star steel. The specimens were made with two types of ceramics. In the high-strain-rate pressure-shear experiment, an Al2O3/SiC nanocomposite wafer was used. TiB2 plates were employed in the wave propagation pressure-shear experiments. In the latter case, two specimen configurations were investigated. The first one consisted of a square specimen with the same dimensions as the star-shaped flyer. The second configuration consisted of a hollow square steel plate in which a TiB2 ceramic rod 12.7 mm (0.5 in.) in diameter was shrunk fitted. The target rear surface was polished, and then a thin layer of positive photoresist was deposited using a spinning machine. A holographic phase grating was constructed by interference of two laser beams. The angle between the beams was selected such that a sinusoidal
profile with 1000 lines/mm was obtained. This grating was used to measure the normal and transverse displacements by means of a variable sensitivity displacement interferometer (VSDI) (Ref 52). The signals generated by each interfering beam pair were monitored by silicon photodetectors. Experimental Results. A summary of these experiments is presented in Table 4. The normal velocity-time profile obtained from the high-strain-rate pressure-shear recovery configuration is shown in Fig. 9(a). The normal particle velocity shows a velocity reduction after an initial jump indicating the presence of a small gap between the Al2O3/SiC nanocomposite and the multiplate flyer. Upon reverberation of waves within the specimen, the normal velocity rises to a value of about 140 m/s (460 ft/s) at approximately 0.4 µs and remains almost constant until release waves from the boundary reach the observation point. The peak normal stress in this shot, computed according to σ = ρc1ufs/2, reaches 3.45 GPa (500 ksi). The transverse particle velocity history for this experiment is shown in Fig. 9(b). The velocity rises progressively and then drops for a few nanoseconds. Since in this experiment, shear motion is transferred by friction, a reduction in normal traction at the specimen-steel plate interface results in a drop of the transmitted shear motion. When the gap closes, the transverse velocity increases until it reaches a maximum value of 22 m/s (72 ft/s) at about 500 ns. It then decays continuously while the normal velocity remains constant (Fig. 9a). The maximum shear stress, given by τ = ρc2vfs/2, is 280 MPa (41 ksi). This value is well below the expected shear stress of 575 MPa (83 ksi), assuming elastic material response. The progressive reduction in anvil-free surface transverse velocity implies a variable strain rate and absence of a homogeneous stress state in the sample. In this experiment, round plates were used and the sample was precracked through a sequence of microindentations in a diameter of 38 mm (1.5 in.) Lateral trapping of release waves was attempted by forming a circular crack with the unloaded sample in the central region. Despite these efforts, the degree of damage was severe enough that the ceramic sample was reduced to fine powder upon unloading. This feature of material pulverization upon unloading was investigated by Zavattieri et al. (Ref 22) by simulating compression-shear loading on represen-
Table 3 Properties of materials used in pressure-shear impact recovery experiments
Material
Speed-Star Steel TiB2 Al2O3/SiC Source: Ref 19
Density, kg/m3
8138 4452 3890
Wave speed, mm/µs c1 c2
5.852 10.93 10.56
Impedance, GPa · mm/µs ρc1 ρc2
3.128
47.62
25.46
7.3 6.24
48.66 41.08
32.5 24.27
548 / High Strain Rate Testing Table 4
Summary of parameters for pressure-shear recovery experiments
Shot No.
Specimen
7-1025 7-1115 8-0131
Al2O3/SiC TiB2 TiB2
Specimen thickness mm in.
0.54 4.15 8.9
Impactor thickness mm in.
0.021 0.163 0.35
2.42–3.65 1.04–2.55 0.92–3.0
Target thickness mm in.
0.095–0.144 0.041–0.100 0.036–0.12
7.99 4.53 4.05
Projectile velocity m/s ft/s
0.31 0.18 0.16
148 130 133
486 427 436
Tilt, mrad
Configuration
1.3 20.3 1.32
High strain-rate recovery Wave propagation recovery Wave propagation recovery
Source: Ref 19
tative volume elements at the grain level. These investigators show that a ceramic microstructure containing a dilute set of microcracks may pulverize in unloading due to the stored elastic energy within the grains. In the case of the wave propagation pressure-shear recovery configuration, round and square-shaped TiB2 plate specimens were used. The longitudinal and shear waves recorded in the case of the square-shaped TiB2 specimen are shown in Fig. 10(a) and (b), respectively. The velocity profile in the first microsecond is shown in solid lines, while the remaining part of the signal is shown in dashed lines. Figure 10(a) shows the normal velocity rises to a value predicted by one-dimensional elastic wave theory. After approximately 200 ns, the longitudinal particle velocity progressively decays and
then rises again at approximately 500 ns. This longitudinal velocity history is very close to the one-dimensional elastic wave propagation prediction if the effect of spherical waves emanating from the star-shaped flyer corners is taken into account (Ref 13). Another source of stress decay is the presence of a thin polymer layer in the multiplate flyer. As previously discussed, longitudinal stress decay occurs until a homogeneous deformation state is reached in the polymer film. The transverse particle velocity shown in Fig. 10(b) also presents clear features. Upon wave arrival to the back surface of the momentum-trap plate, an in-plane velocity of about 10 m/s (33 ft/s) is measured interferometrically. After shear wave arrival, according to the t-X diagram discussed previously, the transverse velocity rises to a maximum of 38
24 22
160 140
20
Transverse velocity, m/s
Normal velocity, m/s
120 100 80 60 40 20 0 0
0.5
(a)
1 Time, µs
1.5
2
18 16 14 12 10 8
Pressure-Shear Friction Experiments
6 4 2 0 0
0.5
(b)
Time, µs
1
1.5
Velocity histories from a pressure-shear high-strain-rate experiment (shot No. 7-1025 in Table 4). (a) Normal velocity history. The time scale starts with the arrival of the longitudinal wave to the anvil-free surface. (b) Transverse velocity history. The time scale starts with the arrival of the shear wave to the anvil-free surface. Source: Ref 18, 19
Fig. 9
Transverse velocity, m/s
Normal velocity, m/s
250 200 150 100 50
(a)
This technique was originally introduced by Prakash and Clifton (Ref 66). Its main objective was to investigate time-resolved friction at slipping speeds (5 to 30 m/s, or 16 to 98 ft/s) and pressures (1 to 3 GPa, or 145 to 435 ksi) typical of high-speed machining processes. As discussed in Ref 66, the technique can be easily interpreted within the one-dimensional wave propagation theory. By using characteristic equations it can be shown that the shear and
40
300
0
m/s (125 ft/s). This value is below the shear wave velocity predicted by one-dimensional wave propagation theory. Hence, the material clearly exhibits an inelastic behavior in shear. At approximately 800 ns, the transverse velocity decays progressively. Understanding these complex velocity histories requires complete three-dimensional simulations of the compression-shear experiment including damage and tilt effects. In this experiment, the steel plates are fully recovered. In contrast to the shrink-fitted specimen, the ceramic specimen is fragmented with varying fragment sizes (Fig. 11). The larger fragment is several millimeters in size, but its location in the square plate could not be identified unambiguously. In this case, the star-shaped flyer also is fragmented in the central region. In addition, long cracks are observed running parallel to the edges. Severe indentation is observed in the second flyer plate, although its hardness was measured to be 55 HRC. In this configuration, the momentum-trap plate remains intact with no cracks observable to the naked eye. Additional details can be found in Ref 18 and 19.
Shear wave arrival
30 20 10 0
0
0.25
0.5 Time, µs
0.75
1
0 (b)
0.25
0.5 Time, µs
0.75
1
Velocity histories from a pressure-shear wave propagation experiment (shot No. 8-0131 in Table 4). (a) Normal velocity history. The time scale starts with the arrival of the longitudinal wave to the momentum-trap-free surface. (b) Transverse velocity history. The time scale starts with the arrival of the shear wave to the momentum-trap-free surface. Source: Ref 19
Fig. 10
Low-Velocity Impact Testing / 549
(b)
(d)
(c)
Optical micrograph of recovered plates from a pressure-shear wave propagation experiment (shot No. 8-0131 in Table 4). (a) Second flyer plate. (b) Back momentum-trap plate. (c) Star-shaped flyer plate. (d) Fragmented specimen. Source: Ref 19
Fig. 11
normal stresses at the sliding interface are given by: τ(t) = 0.5(ρc2)tvfs(t) σ(t) = 0.5(ρc1)tufs(t)
in which (ρ)t is the target material density, (c1)t and (c2)t are the longitudinal and shear wave velocities of the target material, and vfs and ufs are the shear and longitudinal free-surface velocities interferometrically measured. Furthermore, the slipping velocity is given by: (ρc ) + (ρc 2 ) f Vslip = V sin θ − 2 t 2 (ρc 2 ) f
v fs
The friction coefficient is obtained by the ratio τ(t)/σ(t). More details about the derivation of these formulas can be found in Ref 67. 150
3.5
2.0 1.5
2 1
1.0
0
Transverse velocity, m/s
2.5
–2 1.4000E-5 1.6000E-5 1.8000E-5 1.5000E-5 1.7000E-5 1.9000E-5
0 1000
2000
Shear wave release 150 10
Fig. 12
100
2 1 0
5
50
–1
0.5
–2
0 3000
1.5000E-5 1.6000E-5 1.7000E-5 1.8000E-5 1.5500E-5 1.6500E-5 1.7500E-5
0 0
Time, ns (a)
200
15
–1
0
250
3.0
100
50
20
Normal stress, GPa
Normal velocity, m/s
Wave reverberation at thin film
of 450 MHz in an NDI, while in the VSDI system, a much smaller frequency is recorded. In Fig. 12(b) the transverse velocity history and the TDI amplitude corrected signal are shown. A transverse velocity well below the impact shear velocity is measured, indicating interface sliding. Small fluctuations in the transverse velocity are due in part to errors in data reduction arising from the insensitivity of the TDI at the peaks and valleys of the trace (Ref 7). An in-plane wave release is observed at approximately 2 µs. This wave release is in agreement with the wave release predicted by one-dimensional elastic wave theory. It should be noted that the reduction in in-plane motion is progressive. A residual transverse velocity of 5 m/s (16 ft/s) is recorded, likely due to the shear resistance of the thin polymer film used in the multiplate flyer. Modeling of the experiment, including the frictional behavior of the steel interface and the nonlinear behavior of the polymer thin film, is required to fully interpret the transverse velocity history. Further evidence on the shear wave duration can be observed in Fig. 13 in which an optical micrograph shows sliding marks, approximately 50 µm in length. From the transverse velocity history, an average sliding velocity of 26 m/s (85 ft/s) is computed. This velocity during 2 µs leads to a sliding length of 52 µm, which correlates very well with the sliding marks observed on the micrographs. Prakash and Clifton (Ref 66) and Prakash (Ref 67) reported dynamic friction coefficients for various tribopairs, namely, WC/4340 steel and WC/Ti-6Al-4V. This work was later extended by Rajagopalan et al. (Ref 68) concerning the estimate of temperature histories in the two plates. Pressure-shear friction experiments on preheated target plates were conducted by Frutschy and Clifton (Ref 69). In their work, the friction phenomenon is investigated at high temperatures. Additional insight into the dynamic friction experimental technique can be found in these references.
(b)
Shear stress, MPa
(a)
The pressure-shear friction experimental technique discussed in this section is an extension of the technique introduced by Prakash and Clifton (Ref 66) in the sense that the experiment is designed for specimen recovery. Here, the specimen is the interface formed after impact by the flyer and target plates rather than the thin specimen shown in Fig. 6. Certainly, a coating may be deposited on the flyer and/or the target plates to examine its frictional properties under pressure and sliding velocities typical of manufacturing processes or ballistic penetration events. The preparation of the plates, assembly of the target, and alignment follow the procedures outlined in the section “Specimen Preparation and Alignment” in this article. In an experiment reported in Ref 52, 4340 steel tribopair was used. Typical VSDI signals obtained in these experiments are shown in Fig. 12(a) and (b). In Fig. 12(a), the normal freesurface velocity history is plotted together with the Θ− VSDI amplitude corrected signal. Upon arrival of the longitudinal wave to the target-free surface, the normal velocity exhibits an increase in velocity to a level of approximately 80 m/s (260 ft/s) followed by a reduction and increase in velocity due to wave reverberations in the thin polymer layer used in the multiplate flyer. A few bumps are observed in the first 900 ns of the normal velocity history. These variations in normal velocity are likely the result of the low signal-to-noise ratio in the early part of the record (Fig. 12a). They are also due in part to errors in data reduction arising from the insensitivity of the displacement interferometer at the peaks and valleys of the trace (Ref 7). Experience suggests that signals with higher frequencies are less sensitive to errors caused by signal noise. The noise level can be observed in the part of the record preceding the longitudinal wave arrival. In later experiments, the angle θ used in the Θ− VSDI has been increased with good results. An approximately constant velocity of 115 m/s (377 ft/s) is monitored in the next 1.8 µs, which is in agreement with the elastic prediction. It should be noted that this normal velocity would lead to a frequency
500
1000
1500 2000 Time, ns
2500
0 3000
Particle velocity-time profiles for a dynamic friction recovery experiment. (a) Normal profile; impact velocity, 125 m/s (410 ft/s). The inset shows the Θ− VSDI trace after amplitude correction. (b) Transverse profile; impact shear velocity, 38.62 m/s (126.7 ft/s). The inset shows the TDI trace after amplitude correction. Source: Ref 52
550 / High Strain Rate Testing
High-Temperature Plate Impact Testing Understanding materials response at high temperatures and high strain rates is essential to the development of constitutive models describing dynamic failure of advanced materials. Such models are of crucial importance to many applications, for example, crack arrest in engineering structures, failure of turbine engine blades, foreign object impact on satellites, automotive crashworthiness, and military applications such as projectile deformation and armor penetration. Current understanding of basic properties such as plastic flow and dynamic fracture strength in the high-temperature and high-strain-rate regime is very limited. This is due to the scarcity of experimental studies with the needed spatial and temporal resolution to identify damage and failure mechanisms. It has been shown that high strain rates increase the yield stress in metals (Ref 70–73), whereas it is generally accepted that a rise in temperature tends to reduce the resistance to flow by lowering activation barriers associated with the atomic mechanisms of deformation (Ref 74–77). When a metallic material is subjected to dynamic and high-temperature loading, a competition process between work hardening (resulting from the production, motion, and interaction of dislocations and other defects) and thermal softening occurs. Extensive research on the stress-strain temperature-dependent behavior in many body-centered cubic and face-centered cubic metals has been carried out (Ref 78–81). These results show that temperature has a much greater effect on material strength than strain rate if the deformation is performed under both high-strain-rate and hightemperature conditions. Even though inelastic mechanisms at high strain rates are not completely understood, researchers agree on the definition of the Hugoniot elastic limit (HEL) as the axial stress, under
one-dimensional strain, leading to the onset of material inelasticity. Hence, the evolution of the HEL or its equivalent, the dynamic yield stress, with temperature can be identified by means of normal impact high-temperature experiments. Frutschy and Clifton (Ref 42) carried out pioneer work on the temperature and rate dependence of the dynamic yield stress in oxygen-free high-conductivity copper. Instead of the normal impact experiment described, they performed pressure-shear high-temperature experiments. Simultaneous nucleation, growth, and coalescence of microvoids or microcracks govern the spall process in advanced materials. Thermal energy plays an important role in the deformation mechanisms leading to strain inhomogeneities that drive the failure process. Limited experimental work exists to define the role of thermal activation on spall behavior of materials. Recently, studies from Kanel et al. (Ref 82) and Golubev and Sobolev (Ref 83) on aluminum and magnesium have been published. It has been found that spall strength drops with temperature, but no further investigations have been carried out to establish the role of the microstructure in the spallation process. This section describes the experimental technique developed for shock impact testing at high temperature and reports the variation of HEL and spallation with temperature in Ti-6Al-4V. Microstructural analyses that provide insight into the deformation mechanisms of high-temperature-shocked materials are reported in Ref 44 and 84. Wave Propagation Analysis for HEL and Spallation Identification. The Dynamic Inelasticity Laboratory described in the section “Plate Impact Facility” in this article possesses the instrumentation to perform planar impact
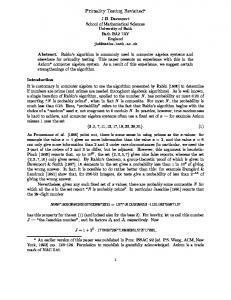
experiments at different temperatures. The setup is similar to the one developed by Frutschy and Clifton (Ref 42, 43) for pressure-shear impact experiments. The selected experimental configuration is a symmetric planar impact or spall configuration (Fig. 14a). The elastic wave fronts and their interaction can be understood by examining the Lagrangian (t-X) diagram shown in Fig. 14(b). At impact, plane compression waves are produced in both the flyer and the specimen (state 1). Reflection from the foam-flyer interface unloads almost completely the compressive wave, resulting in a compressive pulse duration equal to the round-trip travel time through the flyer thickness. When the compressive pulse reaches the rear surface of the specimen, a reflected wave is generated. This wave unloads the compressive pulse (state 2). Tensile stresses are generated when the two unloading waves, one from the flyer and the other from the specimen back surface, meet in the central part of the specimen (state 3). By the time this pulse reaches the flyer-specimen interface, separation takes place and the pulse reflection causes further compressive stresses (state 4). For the experiments reported in this subsection, the thickness of the targets was close to 8 mm (0.3 in.) for all specimens with a corresponding half thickness for the flyers. Hence, the spall plane was located near the middle of the target plate. The impact velocity range was selected such that the lowest velocity was enough to induce dynamic yield in Ti-6Al-4V (about 900 MPa, or 130 ksi, according to Ref 85), whereas the highest velocity would induce spallation. Experimental Procedure. The experimental procedure follows the technique discussed in the section “Specimen Preparation and Alignment.”
Spall region
t
Ti-6Al-4V flyer plate
PVC holder
State 4
Normal motion State 3 Impact direction
State 2 Ti-6Al-4V target plate
State 1
x Flyer
Backing foam
Optical micrograph of impact surface from recovered flyer plate. Sliding marks approximately 50 µm in length are observed. Source: Ref 52
Fig.13
(a)
Fig. 14
Target
(b)
High-temperature spall experiments. (a) Impact configuration. (b) Lagrangian t-X diagram of spall configuration. Source: Ref 44
Low-Velocity Impact Testing / 551 Something unique to the high-temperature target setup is the assembly of the target plate to the target holder. The Ti-6Al-4V sample is placed hand tight inside a graphite susceptor and glued using high-temperature epoxy. The two pieces together are slipped into a ceramic-foam sleeve that fits inside the coil shown in Fig. 2 and 3. The sleeve is firmly attached by high-temperature epoxy and four ceramic pins to the surrounding copper coil. The induction heating process generates a temperature gradient in the sample. In fact, the induced currents tend to stay on the surface of the specimen, generating more heat at the surface than in the bulk of the material (Ref 86). Titanium alloys have low thermal conductivity; therefore, the heating gradient can be important. A reduction in the coil diameter generates a denser electromagnetic field that can penetrate the shield generated by the induced currents, achieving a more homogeneous heating (Ref 86). A more practical approach is to employ a material with high electrical conductivity and heat thermal capacity to hold the target and minimize transient time. The graphite susceptor shown in Fig. 2 is introduced in the developed setup with this aim. Temperature is measured by a thermocouple attached to the rear face of the specimen, as close as possible to the center point. The high velocities required in this study generated a strong shock wave within the target chamber upon the exit of the projectile from the launch tube. To protect the high-temperature assembly, an extension was added to the gun barrel. Following aerodynamic considerations, the extension was designed to keep the hightemperature target assembly outside of the gas-flow cone emanating from the end of the gun barrel. An exploded view of the described experimental assembly is presented in Fig. 15. The assembly and alignment of the plates and the measurement of projectile velocity follow the techniques described in the section “Specimen Preparation and Alignment.” A disposable mirror is suspended at a certain distance from the rear face of the specimen to allow the laser beam to monitor the motion of the rear surface of the specimen. The target chamber has a side window to provide access for the laser beam that is used in the air-delayleg normal velocity interferometer for any reflecting surface (ADL-VISAR) (Ref 44) depicted in Fig. 16. To avoid overheating of the mirror employed to collect light for the interferometer, a ceramic foam is used to close the ceramic sleeve that contains the target (Fig. 2). A small hole is drilled on the center of the cup, and the laser light is sent in and collected back through it. Tested Material. Details on the hot-rolled commercial grade plates Ti-6Al-4V, its chemical composition, and metallographic examination of the as-received plates can be found in Ref 44. It is interesting to point out the high interstitial oxygen content (0.18%) and grain elongation in the rolling direction. The target and flyer plates were all machined from the
room temperature, the longitudinal wave speed, ultrasonically measured, is cL = 6232 m/s (20,446 ft/s), and the material density is 4430
as-received plates in such a way that the impact axis was perpendicular to the rolling direction. The hardness was measured to be 35.6 HRC. At
Back Piston Fiber-glass tube PVC Holder Target Ceramic pin
Gun barrel extension
Induction Coil Key
Cup
Foam Flyer Graphite susceptor Ceramic sleeve
Fig. 15
Exploded view of gas gun extension. Source: Ref 44 Beam expander Mirror
Argon ion laser Retroreflector M1 λ/2 PBS
Beam splitter
PBS-1
A′(t ) P
λ/4
S
PBS-2
B′(t ) Intensity monitoring beam
Lens 1 M3′
Differential amplifier
M2
P A(t ) Lens 2
S
B(t )
Differential amplifier
M3 Retroreflector/PZT
Signals Oscilloscope Vacuum chamber Breech
Lens
Mirror
Projectile and flyer
Vacuum pump Trigger signal Velocity measurement (oscilloscope)
Fig. 16
Schematic of ADL-VISAR interferometer. Source: Ref 87
High pressure gas tank
552 / High Strain Rate Testing kg/m3; therefore, the acoustic impedance is 27.608 GPa/mm/µs. Experimental Results. A summary of performed high-temperature impact experiments is presented in Tables 5 and 6. A first experiment, 98-0924, was performed to have a reference of the material behavior at room temperature. Its time-velocity history is shown in Fig. 17. As can be observed in this figure, the elastic precursor in this experiment was lost due to the Table 5
low velocity per fringe (18.75 m/s, or 62 ft/s) employed in the interferometer. Twelve fringes were added to the fringe count to match the boundary conditions (Ref 49). The velocity jump corresponding to the HEL is 200.5 m/s (657.8 ft/s) in good agreement with the 201 m/s (659 ft/s) reported in Ref 88. The transition between elastic-plastic behavior is clearly captured; there is a sharp elastic unloading followed by a dispersive unloading
Summary of parameters for high-temperature impact experiments
Shot No.
Impactor thickness mm in.
Target thickness mm in.
Impact velocity m/s ft/s
Normal stress GPa ksi
T98-0924 T98-1210 T99-0602 T99-1008
3.60 3.51 3.32 3.61
7.6 7.79 6.69 6.795
251 272 417 594
3.46 3.56 5.44 7.45
0.142 0.138 0.131 0.142
0.30 0.307 0.263 0.268
823 892 1368 1949
506 516 789 1080
Source: Ref 44, 84
Table 6
Summary of results for high-temperature impact experiments
Shot No.
Preheat temperature °C °F
T98-0924 T98-1210 T99-0602 T99-1008
22 298 315 513
72 568 599 955
Strain rate, s–1 × 10⁵
Transient strain
1.47 1.61 2.27 3.26
0.0135 0.0153 0.0239 0.0356
Dynamic yield stress MPa ksi
Hugoniot elastic limit GPa ksi
2.77 2.11 2.105 1.98
402 306 305 287
1402 917 914 858
203.3 133.0 132.6 124.4
Spall strength GPa ksi
5.10(a) … 4.47 4.30
740(a) … 648 624
(a) Reported in the literature
600
220
8
Velocity, m/s
200
500
180
7
160 140 120
6
0.01 0.02 0.03 0.04 0.05 Time, µs
99-1008 T: 513 °C
5
300
4 99-0602 T: 315 °C 3
200 2 98-0924 T: 22 °C
100
1 98-1210 T: 298 °C 0
0 0
1
2
3
4
Time, µs
Fig. 17
Velocity histories of normal high-temperature impact experiments. Source: Ref 44, 84
5
Stress, GPa
Free surface velocity, m/s
400
0
tail. The dispersion in the unloading tail is due to the severe plastic deformation the material underwent in the loading phase. The reloading pulse that is generated by the reflection at the flyer-specimen interface is greatly reduced with respect to the expected elastic behavior. Even though some hardening is expected due to the passage of the first loading pulse, the hardening must appear as a change in the slope of the second loading pulse instead of the observed attenuation. The attenuation indicates that part of the energy is dissipated in the form of shock-induced damage at the applied stress level. Note that no spall signal is observed in the free-surface velocity record. Hence, the stress-pulse attenuation is indicative of damage initiation without the formation of a spall region within the sample. This was confirmed by scanning electron microscopy (SEM) studies performed on the recovered samples. Microvoids at the α−β interface were observed through the thickness of the target plate. Details can be found in Ref 44. An interesting feature of experiment 98-0924 is the oscillation of the velocity profile close to the end of the first unloading. Mescheryakov et al. (Ref 89) reported that oscillations in their VISAR signal appeared to indicate a shockinduced phase transformation in Ti-6Al-4V. Their post-test SEM studies performed over samples recovered right after the experiment in a water chamber presented evidence of an ω residual phase in the microstructure. The setup for this experiment did not allow for cooling the samples right after impact, but the similarity with Mescheryakov et al. (Ref 89) in the interferometric records indicates the presence of a shock-induced phase transformation in Ti-6Al-4V. The stress level for the transformation is 2.17 GPa (315 ksi), close to ω-start pressure reported by Vohra et al. (Ref 90) but lower than the phase transition reported by Mescheryako, 2.95 GPa (428 ksi). The direct transformation is not observed because it is overcome by the elastic wave. A second experiment, 98-1210, performed at 298 °C (568 °F) shows the effect of temperature on damage kinetics at similar stress and strain rate levels. The elastic precursor is also lost in this experiment; several fringes were added to match boundary conditions. A higher plastic deformation expected at high temperature makes the slope of the plastic wave more pronounced, as can be observed in Fig. 17. The smoothness of the velocity profile shows a progressive deformation of the free surface, which is a clear indication of high plastic deformation within the target plate. The velocity jump corresponding to the HEL is lower, 166 m/s (545 ft/s), showing a decrease in the dynamic yield stress with temperature. The so-called precursor decay is also more pronounced due to the increased rate of plastic deformation. In this experiment, the temperature rise was estimated to be 17 °C (31 °F), giving a final temperature of 315 °C (600 °F) well below the β-transus temperature range for Ti-6Al-4V (570–650 °C, or 1060 to 1200 °F). No evidence of shock-in-
Low-Velocity Impact Testing / 553 duced phase transition appears in this experiment (see first unloading in Fig. 17). Experiment 99-0602 was carried out at 315 °C (600 °F). This temperature is close to the temperature in experiment 98-1210, but the impact velocity is higher. For this experiment the interferometer was modified to a higher velocity per fringe, 95.1 m/s (312 ft/s). Even though a shorter delay leg was used, part of the elastic precursor overcame the recording system, and one fringe needed to be added to match the boundary conditions. According to the velocity profile shown in Fig. 17, the velocity jump corresponding to the HEL coincides with the one in experiment 98-1210 (same temperature). The plastic wave slope is higher, indicating a stronger hardening due to the higher inelastic strain rate. The unloading is dispersive and shows again the reverse-phase transformation. Between the first and second loading pulse, a clear spall signal appears. Spallation occurs at a lower stress than the one reported by other investigators (e.g., Ref 91). Some researchers attribute this to an incomplete fracture at the spall plane. There are several approaches to calculate spall strength. For consistency with results reported in the literature, for other metallic materials, the approach stated by Kanel et al. (Ref 82) is employed. Such an approach establishes the spall strength for a symmetric impact, according to 0.5 ρC0∆V, where ∆V is the velocity drop from the peak velocity to the spall signal. According to this equation, experiment 99-0602 presents spall strength of 4.47 GPa (648 ksi). This value represents a reduction of ~10% from the value of 5.1 GPa (740 ksi) at room temperature, reported in Ref 88 and 91. The reduction in spall strength with temperature was previously reported by Kanel et al. (Ref 82) in magnesium and aluminum. Oscillations in the free-surface velocity profile during unloading again indicate the phase transition ω→α. This phase transition happens at a compressive stress level of approximately 2.25 GPa (434 ksi), slightly higher than the phase transition at room temperature. The temperature rise was estimated to be 40 °C (72 °F), giving a final temperature of 351 °C (664 °F). As in the previous case, the final temperature is well below the β-transus; hence, allotropic transformations were not likely to occur. To further explore the spall behavior, experiment 99-1008 was carried out at a temperature close to the limit of applicability of Ti-6Al-4V, that is, ~500 °C (930 °F). The impact velocity was set to about 590 m/s (1935 ft/s) to ensure a clear spallation process. The velocity per fringe in the interferometer was 97.2 m/s (318.9 ft/s), resulting in a partial loss of the elastic precursor as in experiment 98-1210. The free-surface velocity profile for this last experiment is shown in Fig. 17. A consistent reduction of the HEL with temperature can be observed. The plastic wave slope is steeper than in the other discussed experiments, indicating an even stronger hardening. A Hugoniot state is clearly achieved followed by a dispersive unloading pulse as in previous experiments. The overall
wave profile is smooth, indicating a progressive deformation when the wave travels through the target. Between the expected first and second loading pulses, a fast-rising pull-back signal and clear spallation signal appear, which indicates the formation of a well-defined spall fracture plane. The higher rate of velocity increase during spallation is evidence that the fracture process is more violent than the one in experiment 99-0602. In fact, the recovered target was split into two pieces (Ref 44). Using the approach developed by Kanel et al. (Ref 82), the spall strength was estimated at 4.30 GPa (624 ksi). This indicates a reduction of 5% in the spall strength with an increment of ~200 °C (360 °F). The decrease in spall strength is in agreement with the results reported in Ref 82 for magnesium and aluminum. The inverse shock phase transformation α − ω was not present in this experiment. The spall signal rings at a higher stress than the level corresponding to the inverse shock transformation previously observed. Therefore, it is not possible to conclude whether the increase of the peak shock stress can trigger the inverse shock transformation despite the increase in temperature. The temperature rise for this experiment was estimated to be 81 °C (146 °F), resulting in a final temperature of 593 °C (1100 °F). The final value is close to the β-transus temperature. Thermomechanical properties change with allotropic transformations in Ti-6Al-4V (Ref 92). A comprehensive microscopy study on the failure and damage modes of Ti-6Al-4V as a function of temperature can be found in Ref 44 and 84.
Impact Techniques with In-Material Stress and Velocity Measurements Several research efforts have been made for in-material measurements of longitudinal and shear waves in dynamically loaded solids. Successful experiments where velocity histories have been obtained at interior surfaces by inserting metallic gages in a magnetic field and measuring the current generated by their motion have been reported (Ref 93–95); these gages are called electromagnetic particle velocity (EMV) gages. This technique can be applied only to nonmetallic materials. Another technique developed for in-material measurements employs manganin gages placed between the specimen and a back plate to measure the time history of the longitudinal stress, or by placing a manganin gage at an interface made in the direction of wave propagation to measure lateral stresses (Ref 96, 97). In this configuration, the dynamic shear resistance of the material can be obtained by simultaneously measuring the axial and lateral stresses. An alternative technique for the in-material measurement of the dynamic shear resistance of materials is the use of oblique impact with the specimen backed by a window plate (Ref 56). In this technique, longitudinal and shear
wave motions are recorded by a combined normal displacement interferometer (NDI) or a normal velocity interferometer (NVI) (Ref 48) and a transverse displacement interferometer (TDI) (Ref 50). Alternatively, the VSDI interferometer previously discussed can be used. The velocity measurements are accomplished by manufacturing a high-pitch diffraction grating at the specimen-window interface (Ref 56). In-Material Stress Measurements with Embedded Piezoresistant Gages. Many materials exhibit a change in electrical resistivity as a function of both pressure and temperature. Manganin, an alloy with 24 wt% Cu, 12 wt% Mn, and 4 wt% Ni, was first used as a pressure transducer in a hydrostatic apparatus by Bridgman in 1911 (Ref 98). Manganin is a good pressure transducer because it is much more sensitive to pressure than it is to temperature changes. Impact experiments performed by Bernstein and Keough (Ref 99) and DeCarli et al. (Ref 100) showed a linear relationship between axial stress σ1, in the direction of wave propagation, and resistance change; namely, σ1=∆R/kR0 in which R0 is the initial resistance and k is the piezoresistance coefficient. For manganin, DeCarli et al. (Ref 100) found k = 2.5 × 10⁻² GPa−1. The value of this coefficient is a function of the gage alloy composition; therefore, a calibration is required. Manganin gages are well suited for stress measurements above 4 GPa (580 ksi) and up to 100 GPa (15 × 106 psi). At lower stresses, carbon and ytterbium have a higher-pressure sensitivity (Ref 101), resulting in larger resistance changes and, hence, more accurate measurements. Carbon gages can be accurately used up to pressures of 2 GPa (290 ksi), while ytterbium can be used up to pressures of 4 GPa (580 ksi). In plate impact experiments, the gage element is usually embedded between plates to measure either longitudinal or transverse axial stresses. A schematic of the experimental configuration is shown in Fig. 18. If the gage is placed between conductive materials, it needs to be electrically insulated by packaging the gage using polyester film, mica, or polytetrafluoroethylene. Another reason for using a gage package is to provide additional protection in the case of brittle materials undergoing fracture. Through the use of metallic leads, the gage is connected to a power supply that energizes the gage prior to the test. The power supply comprises a capacitor that is charged to a selected voltage and discharged upon command into a bridge network by the action of a timer and a power transistor. The current pulse that is delivered to the bridge is quasi-rectangular with duration between 100 and 800 µs. The bridge network is basically a Wheatstone bridge that is externally completed by the gage. The gage, which is nominally 50 Ω, is connected to the bridge with a 50 Ω coaxial cable. The reason for using a pulse excitation of the bridge, rather than a continuous excitation, is that such an approach permits high outputs without the need for signal amplification and avoids excessive
554 / High Strain Rate Testing
Flyer plate Target plate
By appropriate selection of the flyer-plate thickness, the plane at which tension occurs for the first time within the sample was located close to the impact surface or close to the specimen-PMMA interface. In experiment 7-0889, a 5.7 mm (0.22 in.) thick soda-lime glass target was impacted with a 3.9 mm (0.15 in.) aluminum flyer at a velocity of 906 m/s (2972 ft/s). The manganin gage profile is shown in Fig. 19. The spall plane in this experiment happened to be behind the failure wave. The profile shows the arrival of the compressive wave with a duration of approximately 1.5 µs, followed by a release to a stress of about 3 GPa (435 ksi) and a subsequent increase to a constant stress level of 3.4 GPa (493 ksi). The stress increase after release is the result of reflection of the tensile wave from material that is being damaged under dynamic tension and represents the dynamic tensile strength of the material (spall strength). From this trace, it was concluded that soda-lime glass shocked to a stress of 7.5 GPa (1088 ksi) has a spall strength of about 0.4 GPa (58 ksi) behind the so-called failure wave. The experiment was repeated with a 2.4 mm (0.09 in.) thick aluminum flyer (7-1533); the result was complete release from the back of the aluminum impactor (Fig. 19). A pull-back signal was observed after approximately 0.45 µs with a rise in stress of about 2.6 GPa (377 ksi). It should be noted that the spall plane in this experiment was in front of the failure wave. These two experiments clearly show that the spall strength of glass depends on the location of the spall plane with respect to the propagating failure wave. For soda-lime glass, a dynamic tensile strength of 2.6 and 0.4 GPa (377 and 58 ksi) was measured with manganin gages in front of and behind the failure wave, respectively. Dandekar and Beaulieu (Ref 104) obtained similar results using a VISAR. Additional features of the failure-wave phenomenon were obtained from transverse gage experiments performed on soda-lime and aluminosilicate glasses (Ref 24). In these experiments, one or two narrow 2 mm (0.08 in.) wide manganin gages (type C-8801113-B) were embedded in the glass target plates in the direction transverse to the shock direction as shown in Fig. 18. A thick back plate of the same glass
Longitudinal stress, GPa
8
Backing plate
Manganin gage experiment configuration. Gages G1 and G2 record transverse stress at two locations. Gage G3 records the longitudinal stress at the specimen back plate interface. Source: Ref 87
Low-Velocity Penetration Experiments In many ballistic impact tests, often only the incident and residual velocities are recorded. 6
Shot 7-1533
Shot 7-0889
6 Spall signal 4
2
Shot 7-1719 Front gage-G1 Shot 7-1717 Front gage-G1
4
0 0
2
4 Time, µs
6
Gage failure
Shot 7-1719 Back gage-G2
2
Failure wave arrival
Complete release
(a)
Fig. 18
was used in the target assembly. Aluminum or glass impactor plates were used to induce failure waves. The transverse stress, σ2, was obtained from the transverse gage record. Figure 19 shows measured transverse gage profile at two locations (shot 7-1719) in the aluminosilicate glass. The two-wave structure that results from the failure wave following the longitudinal elastic wave can clearly be seen. The first gage, at the impact surface, shows an increase in lateral stress to the value predicted by one-dimensional wave theory, 2.2 GPa (319 ksi) in Fig. 19, immediately followed by a continuous increase to a stress level of 4.2 GPa (609 ksi). The second gage, at 3 mm (0.12 in.) from the impact surface, initially measures a constant lateral stress of 2.2 GPa (319 ksi) followed by an increase in stress level on arrival and passage of the failure wave. It should be noted that the initial slope was measured by lateral gage G2. This can only be the case if the failure wave does not have an incubation time so the increase in lateral stress with the sweeping of the failure wave through the gage increases the initial slope in gage G1. By contrast, gage G2 sees the arrival of the failure wave about 700 ns after the arrival of the elastic wave (see step at 2.2 GPa). Furthermore, these traces also confirm that the failure wave initiates at the impact surface and propagates to the interior of the sample. This interpretation is in agreement with the impossibility of monitoring impact surface velocity with a VISAR system (Ref 104) when failure waves are present. The impact parameters used in these experiments are summarized in Table 7. Measured profiles of manganin gages were converted to stress-time profiles following the calibrations of longitudinal and transverse manganin gages under shock loading given in Ref 105 and 103, respectively.
Transverse stress, GPa
Joule heating effects that can result in gage failure. The bridge output is connected to an oscilloscope for the recording of voltage changes resulting from changes in resistance. The relation between voltage and resistance change is obtained by means of a calibration with a variable resistor. A concern with this technique is the perturbation of the one dimensionality of the wave propagation due to the presence of a thin layer, perpendicular to the wave front, filled with a material having a different impedance and mechanical response. Calculations by Wong and Gupta (Ref 102) show that the inelastic response of the material being studied affects the gage calibration. In 1994, Rosenberg and Brar (Ref 103) reported that in the elastic range of the gage material, its resistance change is a function of the specimen elastic moduli. In a general sense, this is a disadvantage in the lateral stress-gage concept. Nonetheless, their analysis shows that in the plastic range of the lateral gage response, a single calibration curve for all specimen materials exists. These findings provide a methodology for the appropriate interpretation of lateral gage signals and increase the reliability of the lateral stress-measuring technique. Example: Identification of Failure Waves in Glass. In-material axial and transverse stress measurements have been successfully used in the interpretation of so-called failure waves in glass (Ref 24, 25, 45). By using the configuration shown in Fig. 18 with the longitudinal gage backed by a PMMA plate, the dynamic tensile strength of the material was determined (Ref 45). In these experiments, manganin gages were used. Soda-lime and aluminosilicate glass plates were tested. The density and longitudinal wave velocity for the soda-lime glass were 2.5 g/cm3 and 5.84 mm/µs, respectively. The aluminosilicate glass properties were density = 2.64 g/cm3, Young’s modulus = 86 GPa (12 × 106 psi), and Poisson’s ratio = 0.24.
0 0 (b)
2
4
6
Time, µs
In-material gage profiles from spall experiments. (a) Longitudinal profiles. Gage profile on the left shows a strong reduction in spall strength (measurement behind the so-called failure wave front). (b) Transverse profiles showing transverse stress histories at two locations within the glass specimen. Source: Ref 87
Fig. 19
Low-Velocity Impact Testing / 555 To understand how targets defeat projectiles, the complete velocity history of the projectile must be recorded. Moreover, multiple instrumentation systems are highly desirable because they provide enough measurements for the identification of failure through modeling and analysis. In this section, a new experimental configuration that can record tail-velocity histories of penetrators and target back surface out-of-plane motion in penetration experiments is presented. The technique provides multiple real-time diagnostics that can be used in model development. Laser interferometry is used to measure the surface motion of both projectile tail and target plate with nanosecond resolution. The investigation of penetration in woven glass fiber reinforced polyester (GRP) composite plates also is discussed. Experimental Setup. Penetration experiments were conducted with a 75 mm (3 in.) light gas gun with keyway. The experiments were designed to avoid complete destruction of the target plate so that microscopy studies could be performed in the samples. Impactor tail velocity and back surface target plate velocity histories were successfully measured by using the setups shown in Fig. 20(a) and (b), direct and reverse penetration experiments, respectively. In the case of direct penetration experiments (Fig. 20a), the projectile holder was designed such that a normal velocity interferometer could be obtained on a laser beam reflected from the back surface of the projectile. In addition to this measurement, a multipoint interferometer was used to continuously record the motion of the target back surface. It should be noted that the NVI system used in this configuration has variable sensitivity so its resolution can be adjusted to capture initiation and evolution of failure. The NVI records contain information on interply delamination, fiber breakage and kinking, and matrix inelasticity as these events start and progress in time. A cylindrical target plate 100 mm (4 in.) in diameter and 25 mm (1 in.) thick was positioned in a target holder with alignment capabilities. The target was oriented so that impact at normal incidence was obtained. A steel penetrator with a 30° conical tip was mounted in a fiberglass tube by means of a PVC holder. This holder contained two mirrors and a plano-convex lens along the laser beam path. The focal distance of the plano-convex lens was selected to focus the beam at the penetrator back surface. Penetrator tail velocities were measured by means of the normal velocity interferometer (NVI), with signals in quadrature (Fig. 20a). The interferometer beams were aligned while the penetrator was at the end of the gun barrel (i.e., on conditions similar to the conditions occurring at the time of impact). The alignment consisted of adjusting mirrors M1, M2, and M3 such that the laser beam, reflected from the penetrator tail, coincided with the incident laser beam. Through motion of the fiberglass tube along the gun barrel, it was observed that the present arrangement preserves beam
Table 7
Summary of parameters and results for manganin gage experiments Thickness of aluminum impactor mm in.
Shot No.
Material
7-0889 7-1533 7-1717 7-1719
Soda-lime glass Soda-lime glass Aluminosilicate glass Aluminosilicate glass
3.9 2.4 12.7 14.5
0.15 0.09 0.50 0.57
Target thickness mm in.
Impact velocity m/s ft/s
Normal stress GPa ksi
5.7 5.7 19.4 19.4
906 917 770 878
7.5 1088 7.6 1102 6.1 885 6.97 1011
9.3"
0.22 0.22 0.76 0.76
2972 3009 2526 2881
1"
PVC-ring
Impactor
Multibeam splitter
Beam expander (a)
Aluminum holder
Steel anvil
Fiberglass tube
Bronze ring
Penetrator
To NVI/NDI axial velocity
Composite sample (b)
Fig. 20
Low-velocity penetration experiments. (a) Setup for direct penetration experiment (rod-on-plate). (b) Setup for reverse penetration experiment (plate-on-rod). Source: Ref 107
556 / High Strain Rate Testing alignment independently of the position of the penetrator in the proximity of the target. Therefore, a considerable recording time could be expected before the offset of the interferometer. A few precautions were taken to avoid errors in the measurement. First, the PVC holder was designed such that the penetrator could move freely along a cylindrical cavity (i.e., no interaction between the steel penetrator and PVC holder was allowed and, therefore, true deceleration was recorded). The penetrator was held in place during firing by means of epoxy deposited at the penetrator periphery on the front face of the PVC holder. Second, in order to avoid projectile rotation that could offset the interferometer alignment, a polytetrafluoroethylene key was placed in the middle of the fiberglass tube. Target back surface velocities were measured with a multipoint normal displacement interferometer (NDI). Since woven composites are difficult to polish, the reflectivity of the back surface was enhanced by gluing a 0.025 mm (0.001 in.) mylar sheet, and then a thin layer of aluminum was vapor deposited. In the case of reverse-penetration experiments (Fig. 20b), composite flyer plates were cut with a diameter of 57 mm (2.25 in.) and a thickness of 25 mm (1 in.). The composite plates were lapped flat using 15 µm silicon carbide powder slurry. These plates were mounted on a fiberglass tube by means of a backing aluminum plate. The penetrator, a steel rod with a 30° conical tip, was mounted on a target holder and aligned for impact at normal incidence. In these experiments, the penetrator back-surface velocity was simultaneously measured by
Table 8
means of NDI and NVI systems. A steel anvil was used to stop the fiberglass tube and allow the recovery of the sample. Experimental Results: Velocity Measurements. A summary of experiments is given in Table 8. The NVI signals in quadrature were analyzed following the procedure described in Ref 106. The NDI signals were converted to particle velocities according to the procedure described in Ref 52. The impactor velocity during the penetration event, in experiments 5-1122 and 6-1117, is given in Fig. 21. A velocity reduction of approximately 32 m/s (105 ft/s) in shot 5-1122 and about 20 m/s (66 ft/s) in shot 6-1117 are observed after 100 µs of the recorded impact. A progressive decrease in velocity is observed in the first 30 µs followed by an almost constant velocity and a sudden velocity increase of 7 m/s (23 ft/s) at approximately 60 µs. Further reduction in velocity is measured in the next 40 µs. In the case of shot 6-1117, the tail velocity shows a profile with features similar to the one recorded in shot 5-1122. These velocity histories present a structure that should be indicative of the contact forces that develop between penetrator and target, as well as the effect of damage in the penetration resistance of GRP target plates. It should be noted that a projectile traveling at 200 m/s (656 ft/s) moves a distance of 20 mm (0.8 in.) in 100 µs. Back-surface velocity histories at the specimen center measured by means of a normal displacement interferometer (NDI) are shown in Fig. 22 for shot 5-1122, 6-0531, and 6-1117. A velocity increase to a value of 22 m/s (72 ft/s),
Summary of parameters for rod-on-plate and plate-on-rod impact experiments Impact velocity
Experiment No.
5-1122 6-0308 6-0314 6-0531 6-1117
m/s
Specimen diameter mm in.
ft/s
200(a) 200(a) 500(a) 181.6 180.6
656(a) 656(a) 1640(a) 596 593
102 57 57 102 102
Type of experiment
4 2.25 2.25 4 4
Direct penetration Reverse penetration Reverse penetration Direct penetration Direct penetration
Note: For all experiments, specimen thickness was 24 mm (1 in.); impactor dimensions were 14 mm (0.56 in.) diam; 30o conical, 64 mm (2.5 in.) length. (a) Velocity estimated from gas gun calibration curve based on breech pressure. Source: Ref 107
55 50
50
195
Shot 5-1122 (V = 200 m/s)
40
Target velocity, m/s
190 Shot 5-1122 (V = 200 m/s)
185 180 175 170
Shot 6-1117 (V = 180 m/s)
165
45
30 Shot 6-1117 (V = 180 m/s)
20
10
160 0
50
Time, µs
100
Penetrator tail velocity histories recorded with normal velocity interferometer (NVI) using the direct penetration configuration. V, velocity. Source: Ref 107
Fig. 21
Shot 6-0531 (V = 180 m/s)
0 0
10
20 Time, µs
30
Back surface normal velocity histories at the center of glass fiber-reinforced epoxy composite target. V, velocity. Source: Ref 107
Fig. 22
Axial velocity, m/s
200
Penetrator velocity, m/s
followed by a decrease and increase to a maximum velocity of about 50 m/s (164 ft/s), after 20 µs, is measured in shot 5-1122. The trace from shot 6-0531 and 6-1117 shows features similar to the features present in the velocity history recorded in experiment 5-1122. However, significant differences in amplitude are observed. A maximum particle velocity of 18 m/s (59 ft/s) is observed at about 37.5 µs. These velocity histories present variations such as small humps with some apparent periodicity. Numerical simulation of the experiments, incorporating the observed failure modes, is required to interpret the various features observed in the velocity traces. To confirm the velocities measured in the direct penetration experiment, two reverse penetration experiments were conducted at impact velocities of 200 and 500 m/s (656 and 1640 ft/s), experiments 6-0308 and 6-0314, respectively. Another objective of these experiments was to examine rate effects in the penetration resistance of woven-fiber composites. The interferometrically measured penetrator tail velocities are plotted in Fig. 23. The steel penetrator velocity shows a progressive increase and a decrease to almost zero velocity upon arrival of an unloading wave generated at the penetratorfree surface. The arrival time of approximately 14 µs coincides with the round-trip time of the wave through the penetrator nose back to the penetrator tail. This feature is observed in both experiments. A continuous increase in velocity is recorded with velocities of 20 m/s and 32 m/s (66 and 105 ft/s) after 42 µs, respectively. A maximum velocity of 50 m/s (164 ft/s) is recorded in experiment 6-0314 after 65 µs. A comparison of the velocity histories in these two experiments clearly reveals that composite failure presents moderate rate sensitivity. Moreover, velocities recorded in experiment 6-0308 appear to confirm the velocity reduction interferometrically recorded in experiment 5-1122 (direct-penetration experiment). Microscopy studies were performed in recovered samples to assess the amount of delamination and fiber fracture and kinking. The details of this study can be found in Ref 107.
40
Shot 6-0314 (500 m/s)
35 30 25 20 15 10 5 0
Shot 6-0308 (200 m/s)
0
10
20
30 40 Time, µs
50
60
Penetrator tail velocity histories recorded with normal displacement interferometer (NDI) in reverse penetration configuration. Source: Ref 107
Fig. 23
Low-Velocity Impact Testing / 557 REFERENCES 1. P. Kumar and R.J. Clifton, Dislocation Motion and Generation in LiF Single Crystals Subjected to Plate-Impact, J. Appl. Phys., Vol 50 (No. 7), 1979, p 4747–4762 2. K.S. Kim and R.J. Clifton, Pressure-Shear Impact of 6061-T6 Aluminum and Alpha-Titanium, J. Appl. Mech., Vol 47, 1980, p 11–16 3. A. Gilat and R.J. Clifton, Pressure-Shear Waves in 6061-T6 Aluminum and Alpha-Titanium, J. Mech. Phys. Solids, Vol 33 (No.3), 1985, p 263–284 4. C.H. Li, “A Pressure-Shear Experiment for Studying the Dynamic Plastic Response of Metals and Shear Strain Rates of 105 s−1,” Ph.D. thesis, Brown University, Providence, RI, 1982 5. R.J. Clifton and R.W. Klopp, Pressure-Shear Plate Impact Testing, Mechanical Testing, Vol 8, ASM Handbook, 9th ed., ASM International, 1985, p 230–239 6. K.T. Ramesh and R.J. Clifton, A Pressure-Shear Plate Impact Experiment for Studying the Rheology of Lubricants at High Pressures and High Strain Rates, J. Tribology, 1987, Vol 109, p 215 7. H.D. Espinosa and R.J. Clifton, Plate Impact Experiments for Investigating Inelastic Deformation and Damage of Advanced Materials, Symposium on Experiments in Micromechanics of Fracture-Resistant Materials (ASME Winter Annual Meeting), 1–6 Dec 1991 (Atlanta, GA), K.S. Kim, Ed., 1991, p 37–56 8. J.C. Escobar and R.J. Clifton, On Pressure-Shear Plate Impact for Studying the Kinetics of Stress-Induced Phase Transformations, Mater. Sci. Eng. A: Structural Materials: Properties, Microstructure & Processing, No. 1–2, 1 Oct 1993, p 125–142 9. Y. Sano, S.-N. Chang, M.A. Meyers, and S. Nemat-Nasser, Identification of Stress Induced Nucleation Sites for Martensite in Fe-31.8wt%Ni-0.02wt%C Alloy, Acta Metall. Mater., Vol 40 (No. 2), 1992, p 413–417 10. G. Ravichandran and R.J. Clifton, Dynamic Fracture under Plane Wave Loading. Int. J. Fract., Vol 40 (No. 3), 1989, p 157–201 11. G. Raiser, R.J. Clifton, and M. Ortiz, A Soft-Recovery Plate Impact Experiment for Studying Microcracking in Ceramics, Mech. Mater., Vol 10, 1990, p 43–58 12. H.D. Espinosa, G. Raiser, R.J. Clifton, and M. Ortiz, Inelastic Mechanisms in Dynamically Loaded Ceramics, Mechanics Computing in 1990s and Beyond, ASCE Proceedings, 20–22 May 1991 (Columbus, OH), H. Adeli and R. Sierakowski, Ed., American Society of Civil Engineers, 1991, p 293–297 13. H.D. Espinosa, G. Raiser, R.J. Clifton, and M. Ortiz, Performance of the Star-Shaped
Flyer in the Study of Brittle Materials: Three Dimensional Computer Simulations and Experimental Observations, J. Appl. Phys., Vol 72 (No. 8), 1992, p 3451–3457 14. H.D. Espinosa, G. Raiser, R.J. Clifton, and M. Ortiz, Experimental Observations and Numerical Modeling of Inelasticity in Dynamically Loaded Ceramics, J. Hard Mater., Vol 3 (No. 3–4), 1992, p 285–313 15. V. Prakash, L.B. Freund, and R.J. Clifton, Stress Wave Radiation from a Crack Tip during Dynamic Initiation, J. Appl. Mech.(Trans. ASME), Vol 59 (No.2), June 1992, p 356–365 16. A.R. Machcha and S. Nemat-Nasser, Pressure-Shear Recovery Experiments, Mech. Mater., Vol 18, 1994, p 49–53 17. H.D. Espinosa, M. Mello, and Y. Xu, A Desensitized Displacement Interferometer Applied to Impact Recovery Experiments, J. Appl. Phys. Lett., Vol 69 (No. 21), 1996, p 3161–3163 18. H.D. Espinosa, A. Patanella, and Y. Xu, Dynamic Compression-Shear Loading of Brittle Materials with Specimen Recovery, Proceedings of the 11th Int. Conf. on Experimental Mechanics, 24–28 Aug 1998 (Oxford, UK), I.M. Allison, Ed., 1998, p 223–229 19. H.D. Espinosa, A. Patanella, and Y. Xu, Dynamic Compression-Shear Response of Brittle Materials with Specimen Recovery, to appear in Exp. Mech., 2000 20. M. Zhou, A. Needleman, and R.J. Clifton, Finite Element Simulations of Shear Localization in Plate Impact, J. Mech. Phys. Solids, Vol 42 (No. 3), 1994, p 423–458 21. H.D. Espinosa, On the Dynamic Shear Resistance of Ceramic Composites and its Dependence on Applied Multiaxial Deformation, Int. J. Solids Struct., Vol 32 (No. 21), 1995, p 3105–3128 22. P.D. Zavattieri, P.V. Raghuram, and H.D. Espinosa, A Computational Model of Ceramic Microstructures Subjected to Multi-Axial Dynamic Loading, to appear in J. Mech. Phys. Solids, 2000 23. A.R. Machcha and S. Nemat-Nasser, Effects of Geometry in Pressure-Shear and Normal Plate Impact Experiments: Three-Dimensional Finite Element Simulations and Experimental Observations, J. Appl. Phys., Vol 80 (No. 6), 1996, p 3267–3274 24. H.D. Espinosa, Y. Xu, and N.S. Brar, Micromechanics of Failure Waves in Glass: Experiments, J. Am. Ceram. Soc., Vol 80 (No. 8), 1997, p 2061–2073 25. H.D. Espinosa, Y. Xu, and N.S. Brar, Micromechanics of Failure Waves in Glass: Modeling, J. Am. Ceram. Soc., Vol 80 (No. 8), 1997, p 2074–2085 26. H.D. Espinosa, Y. Xu, and H.-C. Lu, Inelastic Behavior of Fiber Composites Subjected to Out-of-Plane High Strain Rate Shearing, Acta Mater., Vol 45 (No. 11), 1997, p 4855–4865
27. H.V. Arrieta and H.D. Espinosa, High and Low Temperature Dynamic Testing of Advanced Materials, Shock Compression of Condensed Matter, APS Conference (Snowbird, UT), American Physics Society, 1999 28. H.D. Espinosa, P.D. Zavattieri, and G.L. Emore, Adaptive FEM Computation of Geometric and Material Nonlinearities with Application to Brittle Failure, Mech. Mater., H.D. Espinosa and R.J. Clifton, Ed., Vol 29, 1998, p 275–305 29. H.D. Espinosa, P.D. Zavattieri, and S. Dwivedi, A Finite Deformation Continuum/Discrete Model for the Description of Fragmentation and Damage in Brittle Materials, J. Mech. Phys. Solids, Vol 46 (No. 10), 1998, p 1909–1942 30. A.S. Abou-Sayes, R.J. Clifton, and L. Hermann, The Oblique Plate Impact Experiment, Exp. Mech., Vol 16, 1976, p 127–132 31. L.C. Chhabildas and J.W. Swegle, Dynamic Pressure-Shear Loading of Materials Using Anistropic Crystals, J. Appl. Phys., Vol 51, 1980, p 4799–4807 32. T. Nicholas and S.J. Bless, High Strain Rate Tension Testing, Mechanical Testing, Vol 8, ASM Handbook, 9th ed., ASM International, 1985, p 208–214 33. W.F. Hartman, Determination of Unloading Behavior of Uniaxially Strained 6061-T Aluminum from Residual Strain Measurements, J. Appl. Phys., Vol 35, 1964, p 2090 34. R. Dandliker and J.-F. Willemin, Measuring Microvibrations by Heterodyne Speckle Interferometry, Opt. Lett., Vol 6, 1981, p 165 35. J.E. Vorthman and G.E. Duvall, Dislocations in Shocked and Recovered LiF, J. Appl. Phys., Vol 53, 1982, p 3607–3615 36. S . - N . C h a n g , D . - T . C h u n g , G . Ravichandran, and S. Nemat-Nasser, Plate Impact Experiments on Mg-PSZ and Improved Target Configuration, Proceedings of 1989 APS Topical Conference on Shock Compresssion of Condensed Matter, 14–17 Aug 1989, S.C. Schmidt, J.N. Johnson, and L.W. Davidson, Ed., American Physics Society, 1990, p 389–392 37. S.-N. Chang, D.-T. Chung, Y.F. Li, and S. Nemat-Nasser, Target Configurations for Plate-Impact Recovery Experiments, J. Appl. Mech., Vol 92-APM-18, 1992, p 1–7 38. P. Kumar and R.J. Clifton, A Star-Shaped Flyer for Plate Impact Recovery Experiments, J. Appl. Phys., Vol 48, 1977b, p 4850 39. R.J. Clifton, G. Raiser, M. Ortiz, and H.D. Espinosa, A Soft Recovery Experiment for Ceramics, Proceedings of 1989 APS Conference on Shock Compression of Condensed Matter, American Physics Society, 1990, p 437–440 40. S . N e m a t - N a s s e r , J . B . I s a a c s , G . Ravichandran, and J.E. Starrett, High Strain Rate Testing in the U.S., Proceed-
558 / High Strain Rate Testing ings of the TTCP TTP-1 Workshop on New Techniques of Small Scale High Strain Rate Studies, 26 April 1988 (Melbourne, Australia) 41. H.D. Espinosa, Micromechanics of the Dynamic Response of Ceramics and Ceramic Composites, Ph.D. thesis, Brown University, Providence, RI, 1992 42. K.J. Frutschy and R.J. Clifton, High-Temperature Pressure-Shear Plate Impact Experiments on OFHC Copper, J. Mech. Phys. Solids, Vol 46 (No. 10), 1998, p 1723–1743 43. K.J. Frutschy and R.J. Clifton, High-Temperature Pressure-Shear Plate Impact Experiments Using Pure Tungsten Carbide Impactors, Exp. Mech., Vol 38 (No. 2), 1998, p 116–125 44. H.V. Arrieta and H.D. Espinosa, The Role of Thermal Activation on Dynamic Stress Induced Inelasticity and Damage in Ti-6Al-4V, submitted to Mech. Mater., 2000 45. N.S. Brar and S.J. Bless, Failure Waves in Glass under Dynamic Compression, High Pressure Res., Vol 10, 1992, p 773–784 46. D. Grady and J.L. Wise, “Dynamic Properties of Ceramic Materials,” Sandia Report SAND93-0610, Sandia National Laboratories, 1993 47. G.R. Fowles, Gas Gun for Impact Studies, Rev. Sci. Instrum., Vol 41, 1970, p 984 48. L.M. Barker and R.E. Hollenbach, Interferometer Technique for Measuring the Dynamic Mechanical Properties of Materials, Rev. Sci. Instrum., Vol 36 (No. 11), 1965, p 1617–1620 49. L.M. Barker and R.E. Hollenbach, Laser Interferometry for Measuring High Velocities of Any Reflecting Surface, J. Appl. Phys., Vol 43 (No. 11), 1972, p 4669–4675 50. K.S. Kim, R.J. Clifton, and P. Kumar, A Combined Normal and Transverse Displacement Interferometer with an Application to Impact of Y-Cut Quartz, J. Appl. Phys., Vol 48, 1977, p 4132–4139 51. L.C. Chhabildas, H.J. Sutherland, and J.R. Asay, Velocity Interferometer Technique to Determine Shear-Wave Particle Velocity in Shock-Loaded Solids, J. Appl. Phys., Vol 50, 1979, p 5196–5201 52. H.D. Espinosa, M. Mello, and Y.Xu, A Variable Sensitivity Displacement Interferometer with Application to Wave Propagation Experiments, J. Appl. Mech., Vol 64, 1997, p 123–131 53. W.F. Hemsing, Velocity Sensing Interferometer (VISAR) Modification, Rev. Sci. Instrum., Vol 50 (No. 1), 1979, p 73–78 54. J.P. Sullivan and S. Ezekiel, A Two-Component Laser Doppler Velocimeter for Periodic Flow Fields, J. Phys., Vol E7, 1974, p 272–274 55. L.C. Chhabildas, H.J. Sutherland, and J.R. Asay, A Velocity Interferometer Technique to Determine Shear-Wave Particle
Velocity in Shock-Loaded Solids, J. Appl. Phys., Vol 50 (No. 8), 1979, p 5196–5201 56. H.D. Espinosa, Dynamic Compression Shear Loading with In-Material Interferometric Measurements, Rev. Sci. Instrum., Vol 67 (No. 11), 1996, p 3931–3939 57. R.J. Clifton, Analysis of the Laser Velocity Interferometer, J. Appl. Phys., Vol 41 (No. 13), 1970, p 5335–5337 58. Valyn VISAR , User’s Handbook, Valyn International, Albuquerque, NM, 1995 59. Valyn VISAR Data Reduction Program, User’s Handbook, Valyn International, Albuquerque, NM, 1995 60. M.A. Zikry and S. Nemat-Nasser, High Strain-Rate Localization and Failure of Crystalline Materials, Mech. Mater., Vol 10 (No. 3), 1990, p 215–237 61. F. Longy and J. Cagnoux, Plasticity and Microcracking in Shock-Loaded Alumina, J. Am. Ceram. Soc., Vol 72 (No. 6), 1989, p 971 62. D . Y a z i v , “ S h o c k F r a c t u r e a n d Recompaction of Ceramics,” Ph.D. thesis, University of Dayton, 1985 63. A.L. Stevens and O.E. Jones, Radial Stress Release Phenomena in Plate Impact Experiments: Compression-Release, J. Appl. Mech., Vol 39, 1972, p 359–366 64. R.L. Rabie, J.E. Vorthman, and J.K. Dienes, Three-Dimensional Computer Modeling of a Shock Recovery Experiment, Shock Waves in Condensed Matter, Vol 5, J.R. Asay, R.A. Graham, and G.K. Straub, Ed., 1983 65. S. Yadav, J.A. Davis, and K.T. Ramesh, Damage and Recovery Experiments Using Pressure-Shear Plate Impact, Experimental Techniques in the Dynamics of Deformable Solids, Vol 165, ASME, Applied Mechanics Division (AMD), 1993, p 71–78 66. V. Prakash and R.J. Clifton, Time Resolved Dynamic Friction Measurements in Pressure Shear, Experimental Techniques in the Dynamics of Deformable Solids, Vol 165, ASME, Applied Mechanics Division (AMD), 1993, p 33–48 67. V. Prakash, Pressure-Shear Plate Impact Experiment for Investigating Transient Friction, Exp. Mech., Vol 35 (No. 4), 1995, p 329–336 68. S. Rajagopalan, M.A. Irfan, and V. Prakash, Novel Experimental Techniques for Investigating Time Resolved High Speed Friction, Wear, Vol 225 (No. 2), 1999, p 1222–1237 69. K.J. Frutschy and R.J. Clifton, Plate-Impact Technique for Measuring Dynamic Friction at High Temperatures, J. Tribology (Trans. ASME), Vol 119 (No. 3), July 1997, p 590–593 70. S. Yadav and K.T. Ramesh, The Mechanical Properties of Tungsten-Based Composites at Very High Strain Rates, Mater. Sci. Eng. A, Vol A203, 1995, p 140
71. D.R. Chichili, K.T. Ramesh, and K.J. Hemker, High-Strain-Rate Response of Alpha-Titanium: Experiments, Deformation Mechanisms and Modeling, Acta Mater., Vol 46 (No. 3), 1998, p 1025–1043 72. R . K a p o o r a n d S . N e m a t - N a s s e r , High-Rate Deformation of Single Crystal Tantalum: Temperature Dependence and Latent Hardening, Scr. Mater., Vol 40 (No. 2), 18 Dec 1998, p 159–164 73. K.-S. Kim, R.M. McMeeking, and K.L. Johnson, Adhesion, Slip, Cohesive Zones and Energy Fluxes for Elastic Spheres, J. Mech. Phys. Solids, Vol 46, 1998, p 243–266 74. W. Johnson, Processes Involving High Strain Rates, Int. Phys. Conference Series, Vol 47, 1979, p 337 75. J.D. Campbell, High Strain Rate Testing of Aluminum, Mater. Sci. Eng., Vol 12, 1973, p 3 76. Hirschvogel, Metal Working Properties, Mech. Working Technol., Vol 2, 1978, p 61 77. S. Yadav and K.T. Ramesh, Mechanical Behavior of Polycrystalline Hafnium: Strain-Rate and Temperature Dependence, Mater. Sci. Eng. A: Structural Materials: Properties, Microstructure & Processing, No. 1–2, 15 May 1998, p 265–281 78. L.X. Zhou and T.N. Baker, Deformation Parameters in b.b.c., Met. Mater. Sci. Eng., Vol A177, 1994, p 1 79. S. Nemat-Nasser and J.B. Isaacs, Direct Measurement of Isothermal Flow Stress of Metals at Elevated Temperatures and High Strain Rates with Application to Ta and Ta-W Alloys, Acta Mater., Vol 45 (No. 3), 1997, p 907–919 80. A.M. Lennon and K.T. Ramesh, Technique for Measuring the Dynamic Behavior of Materials at High Temperatures, Inter. J. Plast., Vol 14 (No. 12), 1998, p 1279–1292 81. T. Sakai, M. Ohashi, and K. Chiba, Recovery and Recrystallization of Polycrystalline Nickel after Hot Working, Acta Metall., Vol 36, 1988, p 1781 82. G.I. Kanel, S.V. Razorenov, A. Bogatch, A.V. Utkin, and V.E. Fortov, Spall Fracture Properties of Aluminum and Magnesium at High Temperatures, J. Appl. Phys., Vol 79, 1996, p 8310 83. V.K. Golubev and Y.S. Sobolev, Effect of Temperature on Spall Failure of Some Metal Alloys, 11th APS Topical Group Meeting on Shock Compression of Condensed Matter (Snowbird, UT), American Physics Society, 1999 84. H.V. Arrieta, “Dynamic Testing of Advanced Materials at High and Low Temperatures,” MSc thesis, Purdue University, West Lafayette, IN, 1999 85. R.A. Wood, Titanium Alloy Handbook, Metals and Ceramic Center, Battelle, Publication MCIC-HB-02, 1972 86. G.Q. Chen and T.J. Ahrens, Radio Frequency Heating Coils for Shock Wave Ex-
Low-Velocity Impact Testing / 559 periments, Mater. Res. Symp. Proc., Vol 499, 1998, p 131 87. H.D. Espinosa, Recent Developments in Velocity and Stress Measurements Applied to the Dynamic Characterization of Brittle Materials, Mech. Mater., H.D. Espinosa and R.J. Clifton, Ed., Vol 29, 1998, p 219–232 88. N . S . B r a r a n d A . H o p k i n s , S h o c k Hugoniot and Shear Strength of Ti-6Al-4V, 11th APS Topical Group Meeting on Shock Compression of Condensed Matter, (Snowbird, UT), American Physics Society, 1999 89. Y. Mescheryakov, A.K. Divakov, and N.I. Zhigacheva, Shock-Induced Phase Transition and Mechanisms of Spallation in Shock Loaded Titanium Alloys, 11th APS Topical Group Meeting on Shock Condensed Matter, Snowbird, UT, 1999 90. Y.K. Vohra, S.K. Sikka, S.N. Vaidya, and R. Chidambaram, Impurity Effects and ReactionKinetics of the Pressure-Induced Alpha to Omega Transformation in Ti, J. Phys. Chem. Solids, Vol 38, 1977, p 1293 91. Y. Me-Bar, M. Boas, and Z. Rosenberg, Spall Studies on Ti-6Al-4V, Mater. Sci. Eng., Vol 85, 1987, p 77 92. J.E. Shrader and and M.D. Bjorkman, High Temperature Phase Transformation in the Titanium Alloy Ti-6Al-4V, American Physics Society Conference Proc., No. 78, American Physics Society, 1981, p 310–314 93. Y.M. Gupta, Shear Measurements in
Shock Loaded Solids, Appl. Phys. Lett., Vol 29, 1976, p 694–697 94. Z. Young and O. Dubugnon, A Reflected Shear-Wave Technique for Determining Dynamic Rock Strength, Int. J. Rock Mech. Min. Sci., 1977, p 247–259 95. Y.M. Gupta, D.D. Keough, D.F. Walter, K.C. Dao, D. Henley, and A. Urweider, Experimental Facility to Produce and Measure Compression and Shear Waves in Impacted Solids, Rev. Sci. Instrum., Vol 51(a), 1980, p 183–194 96. R . W i l l i a m s a n d D . D . K e o u g h , Piezoresistive Response of Thin Films of Calcium and Lithium to Dynamic Loading, Bull. Am. Phys. Soc. Series II, Vol 12, 1968, p 1127 97. Z. Rosenberg and S.J. Bless, Determination of Dynamic Yield Strengths with Embedded Manganin Gages in Plate-Impact and Long-Rod Experiments, Exp. Mech., 1986, p 279–282 98. P.W. Bridgman, Proc. Am. Acad. Arts Sci., Vol 47, 1911, p 321 99. D . B e r n s t e i n a n d D . D . K e o u g h , Piezoresistivity of Manganin, J. Appl. Phys., Vol 35, 1964, p 1471 100. P.S. DeCarli, D.C. Erlich, L.B. Hall, R.G. Bly, A.L. Whitson, D.D. Keough, and D. Curran, “Stress-Gage System for the Megabar (100 MPa) Range,” Report DNA 4066F, Defense Nuclear Energy, SRI Intl., Palo Alto, CA, 1976 101. L.E. Chhabildas and R.A. Graham, Techniques and Theory of Stress Measurements
for Shock-Wave Applications, Symposia Series, ASME, Applied Mechanics Division (AMD), AMD-83, 1987, p 1–18 102. M.K.W. Wong and Y.M. Gupta, Dynamic Inclusion Analyses of Lateral Piezoresistance Gauges under Shock Wave Loading, Shock Compression of Condensed Matter, S.C. Schmidt, R.D. Dick, J.W. Forbes, and D.J. Tasker, Ed., Elsevier, Essex, U.K., 1991 103. Z. Rosenberg and N.S. Brar, Hysteresis of Lateral Piezoresistive Gauges, High Pressure Science and Technology, Joint AIRAPT-APS Conference (Colorado Springs, CO), S.C. Schmidt, Ed., 1994, p 1707–1710 104. D.P. Dandekar and P.A. Beaulieu, Failure Wave under Shock Wave Compression in Soda Lime Glass, Metallurgical and Material Applications of Shock-Wave and High-Strain-Rate Phenomena, L.E. Murr et al., Ed., Elsevier, 1995 105. Z. Rosenberg and Y. Partom, Longitudinal Dynamic Stress Measurements with In-Material Piezoresistive Gauges, J. Appl. Phys., Vol 58, 1985, p 1814 106. L. Barker, “VISAR88—A New Data Reduction Program for VISARs,” Sandia Report, Sandia National Laboratory, 1988 107. H.D. Espinosa, H.-C. Lu, and Y. Xu, A Novel Technique for Penetrator Velocity Measurement and Damage Identification in Ballistic Penetration Experiments, J. Compos. Mater., Vol 32 (No. 8), 1998