MAC Tutorial 6 - How to Make a Bar Chart - Faculty
Recommend Documents
41000 - Business Statistics. Chicago Booth. Professor: Drew Creal. STATISTICS
IN EXCEL - TUTORIAL FOR MAC. Tutorial 5. How to Create a Pivot Table.
41000 - Business Statistics Chicago Booth Professor: Drew Creal STATISTICS IN EXCEL - TUTORIAL FOR MAC Tutorial 3. How to Make a Time Series Plot
How to Make a Bar Graph Use graph paper (1) Choose the size graph paper that best fits the data Number the Y-axis (the vertical one)- Dependent Variable
SVG Bar Chart Tutorial. Introduction. Creating SVG bar charts with Adobe®
Illustrator® CS 2 is collaborative process between both an interactive designer
and a ...
This artifact is a collaboration of information from many websites and utilizes
software developed by the OSx86 community and specifically “Tonymacx86”
utilities ...
beginnings of a Smith chart less the constant resistance and reactance circles/
lines. VSWR = ... Impedance is plotted on the smith chart by first normalising to
the ...
There was a problem previewing this document. Retrying... Download ... Tutorial - How to Make an Accordion Fold Domino B
(Adapted from ENSI/SENSI lesson plan: Making Cladograms ... Lesson Topic: Cladistics: Phylogenetic Systematics. Objectiv
1. Conversation Curriculum. How to Make a Salad. Learning objective: Students
will gain practice in expressing a multi-step task to one another, emphasizing ...
By depicting these relationships, cladograms reconstruct the evolutionary ...
Cladograms can also be called “phylogenies” or “trees”. ... Cladogram Worksheet
.
We make resistors using highres poly layer. Highres poly is not a physical layer on the silicon wafer. So in the cross-s
build architecture, don't arrange dances, don't write plays, don't compose music,
don't make movies, and above all, don't think you'll get a happening out of ...
random, put your finger down at some point in the page and you
It's the question that all prospective solo practitioners want to ask: "How much
does a solo attorney make? ... And you can make the money if you choose to put
in.
shipping. It's a little like Contact Cement. The two parts bond permanently, and better, if the adhesive is applied to e
Aluminum bars are an excellent choice for hanging textile art work, including art quilts and mixed media ... Nothing is
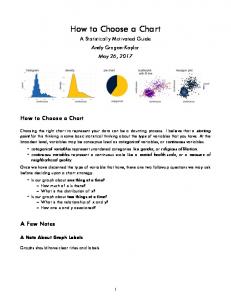
May 26, 2017 - Choosing the right chart to represent your data can be a daunting .... bar chart. Group A. Group B categorical count conditional bar chart count.
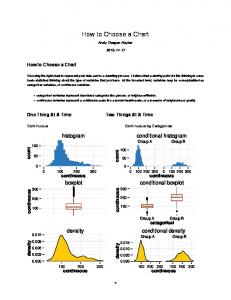
Nov 17, 2015 - doughnut chart. Group A. Group B categorical conditional doughnut chart. Two Things At A Time. Continuous by Continuous continuous contin.
20th March each year is dedicated to the International Day of Happiness. It is celebrate in order to recognise the impor
Tutorial 6 van Emde Boas trees. Problem 20.1-4 (536): What is the tree height if
the node degree is u1/k in the superimposed tree? Solution: Repeatedly scaling
...
BUSINESS Digital Book. Book Descriptions: ... online⢠how to start an internet business⢠social media marketing idea
National leaders such as Dr. Martin Luther King Jr. and Malcolm X ... Permission
is granted to educators to reproduce this worksheet for classroom use. 1 ...
this package well suited for solving typical problems of linear programming. Topics ... constraint set, geometric solution of the linear programming problem, the ...
All parts except for the turned parts were done by waterjet cueng, bending and
spot welding. Total fabricaâon âme .... Ma. Dies are cut into different lengths to
allow complex bends ... with the same equipment ..... for homemade plain
bearings.
manual designed for your vehicle for detailed instructions. Parts Plus assumes no
liability for an ... independent front suspension system, its components.
MAC Tutorial 6 - How to Make a Bar Chart - Faculty
Tutorial 6. How to Make a Bar Chart. To illustrate how to create a bar chart let us
use the result from the Count Pivot Table of Tutorial 5. Although you can do this ...
41000 - Business Statistics
Chicago Booth Professor: Drew Creal
STATISTICS IN EXCEL - TUTORIAL FOR MAC Tutorial 6. How to Make a Bar Chart To illustrate how to create a bar chart let us use the result from the Count Pivot Table of Tutorial 5. Although you can do this directly on the Pivot Table, here I copied and pasted the result on a different sheet and put different labels. Notice that I have already selected the Charts menu (green buttons). The starting point looks as follows:
1. Click on the Column Icon. The following Menu will appear, select Clustered Column
2. A blank char area will appear and the screen will look like:
3. Step on the empty chart area and right click to see the options. Click on Select Data
4. The following dialog box will show up
5. Click on the Add button below the Series box on the right hand side.
6. Go to the Name field, click on the right arrow and select on the spread sheet the cell where the name of the variable is. Return to the dialog box by clicking on the red arrow of the small box that comes up.
7. Go to the “Y Values” field, click on the red arrow and select the data that you want the bar chart for. In this case is the count column. Return to the dialog box 8. Go to the “Category (X) axis labels” field, click on the red arrow and select the categories for the variables. In our example, these categories are the possible values that the variable Soc takes. Go back to the dialog box. After steps 6 to 8 the dialog box will look like: