2009 IEEE International Conference on Signal and Image Processing Applications
Machine Condition Monitoring Using Omnidirectional Thermal Imaging System Wai Kit Wong, Poi Ngee Tan, Chu Kiong Loo and Way Soong Lim Faculty of Engineering and Technology, Multimedia University, 75450 Jln Ayer Keroh Lama, Malaysia. Email:
[email protected],
[email protected],
[email protected],
[email protected]. Abstract- This paper proposed an efficient omnidirectional thermal imaging system for machine condition monitoring. In this thermal imaging system, the omnidirectional scenes in a machine room, production plant, pump house, laboratory, etc within a factory site are first captured using a thermal camera attached to a custom made hyperbolic IR (infrared radiation) reflected mirror. The captured scenes with some machines to be monitored are then fed into a laptop computer for image processing and alarm purposes. Log-polar mapping is proposed to map the captured omnidirectional thermal image into panoramic image, hence providing the observer or image processing tools a complete wide angle of view. A simple and effective machine condition monitoring algorithm is also designed for monitored the normal / overheat condition for machines. The observed significances of this new proposed omnidirectional thermal imaging system include: it can cover a wide angle of view (360° omnidirectional), using minimum hardware, low cost and the output thermal images are with higher data compression. Experimental results show that the proposed thermal imaging system achieves high accuracy in monitoring machine condition. Keywords- Thermal imaging system, Machine condition monitoring, Omnidirectional System, Image Processing & Understanding.
I. INTRODUCTION Thermography, or thermal visualization is a type of infrared visualization [1]. Thermographic cameras or in short thermal cameras are used in many heavy factories like metal recycling factories, wafer production factories and etc for monitoring the temperature conditions of the machines. When there is any malfunctioning of machines, extra heat will be generated and it can be picked up by thermal camera. Thermal camera will generate an image to indicate the condition of the machine. This enables the operator to decide on the on/off switch. Any malfunctioned machines detected will proceed to further repairmen action. This is so-called thermal imaging monitoring. The use of thermal imaging monitoring is much convenient compared to conventional maintenance method; the operator needs to perform some hands on job to measure the functioning machines frequently, which required more man power and longer maintenance time. With the aids of thermal imaging monitoring, the operator can maintain and monitor the machines by just observing the thermal images on the machines captured routinely and display on a monitor, even from a remote location. So, this can reduce hands on workload, man power, maintenance time and improve safety, since some overheat devices cannot see through eyes, but can be read from thermal images, hence the use of thermal imaging monitoring can prevent accident happen too [2]. If a single thermal camera is to monitor a single machine, then for more machines in different angle of view, there required more thermal cameras. Hence, it will cost more, beside complicated the monitoring network. In this project we propose to build up an effective machine condition
978-1-4244-5561-4/09/$26.00 ©2009
monitoring system. Our research is aimed to develop an omnidirectional thermal imaging system that includes three main features: 1.) 360 degree viewing using a single thermal camera, surrounding machines/items can be monitored. This achieving wide area coverage using minimum hardware. 2.) Infra-red imaging for application even in poor lighting condition. Maintenanace staffs/ technician may need not to check and monitor every single machines/item by hand in dark place which is time consuming and quite risky. 3.) Effective automatic machine condition monitoring system that will raise alerts/alarm whenever any security threat (machines/items overheating) arises. In this paper, an omnidirectional thermal imaging system consists of thermal camera, custom made IR reflected hyperbolic mirror, camera mirror holder, and laptop/PC as image processing tool is proposed for effective machine condition monitoring purposes. Thermal images captured from the custom made hyperbolic mirror are in omnidirectional view. Log-polar mapping technique is applied for unwarping the captured omnidirectional thermal images into panoramic form. A simple and fast detection algorithm is also developed for monitoring the functioning condition of different machines/items in a factory site. Experimental results show that the proposed omnidirectional thermal imaging system achieves high accuracy in monitoring machines conditions. The paper is organized in the following way: Section II will be briefly comments on the omnidirectional thermal imaging system. Section III presents the proposed log-polar mapping technique and algorithm for machine condition monitoring, section IV reports some experimental results. Finally in section V, we draw some conclusion and envision future developments. II.
OMNIDIRECTIONAL T HERMAL IMAGING SYSTEM MODEL
The omnidirectional thermal imaging system model proposed in this paper is shown in Fig.1. The system required a custom made IR reflected hyperbolic mirror, a camera mirror holder, a fine resolution thermal camera and a laptop/PC with MATLAB ver 7.0 programming. Custom made IR reflected hyperbolic mirror + camera mirror holder set
Thermal camera
Capture thermal image
Process image and Laptop/ signal alarm
PC
Fig. 1. Omnidirectional Thermal Imaging System Model
A. Custom made IR reflected hyperbolic mirror The best shape of practical use omnidirectional mirror is hyperbolic. As derived by Chahl and Srinivasan in [3], all the polynomial mirror shapes (conical, spherical, parabolic, etc) do not provide a central perspective projection, except
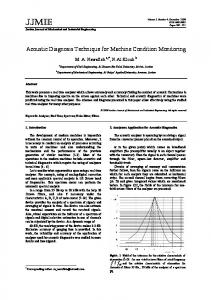
for the hyperbolic one. They also shown that the hyperbolic mirror guarantee a linear mapping between the angle of elevation θ and the radial distance from the center of the image plane ρ. Another advantage of hyperbolic mirror is when using it with a camera/imager of homogenous pixel density, the resolution in the omnidirectional image captured is also increasing with growing eccentricity and hence it will guarantee a uniform resolution for the panoramic image after unwarping. The research group of OMNIVIEWS project from Czech Technical University further developed MATLAB software for designing omnidirectional mirror [4]. From the MATLAB software, we can design our own omnidirectional hyperbolic mirror by inputting some parameters specify the mirror dimension. The first parameter is the focal length of the camera f, in which for the thermal camera we use is 12.5 mm. the distance d (ρzplane) from the origin is set to 2 m. The image plane height h is set to 20 cm. the radius of the mirror rim is chosen t1=3.6cm as modified from Svoboda work in [5], with radius for fovea region 0.6 cm and retina region 3.0 cm. Fovea angle is set in between 0º to 45º, whereas retina angle is from 45º to 135º. The coordinates as well as the plot of the mirror shape is generated using MATLAB and shown in Fig. 2. We provide the coordinates as well as mechanical drawing using Autocad to precision engineering company to fabricate/custom made the hyperbolic mirror. The hyperbolic mirror is milling by using aluminum bar and then chrome plating with a chemical element named chromium. Chromium is regarded with great interest because of its lustrous (good in IR reflection), high corrosion resistance, high melting point and hardness. The fabricated mirror is shown in Fig. 3.
Fig. 2: Mirror coordinates plot in MATLAB
multiple camera installations, Ethernet connectivity is also available. Each A-20M can be equipped with its own unique URL allowing it to be addressed independently via its Ethernet connection and it can be linked together with router to form a network. Therefore, it is best outfitted for machine condition monitoring system in a big factory site. D. Laptop/PC A laptop or PC can be used for image processor, either place on site or in a monitoring room. MATLAB ver 7.0 programming is chosen to be used because it has user friendly software for performing log-polar mapping technique to unwrap the omnidirectional thermal image into panoramic form and it can partitioned the panoramic thermal images easily according to each single machine to be monitored, process them smoothly with the machine condition monitoring algorithm we programmed in, and alarm operator with self recorded sound (e.g. : “machine A overheat”, “machine B and machine C overheat”, etc). The overall fabricated system model is shown Fig. 4.
Fig.3: Fabricated mirror
B. Camera Mirror Holder The camera mirror holder is self designed and custom made with aluminum material as shown in Fig. 4. C. Thermal Camera The thermal camera used in this paper is an affordable and accurate temperature measurement model: ThermoVision A-20M manufactured by FLIR SYSTEM [6]. The thermal camera has a temperature sensitivity of 0.10 in a range from -20ºC to 900ºC and it can capture thermal image with fine resolution up to 320 X 240 pixels offering more than 76,000 individual measurement points per image at a refresh rate of 50/60 Hz. The A-20M features a choice of connectivity options. For fast image and data transfer of real-time fully radiometric 16-bit images, an IEEE-1394 FireWire digital output can be selected. For network and/or
Fig.4: overall fabricated omnidirectional Imaging system model
III.
ALGORITHM FOR LOG P OLAR MAPPING AND M ACHINE CONDITION M ONITORING
In this section, we propose log-polar mapping for unwarping the omnidirectional thermal images into panoramic form and a simple and effective algorithm for machine condition monitoring for the omnidirectional thermal imaging system A. Log Polar Mapping Log-polar geometry or log-polar transform in short, is an example of foveated or space-variant image representation used in the active vision systems motivated by human visual system [7]. It is a spatially-variant image representation in which pixel separation increases linearly with distance from a central point [8]. It provides a way of
concentrating computational resources on regions of interest, whilst retaining low-resolution information from a wider field of view. One advantage of this kind of sampling is data reduction. Foveal image representations like this are most useful in the context of active vision system where the densely sampled central region can be directed to pick up the most salient information. Human eyes are very roughly organized in this way. In robotics, there has been a trend to design and use true retina-like sensors [9], [10] or simulate the log-polar images by software conversion [11], [12]. In the software conversion of log-polar images, practitioners in pattern recognition usually named it as log-polar mapping. The advantages of log-polar mapping is that it can unwarp an omnidirectional image into panoramic image, hence providing the observer and image processing tools a complete wide angle of view for the surveillance area’s surroundings and preserving fine output image quality in a higher data compression manner. The spatially-variant grid that represents log-polar mapping is formed by i number of concentric circles with N samples over each concentric circle [7]. An example of a spatially-variant sampling grid is shown in Fig. 5. The log-polar mapping use in this paper can be summarized as following: Initially, omnidirectional thermal image is captured using a thermal camera and a custom made IR reflected hyperbolic mirror. The geometry of the captured omnidirectional thermal image is in Cartesian form (x1,y1). Next, the Cartesian omnidirectional thermal image is sampled by the spatially-variant grid into a log-polar form (ρ,θ) omnidirectional thermal image. After that, the log-polar omnidirectional thermal image is unwarped into a panoramic thermal image (x2,y2), another Cartesian form. Since the panoramic thermal image is in Cartesian form, subsequent image processing task will become much easier. The center of pixel for log-polar sampling is described by [7]: R (1) ρ(x , y ) = ln ( ) 1
1
b
ρο
A graphical view illustrating the log-polar mapping is shown in Fig. 5 [7]. To sample the Cartesian pixels (x1,y1) into log-polar pixel (ρ,θ), at each center point calculated
Fig. 5: A graphical view of log-polar mapping.
using (1) and (2), the corresponding log-polar pixel (ρn,θn) covers a region of Cartesian pixels with radius: (6) rn = brn −1 where n = 1,2,3,…..,N-1. Fig. 6 shows the circle sampling method of log-polar mapping [7], [13], where A, A’, B and B’ points are the centre of pixel for log-polar sampling.
Fig. 6: Circular Sampling Structure in Log-Polar Mapping.
y N θ(x 1 , y1 ) = tan −1 ( 1 ) x1 2π
(2)
The center of pixel for log-polar mapping is described as: x 2 ( ρ ,θ ) = ρ cos (
2πθ(x 1 , y1 ) ) N
(3)
y 2 ( ρ , θ ) = ρ sin (
2πθ(x 1 , y 1 ) ) N
(4)
where R is the distance between given point and the center of mapping = x 1 2 + y 1 2 , ρο is the scaling factor which will define the size of the circle at ρ(x1,y1) = 0, b is the base of the algorithm [7], N +π (5) b= N −π N is the number of angular samples over each concentric circle.
The intensity value in each individual log-polar pixel equals the mean intensity value of all pixels inside the sampling circle on the original Cartesian image (x1,y1): mean =
total ( x 1 , y1 ) pixel value total number of ( x 1 , y1 ) pixel
(7)
The region of Cartesian pixels on the panoramic image (x2,y2) is covered by an individual log-polar pixel on the log-polar (ρ,θ) omnidirectional image. Therefore, the pixels in that specific region on the panoramic image (x2,y2) will have the same intensity with respect to the corresponding individual log-polar pixel. Fig. 7 shows the mapping or unwarping of log-polar pixel onto its corresponding Cartesian pixel (x2,y2), as described by (3) and (4).
Fig. 9: Calculating value of T of reference point
Step 6: Define an overheat threshold value, T( xr , yr ) .
T( x , y ) is a value with sum of R( x , y ) , G( x , y ) and r
Fig. 7. Unwarping Process.
r
B( x , y ) equal to a predefined overheat color tone
B. Algorithm for machine condition monitoring The algorithm for machine condition monitoring is summarized as below: Step 1: Acquire omnidirectional image from thermal camera into laptop. Step 2: Unwarp the omnidirectional thermal image into panoramic thermal image using log-polar mapping technique. Step 3: Partition the region of interest (ROI) of the unwarped panoramic image into n sections horizontally where n = number of machines. Step 4: Define mn = ( xmin( n ) : xmax( n ) , ymin( n ) : ymax( n ) ) be the dimension of the partition, separate the ROI of the image into (n) xmax mn = ( xmax( n −1) + 1 , ymin : ymax ) (8) nmax An example of partitioning of ROI for machine condition monitoring system is shown in Fig. 8 with m1 = (1 : 107,1 : 60) , m 2 = (108 : 214,1 : 60) , m3 = (215 : 320,1 : 60)
value, For example, if machines exceed 55.7°C is consider overheat, then T( xr , yr ) is the total sum of
R( x , y ) , G( x , y ) and B( x , y ) for the color tone value as shown in reference point in Fig. 9. Step 7: Compare T( x , y ) with T( xr , yr ) in each machine’s section. If T( x , y ) ≥ T( xr , yr ) , then overheat take place at pixel (x,y), else if T( x , y ) < T( xr , yr ) , then
no
overheat take place at pixel (x,y). A variable h is used to gather the number of pixels in concern:
T( x , y ) ≥ T( xr , yr ) → hi = 1 for T( x , y ) < T( xr , yr ) → hi = 0
(10)
where i as the sequence number of scanned pixel. Step 8: Define the minimum overheat size of a machine, S. If total overheated pixels in a section are more than S, then the machine in that particular section is said to be overheated, else the machine in that section is consider function in normal condition.
total pixel hi ≥ S →Machine overheat ∑ i =1 for total pixel ∑ hi < S →Machine not overheat i =1
(11)
Fig. 8: Partitioning of ROI for machine condition monitoring system.
Step 5: Calculate the sum of RGB elements for each pixel (x, y) using:
T( x , y ) = R( x , y ) + G( x , y ) + B( x , y )
(9)
where R( x , y ) is the value of red element of pixel (x,y); G( x , y ) is the value of green element of pixel (x,y) and B( x , y ) is the value of blue element of pixel(x,y). Pixel with higher temperature will give higher T( x , y ) value. For example, at a reference point as shown in Fig. 9, T(197 ,88) = 243 + 113 + 0 = 256 .
IV. E XPERIMENTAL RESULT In this section, we briefly illustrate the application of the proposed omnidirectional thermal imaging system for machine condition monitoring. We select a three machines case for studies. The omnidirectional thermal images for the functioning machines are collected at the Applied Mechanics Lab in Faculty of Engineering and Technology, Multimedia University.
Fig. 10: Case studies of machines for monitoring captured in Applied Mechanical Lab (Digital Color Form).
Fig. 11: Case studies for machines for monitoring captured in Applied Mechanics Lab (Thermal image, all machines are functioning in overheat condition)
Fig. 12: Unwarp form of Fig.10 (digital color panoramic form)
Fig. 13: Unwarp form of Fig.11 (thermal image panoramic form)
An omnidirectional image captured by using digital camera on the site is shown in Fig. 10. An omnidirectional thermal image is also captured by using thermal camera on the site based on three machines are functioning in overheat condition, as shown in Fig. 11. The unwarped form of Fig. 10 (digital color panoramic form) is shown in Fig. 12 whereas the unwarp form of Fig.11 (thermal image
panoramic form) is shown in Fig. 13 respectively. In Fig. 13, the log-polar mapping process is by 4:1 reduction mapping scale, which means that 320 X 240 omnidirectional thermal image’s Cartesian pixels are mapped to one fourth of the thermal image Cartesian pixels (320 X 60) in panoramic view, with four fold data compression compare to original omnidirectional thermal image as in Fig. 11. In Fig. 13, Machine A (leftmost) and Machine C (rightmost) are vibro test machines with same model and same specs, where as Machine B (center) is a fatigue test machine with cooling system. The motors of machine A, B and C are considered to be overheated when it reaches 90˚C. Hence we set the temperature measurement range on thermal camera from 80˚C to 90˚C. The temperature level display on captured thermal images are with different color tones ranging from black, blue, magenta, orange, yellow, light yellow to white represents each step size of temperature range display on the thermal camera. The actual size of the machines appear in the thermal image is approximately 105 pixels for machine A, 288 pixels for machine B, 60 pixels for machine C. S is the minimum size of the machines appear in the image. By running test on 1000 samples thermal images for different S varying from 10%, 20% … 100% of actual size of the machines appear in the thermal image, the optimum value of S is at 50% of actual machine size, i.e with higher accuracy. Hence, we set S = 53 pixels for machine A, S = 144 pixels for machine B and S = 30 pixels. The possible machines condition can be divided into 8 major classes, namely: All the machines function properly (none of the machines overheat); Machine A overheat; Machine B overheat; Machine C overheat; Machine A and B overheat; Machine B and C overheat; Machine A and C overheat; Machine A, B and C overheat. The algorithm for machine condition monitoring was evaluated with respect to the thermal images captured live, unwarped into panoramic view and displayed on monitor screen as interpreted by an operator (human observer) the overall description of which could be called the “Operator Perceived Activity” (OPA) [14]. The operator will comments on the images captured by the thermal camera, whether the observed particular machine is overheated or not and compare with that detected by the omnidirectional thermal imaging system. From the total of 10,000 captured and unwarped images, 9633 images were tracked perfectly (machines conditions agreed by both observer and omnidirectional thermal imaging system), that is an accuracy of 96.33%. The omnidirectional thermal imaging system is also function in a fast way whereby the routine time required capturing in a thermal image, unwarped it into panoramic form and detect the machines condition until the signal alarm or not is only 3 seconds. V.
CONCLUSION
In this paper, we proposed an omnidirectional thermal imaging system for machine condition monitoring. A specific designed and custom made IR reflected hyperbolic mirror set (mirror + holder) is fabricated for obtaining 360 degree viewing of a location to be monitored. Log-polar mapping technique is applied in the imaging system for
unwarping the captured omnidirectional thermal image into panoramic form. A simple and fast machine condition monitoring algorithm had been developed that can be used for monitoring the functioning condition of different machines in a factory site. The experimental results show that the proposed omidirectional thermal imaging system achieves high accuracy in monitoring machines conditions. In future, an automatic power supply control system will be added to the machine condition monitoring system. When the monitoring system detected any of the machines overheated, the automatic power supply control system will cut off the power supply of the respective machine(s). This enhancement can reduce hands on workload, man power and maintenance time. Since IR radiation from an object is due to the thermal radiation, and not the light reflected from the object, the omnidirectional thermal imaging system proposed in this paper can be conveniently used for security purpose such as trespasser detection in night vision. This will be addressed in future work. REFERENCES [1] Thermographic camera Retrieved August 18, 2008, from Wikipedia, the free encyclopaedia Web Site: http://en.wikipedia.org/wiki/Thermal_camera [2] W.K.Wong, P.N.Tan, C.K.Loo, and W.S.Lim, "An Effective Surveillance System Using Thermal Camera", 2009 International Conference on Signal Acquisition and Processing(ICSAP 2009), 35,Apr 2009, Kuala Lumpur, Malaysia, p.p.13-17. [3] J. Chahl and M. Srinivasan, “Reflective surfaces for panoramic imaging”, Applied Optics, 36(31), Nov 1997, p.p.8275-85. [4] S. Gachter, “Mirror Design for an Omnidirectional Camera with a Uniform Cylindrical Projection when Using the SVAVISCA Sensor”, Research Reports of CMP, OMNIVIEWS Project, Czech Technical University in Prague, No. 3, 2001. Redirected from: http://cmp.felk.cvut.cz/projects/omniviews/ [5] T. Svoboda, Central Panoramic Cameras Design, Geometry, Egomotion. PhD Theses, Center of Machine Perception, Czech Technical University in Prague, 1999. [6] http://www.flirthemography.com [7] H. Araujo, J. M. Dias, “An Introduction To The Log-polar Mapping”, Proceedings of 2nd Workshop on Cybernetic Vision, 1996, p.p. 139144. [8] C. F. R. Weiman and G. Chaikin, “Logarithmic Spiral Grids For Image Processing And Display”, Computer Graphics and Image Processing, Vol. 11, 1979, p.p. 197-226. [9] LIRA Lab, Document on specification, Tech. report, Espirit Project n. 31951 – SVAVISCA- available at http://www.lira.dist.unige.it. [10] R. Wodnicki, G. W. Roberts, and M. D. Levine, “A foveated image sensor in standard CMOS technology”, Custom Integrated Circuits Conf. Santa Clara, May 1995, p.p. 357-360. [11] F. Jurie, “A new log-polar mapping for space variant imaging: Application to face detection and tracking”, Pattern Recognition,Elsevier Science, 32:55, 1999, p.p. 865-875. [12] V. J. Traver, “Motion estimation algorithms in log-polar images and application to monocular active tracking”, PhD thesis, Dep. Llenguatges. [13] R. Wodnicki, G. W. Roberts, and M. D. Levine, “A foveated image sensor in standard CMOS technology”, Custom Integrated Circuits Conf. Santa Clara, May 1995, p.p. 357-360. [14] J. Owens, A. Hunter and E. Fletcher, “A Fast Model–Free Morphology–Based Object Tracking Algorithm”, British Machine Vision Conference, p.p. 767-776, 2002