fallacy as a memory kludge. American Economic Journal: Microeconomics 3(4):35â67. Barracliffe, L.; Arandjelovic, O.; and Humphris, G. 2017. Can machine ...
Machine Learning Based Prediction of Consumer Purchasing Decisions: The Evidence and Its Significance Saavi Stubseid and Ognjen Arandjelovi´c School of Computer Science University of St Andrews St Andrews, Fife, KY16 9SX United Kingdom Abstract Every day consumers make decisions on whether or not to buy a product. In some cases the decision is based solely on price but in many instances the purchasing decision is more complex, and many more factors might be considered before the final commitment is made. In an effort to make purchasing more likely, in addition to considering the asking price, companies frequently introduce additional elements to the offer which are aimed at increasing the perceived value of the purchase. The goal of the present work is to examine using data driven machine learning, whether specific objective and readily measurable factors influence customers’ decisions. These factors inevitably vary to a degree from consumer to consumer so a combination of external factors, combined with the details processed at the time the price of a product is learnt, form a set of independent variables that contextualize purchasing behaviour. Using a large real world data set (which will be made public following the publication of this work), we present a series of experiments, analyse and compare the performances of different machine learning techniques, and discuss the significance of the findings in the context of public policy and consumer education.
Introduction We humans like to think of ourselves as highly self-aware agents, capable of critical reflection and rational decisionmaking aligned with our best interests (Fox 2011). Yet, a wealth of evidence from a broad range of fields of study, including economics, psychology, and neurology, reveals a different picture. Our choices are mired with various biases and are affected significantly by confounding factors, irrelevant to the problem at hand (Coeurdacier and Rey 2013). Examples are numerous and include the anchoring bias (Bodenhausen, Gabriel, and Lineberger 2000), the sunk cost (Baliga and Ely 2011) and the gambler’s fallacies (Griffiths 1994), and many others (Arandjelovi´c 2017; Beykikhoshk et al. 2017; Arandjelovi´c 2016).
Context and broad motivation In the context of our everyday lives, the ability to make rational decisions is particularly important in the realm of fic 2018, Association for the Advancement of Artificial Copyright Intelligence (www.aaai.org). All rights reserved.
nances (Cross 1993). For better or worse, material wealth affects just about every aspect of our daily experience. In general, being richer allows a greater proportion of one’s time to be spent on leisure activities (Bittman 1999), enables the consumption of a higher quality diet (Darmon and Drewnowski 2008), better access to health care (DeVoe et al. 2007), and confers numerous other benefits and advantages. Therefore it is clear that the spectrum of financial decisions which individuals are confronted with on a daily basis, form a particularly interesting domain in which rational decisionmaking is especially relevant. Considering the aforementioned impact that one’s finances have on their lifestyle, it would be tempting and seemingly reasonable to hypothesise that individuals would be especially alert when reasoning in this context, and thus less likely to make errors of judgment. However, quite the opposite is the case, with a convincing body of evidence demonstrating that many biases noted earlier are particularly clearly exhibited precisely in financial decisionmaking. An example is that of the sunk cost fallacy (Baliga and Ely 2011), whereby a bad investment strategy is continued knowingly based on the level of prior and unrecoverable investment, rather than rationally terminated based on the expected future return. Indeed, this fallacy is so pervasive that it is widely recognized even in everyday speech and being poignantly described as “throwing good money after bad”. Another ubiquitous example is that of the gambler’s fallacy (Griffiths 1994) at the crux of which is the statistically irrational belief that following a streak of undesirable outcomes of a series of independent random events (such as coin tosses or dealt card hands), a desirable outcome is more likely.
Problem statement One of the most common financial decisions that each of us makes on a nearly daily basis involves the purchasing of various products, goods, and services. In some cases the decision on whether or not to make a purchase is based largely on price but in many instances the purchasing decision is more complex, with many more considerations affecting the decision-making process before the final commitment is made. Retailers understand this well and attempt to make use of it in an effort to gain an edge in a highly competitive market. Specifically, in an effort to make pur-
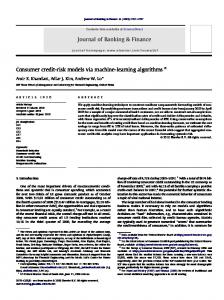
Figure 1: Proportion of adult individuals in the UK who make an online purchase in a specific product category in an average month, stratified by sex, with blue bars corresponding to female consumers, and green bars to male (top and bottom, within a pair associated with a product category, if viewed in greyscale). chasing more likely, in addition to balancing the saleability and profit in setting the selling price of a product, companies frequently introduce additional elements to the offer which are aimed at increasing the perceived value of the purchase to the consumer. Our goal herein is to examine, using data driven machine learning, whether specific objective and readily measurable factors influence customer decisions. The specific factors which affect a purchasing decision inevitably vary to a degree from one consumer to another. This observation has a twofold effect in the context of the present work. Firstly, it suggests that some of the predictive power is likely to be found in demographic information on the consumer e.g. the consumer’s age, sex, income, and education. Secondly, it motivates the use of machine learning so that the effects of each of these consumer specific variables can be learnt from data. Other variables of interest centre around the product itself, and the manner in which its purchase is presented. The price of the product offered, its category (electronics, entertainment, household goods, perishability etc), discounts, gifts, and other similar features, fall within this group of potentially relevant variables. Hence a combination of external factors combined with the details processed at the time the price of a product is learnt, as illustrated in Figure 1, form a set of independent variables that contextualize purchasing behaviour. These are elaborated on later, in a section in which we explain our data set and technical methodology.
Related work Considering the implications, both to companies seeking to make profit by increasing their sales and to consumers seeking better control over their decisions, it is of little surprise that the broad topic of studying different factors which af-
fect one’s decision to buy a product has already attracted a considerable amount of research attention (Sifa et al. 2015; Xie et al. 2009; Asghar 2016; Kaefer, Heilman, and Ramenofsky 2005). Universally, there has been a recognition of the importance of features of the product itself, demographic factors, and the purchasing context (both proximal and distal, including issues such as indebtedness (Ladas et al. 2014)). Using decision trees and regression models Sifa et al. (2015) identified a number of controllable factors of importance – such as the number of ‘interactions’, ‘playtime’, and ‘location’, to name a few – which gives us finer-grained insight into what affects a consumer’s decision to purchase. The finding that, for example, optimizing over parameters such as so-called playtime (e.g. by creating more levels in a game) has the potential of increasing in-game sales (Sifa et al. 2015) can be reasonably expected to have generalizable applicability. Suh et al. (2004) proposed a methodology for predicting customers’ purchase decisions to support realtime web marketing. Kaefer, Heilman, and Ramenofsky (2005) used neural networks to predict the timing of marketing new products, by classifying new consumers in a binary fashion, as either ‘bad’ or ‘good’. Tuarob (2013) used data from social media in order to forecast product sales. Their results showed promising results in the prediction sales of popular smartphones up to three months in advance. Larivi`ere and Van den Poel (2005) deployed random forest techniques on a real world data set in order to understand and predict three important measures of customer outcomes: next buy, partial defection (cancelling a product), and customers’ profitability evolution. An interesting discovery emerging from their work was that different input variables were found to have the greatest impact in the context of the three aforementioned predictions of interest (Larivi`ere and Van den Poel 2005). The challenges of retaining customer churn (Xie et al. 2009) and increasing customer loyalty have also been attracting increasing attention in the machine learning community (Xie et al. 2009; Buckinx, Verstraeten, and Van den Poel 2007; Sifa et al. 2015). The reason from the point of view of retailers is clear: revealing possibly complex and context dependent features of purchasing situations can be extremely valuable in making the most of the customer’s buying potential (Buckinx, Verstraeten, and Van den Poel 2007). The existing research though limited (as we shall discuss shortly) provides promising evidence that the analysis of purchasing decisions can be used to derive useful insight to predict consumer behaviour and decisions, and together with human interpretation and analysis can provide competitive advantage to retailers and service providers.
Limitations of previous work Notwithstanding the promising results reported in the existing literature, the current work in the field of analysis of purchasing behaviour is limited by several factors. Firstly, much of it relies on subjective interpretation of factors which are not readily measurable, thus failing to meet the objectives and criteria motivating the present work which focuses on
selected on the basis of their widespread use, well understood behaviour, and promising performance in a variety of other classification tasks. Moreover, both are readily applicable on data with heterogeneous features, some of which may be categorical and some continuous, and which may have values of vastly different ranges (Tun, Arandjelovi´c, and Caie 2018). Our goal was also to compare classifiers which are based on different assumptions on the relationship between different features, as well as classifiers which differ in terms of the functional forms of classification boundaries they can learn. The two compared classifiers are na¨ıve Bayes (Jordan 2002; Nigri and Arandjelovi´c 2017b; Beykikhoshk et al. 2015; Birkett, Arandjelovi´c, and Humphris 2017; Karsten and Arandjelovi´c 2017) and random forest based classifiers (Breiman 2001; Nigri and Arandjelovi´c 2017a; Barracliffe, Arandjelovi´c, and Humphris 2017). For completeness we summarize the key aspects of each next. Figure 2: Our data set is balanced in terms of the class representation of the ultimate outcome of interest: the final purchase decision. Shown are the total numbers of decisions to purchase (red bar on the right) and not to purchase (blue bar on the left) in the collected corpus of purchasing decision situations.
Na¨ıve Bayes classification Na¨ıve Bayes classification applies the Bayes theorem by making the ‘na¨ıve’ assumption of feature independence. Formally, given a set of n features x1 , . . . , xn , the associated pattern is deemed as belonging to the class y which satisfies the following condition: y = arg max P (Kj ) j
quantitative, data driven analysis. Moreover, previous studies of the subject are virtually universally restricted in their scope to a specific context (e.g. industry or product type). In contrast, the data used in our work (described in the next section) includes a broad range of product categories, is collected by actual retailers, and is to the best of the authors’ knowledge, the largest data set employed to date.
Methodology In this section we summarize the key technical details of the present work. The most important aspects of our data set are described first, followed by a description of the classification methodologies adopted and the reasons for our choices.
Data Our data corpus contains 642,709 entries, each of which corresponds to a specific purchasing decision by a consumer i.e. it is associated with a single person and a single product under the consideration. The ultimate outcome of interest is the decision made by the consumer on whether or not to purchase. Each scenario is characterized by 72 features selected as potentially having predictive power in the described context. Henceforth we shall refer to these as C1 , . . . , C72 , and to the target class to be predicted (that is, the purchasing decision) as Ck . The data has been decontextualized so that the meaning of each variable has been obscured by hashing. Some variables are continuous and others discrete, some numeric and others textual. A small illustrative sample is shown in Table 1.
Classification methodologies For our experiments we adopted the use of two different, well-known classification approaches. These were primarily
n Y
p(xi |Kj )
(1)
i=1
where P (Kj ) is the prior probability of the class Kj , and p(xi |Kj ) the conditional probability of the feature xi given class Kj (readily estimated from data using a supervised learning framework) (Bishop 2007). Random forests Random forest classifiers fall under the broad umbrella of ensemble based learning methods (Breiman 2001). They are simple to implement, fast in operation, and have proven to be extremely successful in a variety of domains (Bosch, Zisserman, and Munoz 2007; Cutler et al. 2007; Ghosh and Manjunath 2013). The key principle underlying the random forest approach comprises the construction of many “simple” decision trees in the training stage and the majority vote (mode) across them in the classification stage. Amongst other benefits, this voting strategy has the effect of correcting for the undesirable property of decision trees to overfit training data (Zadrozny and Elkan 2001). In the training stage the random forest classifier applies the general technique known as bagging (Breiman 1996) to individual trees in the ensemble. Bagging repeatedly selects a random sample with replacement from the training set and fits trees to these samples. Each tree is grown without pruning. The number of trees in the ensemble is a free parameter which is readily learnt automatically using the so-called out-of-bag error (Breiman 2001); this approach is adopted in the present work as well.
Results and discussion Experiments were performed using the standard 5-fold cross-validation protocol in an effort to minimize the potential of overfitting. For the random forest based classifier we used the forest size of 100 trees, each trained for the maximum depth of 10.
Table 1: A small illustrative sample of entries in our data set which contains 642,709 consumer decisions to purchase or not to purchase a specific product. Transaction #
Feature 1 (C1 )
Feature 2 (C2 )
...
Feature 72 (C72 )
1
BC5F4DF1E7
1582934400
...
-0.1216277
No purchase (0)
2 .. .
0AB04FC49F
1585612800
...
-0.5361754
Purchase (1)
642,709
055D5DBE79
1596153600
...
+0.56486328
Purchase (1)
Table 2: A summary of the key ‘coarse’ performance statistics of the two classifiers used in our experiments. It can be readily seen that the random forest based classifier outperformed the simple na¨ıve Bayes approach substantially, the improvement being apparent in all performance measures (approximately 10% improvement in each case). Measure
Na¨ıve Bayes
Random forest
Accuracy
0.66
0.72
AUC
0.71
0.79
F1-score
0.66
0.72
We started our evaluation by examining and comparing ‘coarse’ performance statistics of the two classifiers: the average classification accuracy, the area under curve (AUC) of the precision-recall characteristic, and the F1-score. The key results are summarized in Table 2. It can be readily seen that the random forest based classifier outperformed the simple na¨ıve Bayes approach substantially, the improvement being apparent in all performance measures (approximately 10% improvement in each case). More nuanced insight can be gained by examining the confusion matrices corresponding to the two methods – these are shown in Figure 3. What is interesting to observe from this figure is that the methods performed nearly identically when the purchasing decision was negative (i.e. no purchase was made). The performance improvement witnessed by the statistics in Table 2 can be seen to emerge from predictions relating to instances when the customer did choose to pursue a purchase. Considering that our data is balanced in terms of the representation of the two classes (see previous section and Figure 2 in particular), this phenomenon cannot be explained as a result of an artefact in the data. Rather the explanation has to be that the interaction of different features describing the purchasing context interact in a more nuanced way when the customer goes ahead with the purchase, which can be captured by a more complex classi-
Consumer decision (C)
fier such as one based on a random forest but not by a simple na¨ıve Bayes approach. In particular, considering the fundamental assumption underpinning the latter (recall that the interpretability of classification was one of our reasons for selecting these specific classifiers, as described in the previous section), we are led to conclude that there is a greater degree of interaction and a decrease of independence between features when the customer makes a positive purchasing decision. This explanation also resonates with our intuition: a decision to purchase implies a financial commitment and a loss of money, motivating a more in-depth thought process. Indeed, this explanation is further corroborated by the analysis of the importance of different features summarized in Figure 4. Importance was quantified using the standard approach introduced by Breiman (2001) which is based on the generation of random permutations of features and a comparison of the results using such features with a trained forest. The important observation to take from this figure concerns the error bars (i.e. the standard deviations) which are very broad. This suggests, corroborating our previous observations, that there is a high degree of redundancy between different features. Finally, we illustrated this by performing a feature selection process, and comparing classification performance using a reduced set of features with the results detailed earlier, using the entire input space. In particular, we adopted an iterative approach whereby (i) the most important feature was discovered using Breiman’s method (Breiman 1996), (ii) the feature was selected and thus removed from the available set, and (iii) the importance of the remaining features reevaluated. This is in effect a greedy approach to feature selection. Our results are summarized in Table 3. As the statistics in the table make apparent, the input feature set was reduced by 70% (from 72 to 22) virtually without any negative effect on classification performance in terms of average classification accuracy, AUC, and F1-score.
Conclusions In this paper we studied the challenge of predicting consumer purchasing decisions using readily measurable features of the purchasing context. Contrasting previous work, herein we did not restrict our attention to a specific product category, retailer type, or customer demographic, but rather used a large and diverse data set collected in the ‘real world’
(a) Na¨ıve Bayes
(b) Random forest
Figure 3: Confusion matrices corresponding to the na¨ıve Bayes (left) and random forest (right) based classifiers. It is important to observe that the methods performed nearly identically when the purchasing decision was negative (i.e. no purchase was made). The performance improvement witnessed by the statistics in Table 2 can be seen to emerge from predictions relating to instances when the customer did choose to pursue a purchase. This suggests that there is a greater degree of interaction and a decrease of independence between features when the customer makes a positive purchasing decision (see main text for more detail, as well as Figure 4).
Table 3: A summary of the key ‘coarse’ performance statistics of the random forest based classifier comparing its performance when all available input features are used (72 in total) vs. using the 22 most important features only, selected in a greedy fashion with importance reevaluation each time a feature is selected. Feature set Measure
All (72)
Most important (22)
Accuracy
0.72
0.71
AUC
0.79
0.78
F1-score
0.72
0.71
from actual customer-product interaction events. Moreover, our approach is thoroughly data driven and unlike most existing research in the field, does not use any subjective judgments or a priori assumptions. Adding to the importance of our work is the fact that the data set used in the experiments we describe is, to the best of our knowledge, the largest one used in the published, peer reviewed, scholarly literature. Our results provide a number of novel insights
into consumer behaviour, amongst others evidence of different thought processes taking place in the committal buying action from those underlying the conservative decision not to go ahead with the purchase. The presented findings and the accompanying discussion highlight avenues for future research, provide valuable knowledge both to consumers, and retailers and service providers.
References Arandjelovi´c, O. 2016. On normative judgments and ethics. BMC Medical Ethics 17(1):75. Arandjelovi´c, O. 2017. Technical rigour, exaggeration, and peer reviewing in the publishing of medical research: dangerous tides and a case study. Current Research in Diabetes & Obesity Journal (special issue on Transparency in Review) 4(4). Asghar, N. 2016. Yelp dataset challenge: Review rating prediction. arXiv preprint arXiv:1605.05362. Baliga, S., and Ely, J. C. 2011. Mnemonomics: the sunk cost fallacy as a memory kludge. American Economic Journal: Microeconomics 3(4):35–67. Barracliffe, L.; Arandjelovi´c, O.; and Humphris, G. 2017. Can machine learning predict healthcare professionals’ responses to patient emotions? In Proc. International Conference on Bioinformatics and Computational Biology 101– 106.
(a) Feature group 1
(b) Feature group 2
(c) Feature group 3
Figure 4: Input feature importance quantified using the standard approach based on the generation of random permutations of features, introduced by Breiman (2001). Shown is the mean importance of each feature and the corresponding error bars (plus/minus one standard deviation).
Beykikhoshk, A.; Arandjelovi´c, O.; Phung, D.; Venkatesh, S.; and Caelli, T. 2015. Using Twitter to learn about the autism community. Social Network Analysis and Mining 5(1):5–22. Beykikhoshk, A.; Arandjelovi´c, O.; Phung, D.; and Venkatesh, S. 2017. Discovering topic structures of a temporally evolving document corpus. Knowledge and Information Systems. DOI: 10.1007/s10115-017-1095-4. Birkett, C.; Arandjelovi´c, O.; and Humphris, G. 2017. Towards objective and reproducible study of patient-doctor interaction: automatic text analysis based VR-CoDES annotation of consultation transcripts. In Proc. International Conference of the IEEE Engineering in Medicine and Biology Society 2638–2641. Bishop, C. M. 2007. Pattern Recognition and Machine Learning. New York, USA: Springer-Verlag. Bittman, M. 1999. Social participation and family welfare: The money and time costs of leisure. Technical report. Bodenhausen, G. V.; Gabriel, S.; and Lineberger, M. 2000. Sadness and susceptibility to judgmental bias: The case of anchoring. Psychological Science 11(4):320–323. Bosch, A.; Zisserman, A.; and Munoz, X. 2007. Image classification using random forests and ferns. In Proc. IEEE International Conference on Computer Vision 1–8. Breiman, L. 1996. Bagging predictors. Machine Learning 24(2):123–140. Breiman, L. 2001. Random forests. Machine Learning 45(1):5–32. Buckinx, W.; Verstraeten, G.; and Van den Poel, D. 2007. Predicting customer loyalty using the internal transactional database. Expert Systems with Applications 32(1):125–134. Coeurdacier, N., and Rey, H. 2013. Home bias in open economy financial macroeconomics. Journal of Economic Literature 51(1):63–115. Cross, G. S. 1993. Time and money: The making of consumer culture. Routledge. Cutler, D. R.; Edwards, T. C.; Beard, K. H.; Cutler, A.; Hess, K. T.; Gibson, J.; and Lawler, J. J. 2007. Random forests for classification in ecology. Ecology 88(11):2783–2792. Darmon, N., and Drewnowski, A. 2008. Does social class predict diet quality? The American journal of clinical nutrition 87(5):1107–1117. DeVoe, J. E.; Baez, A.; Angier, H.; Krois, L.; Edlund, C.; and Carney, P. A. 2007. Insurance+access6= health care: Typology of barriers to health care access for low-income families. The Annals of Family Medicine 5(6):511–518. Fox, J. 2011. The myth of the rational market: a history of risk, reward, and delusion on Wall Street. Harriman House Limited. Ghosh, P., and Manjunath, B. 2013. Robust simultaneous registration and segmentation with sparse error reconstruction. IEEE Transactions on Pattern Analysis and Machine Intelligence 35(2):425–436. Griffiths, M. D. 1994. The role of cognitive bias and skill
in fruit machine gambling. British Journal of Psychology 85(3):351–369. Jordan, A. 2002. On discriminative vs. generative classifiers: a comparison of logistic regression and naive Bayes. Advances in Neural Information Processing Systems 14:841. Kaefer, F.; Heilman, C. M.; and Ramenofsky, S. D. 2005. A neural network application to consumer classification to improve the timing of direct marketing activities. Computers & Operations Research 32(10):2595–2615. Karsten, J., and Arandjelovi´c, O. 2017. Automatic vertebrae localization from CT scans using volumetric descriptors. In Proc. International Conference of the IEEE Engineering in Medicine and Biology Society 576–579. Ladas, A.; Garibaldi, J.; Scarpel, R.; and Aickelin, U. 2014. Augmented neural networks for modelling consumer indebtness (sic). In Proc. IEEE International Joint Conference on Neural Networks 3086–3093. Larivi`ere, B., and Van den Poel, D. 2005. Predicting customer retention and profitability by using random forests and regression forests techniques. Expert Systems with Applications 29(2):472–484. Nigri, E., and Arandjelovi´c, O. 2017a. Light curve analysis from Kepler spacecraft collected data. In Proc. ACM International Conference on Multimedia Retrieval 93–98. Nigri, E., and Arandjelovi´c, O. 2017b. Machine learning based detection of Kepler objects of interest. In Proc. ICME
Workshop on Emerging Multimedia Systems and Applications 186–191. Sifa, R.; Hadiji, F.; Runge, J.; Drachen, A.; Kersting, K.; and Bauckhage, C. 2015. Predicting purchase decisions in mobile free-to-play games. In Proc. Conference on Artificial Intelligence and Interactive Digital Entertainment. Suh, E.; Lim, S.; Hwang, H.; and Kim, S. 2004. A prediction model for the purchase probability of anonymous customers to support real time web marketing: a case study. Expert Systems with Applications 27(2):245–255. Tuarob, S.and Tucker, C. S. 2013. Fad or here to stay: Predicting product market adoption and longevity using large scale, social media data. In Proc. International Design Engineering Technical Conferences and Computers and Information in Engineering V02BT02A012–V02BT02A012. Tun, W.; Arandjelovi´c, O.; and Caie, D. P. 2018. Using machine learning and urine cytology for bladder cancer prescreening and patient stratification. In Proc. AAAI Conference on Artificial Intelligence Workshop on Health Intelligence. Xie, Y.; Li, X.; Ngai, E.; and Ying, W. 2009. Customer churn prediction using improved balanced random forests. Expert Systems with Applications 36(3):5445–5449. Zadrozny, B., and Elkan, C. 2001. Obtaining calibrated probability estimates from decision trees and naive Bayesian classifiers. In Proc. IMLS International Conference on Machine Learning 1:609–616.