Machine Learning in Falls Prediction; A cognition-based predictor of falls for the acute neurological in-patient population
Mr. B.A. Mateen1 Mr. M. Bussas2 Dr. C. Doogan 3 Dr. D. Waller4 Dr. A. Saverino5 Dr. F. J. Király2,6* Prof. E. D. Playford3,7 1
University College London, London, UK Department of Statistical Science, University College London, London, UK 3 Therapy and Rehabilitation Services, National Hospital for Neurology & Neurosurgery, London, UK 4 Neurorehabilitation Unit, National Hospital for Neurology and Neurosurgery, London, UK 5 Wolfson Neuro Rehabilitation Centre, St Georges Hospital, London, UK 6 The Alan Turing Institute, London, UK 7 Institute of Neurology, University College London, London, UK 2
Author for correspondence (*): Dr. Franz J. Király Department of Statistical Science,
University College London,
Gower Street
London WC1E 6BT
United Kingdom
Tel.: +44 - 20 - 7679 1259
Fax.: +44 - 20 - 3108 3105
E-mail:
[email protected]
Declarations – Dr Diane Playford was supported by the National Institute for Health Research University College London Hospitals Biomedical Research Centre. The authors have no conflict of interests to declare. This study received no funding.
Contributions – BAM and EDP conceived and planned the study with contribution from CD, DW and AS. BAM collected the data under the supervision of DW and EDP. Statistical analysis conducted by MB under the supervision of FJK, with contributions from BAM. Manuscript written by BAM and FJK, under the supervision of EDP.
Abstract Background Information – Falls are associated with high direct and indirect costs, and significant morbidity and mortality for patients. Pathological falls are usually a result of a compromised motor system, and/or cognition. Very little research has been conducted on predicting falls based on this premise.
Aims – To demonstrate that cognitive and motor tests can be used to create a robust predictive tool for falls.
Methods – Three tests of attention and executive function (Stroop, Trail Making, & Semantic Fluency), a measure of physical function (Walk-12), a series of questions (concerning recent falls, surgery and physical function) and demographic information were collected from a cohort of 323 patients at a tertiary neurological center. The principal outcome was a fall during the in-patient stay (n = 54). Data-driven, predictive modelling was employed to identify the statistical modelling strategies which are most accurate in predicting falls, and which yield the most parsimonious models of clinical relevance.
Results – The Trail test was identified as the best predictor of falls. Moreover, addition of any others variables, to the results of the Trail test did not improve the prediction (Wilcoxon signed-rank p < .001). The best statistical strategy for predicting falls was the random forest (Wilcoxon signed-rank p < .001), based solely on results of the Trail test. Tuning of the model results in the following optimized values: 68% (± 7.7) sensitivity, 90% (± 2.3) specificity, with a positive predictive value of 60%, when the relevant data is available.
Conclusion – Predictive modelling has identified a simple yet powerful machine learning prediction strategy based on a single clinical test, the Trail test. Predictive evaluation shows this strategy to be robust, suggesting predictive modelling and machine learning as the standard for future predictive tools.
Words - 284
2
Introduction The Cost and Prevalence of Falls, and Falls-related Injury Falls are a serious public health concern1, with potentially fatal consequences2, and significant financial implications for individuals, and their families3. In a single year in the USA, there were more than 10,000 fatal falls in the elderly population, and an additional 2.6 million medically treated falls-related injuries that were non-fatal, which resulted in a direct cost of close to US $20 billion4. In the UK, falls account for over 60% of all hospital inpatient related safety incidents5, resulting in an annual direct cost of £15 million6, on top of the billions already spent on treating falls-related injuries in the community that result in hospital admissions7,8. Some argue that if steps are not taken to address this problem, by the year 2030 the number of injuries resulting from falls will have increased by 100%9, therefore it is vital that steps are taken to prevent this astronomical rise in cost and harm to all the relevant stakeholders.
Clinical Relevance of Predicting Falls The current debate in the falls literature is whether probabilistic prediction is clinically useful, and whether it is more important than targeting modifiable risk factors10. We argue that these two approaches are not mutually exclusive, rather, making sound predictions is actually necessary for planning and evaluating interventions of any kind, including those targeted at risk factors11.
State of the Art and Challenges in Predicting Falls The STRATIFY Tool is the gold standard predictive tool for falls in geriatric patients. Although widely used in the UK, has not been improved upon in two decades12,13, due to two notorious key issues, which we explain and address in our study: (I) Reproducibility – replication studies have repeatedly failed to reproduce the reported good performance of the initial STRATIFY validation study14. This is due to the missing statistical evaluation in terms of expected performance on new, unseen data – which we address by predictive modelling and predictive model evaluation, including a precise quantification of expected future performance in a similar setting. (II) Interpretability – it has remained unclear what the STRATIFY Tool actually measures in terms of cognitive ability or physical function. Three of the five questions record confusion, visual
3
impairment, and frequent toileting, which, at best, are proxy measurements. We instead use direct measures of cognitive and physical function, such as the Trail test and the Walk-12, which are well-validated and readily interpretable.
Paradigm Shift I: Predictive Modelling Descriptive modelling, such as in traditional linear/logistic regression analysis, aims to fit the data well and is powerful for identifying associations present in the data. However, they often turn out to be too closely fitted to the data analyzed and do not generalize well to new, unseen data – this phenomenon is known as overfitting. We argue that this well-known phenomenon explains the supposed loss of predictiveness and accuracy in replication studies14 better than additional, hypothetical changes in the patient collective. On the other hand, models obtained by predictive model selection often contain less variables and generalize more robustly. The main difference between exploratory/descriptive and predictive modelling does not lie in the type of models applied (for example, linear or logistic regression models occur in both), but in how. The predictive modelling paradigm has led to the development of a number of non-linear modelling techniques found in the machine learning community such as kernel methods or random forests which are specifically designed to produce models that generalize well. Furthermore, the underlying theory15 provides explicit meta-methods to quantitatively estimate accuracy on unseen data, which is used to identify the best models and most informative variables, as opposed to descriptive approaches which rely on quantifying how accurately the model describes the available data. Our proposed solution is shift into the superior modelling paradigm, and subsequent evaluation of the results in terms of their out-of-sample error/predictive error. There are prior instances of assessing falls models via predictive evaluation16; however, to our knowledge, our work is the first instance where predictive model selection is employed not only to identify types of models but also the most relevant and clinically useful variables.
Paradigm Shift II: Direct Measurements of Neuropsychological and Physical Function The current state-of-art in predicting falls assesses patients based on risk factors such as age, urinary urgency, or walking impairment. We argue that these risk factors are in fact proxy measurements of cognitive and physical function. For example, the association between age and falls, can be thought of as a result of
4
declining executive function and attention17, and reduced mobility18, which both occur as we grow older. Both UTI-associated urinary urgency and the associated cognitive deficits can exacerbate the risk associated with any reductions in physical mobility19. Hence we propose the use of direct measurements of cognitive and physical function instead; a premise that the literature has alluded to increasingly often over the last few years20. In our study, we consider the Stroop Colour-Word test, the Trail Making test, a Semantic Fluency test as direct measurements of cognitive function, and a PROM of physical function.
5
Material and Methods
Neuropsychological Data The test battery (described in appendix) consisted of neuropsychological tests of attention and executive function (Stroop Colour-Word tests, the Trail Making tests, and a Semantic Fluency test), a PROM (Patient Reported Outcome Measure) of motor function (Walk-12), three questions relating to past 1 month’s medical history (undergone surgery; change in physical function; and, fallen over), and demographic data. Data was collected from a convenience sample (see appendix for recruitment details) of 323 patients from 3 neurosurgical, 3 neurological, and 2 neuro-rehabilitation wards, at a tertiary neuroscience center (summary statistics presented in appendix). The principal outcome in the prospective study was whether a patient fell (n = 54) or not during their in-patient stay (inclusion/exclusion criteria, cohort demographics, and summary statistics can be found in appendix). A fall was defined as a suspected, reported or witnessed incident, which consisted of unintentional contact with the ground (or intermediary object, which halted their progression to the floor, e.g. a wall), by any part of the body, except the feet. The additional distinction of recurrent falling has been disregarded in this study as a single fall is sufficient to cause injury. Predictive Modelling A predictive benchmark analysis (described in appendix) was carried out to identify which method can most reliably predict whether a patient is likely to fall. For each prediction strategy, goodness of prediction is estimated by repeatedly splitting the data into a training sample on which the model is fitted and a test sample which mimicks “new” data, and on which the model is evaluated by comparing its predictions to the actual labels (faller vs non-faller). All prediction strategies are compared on the same training/test splits, so that differences in performance can be attributed to the prediction strategy. The results of the predictive analysis are quantitative measures of how reliable each prediction strategy is in predicting new data, in terms of mean misclassification error (MMCE), sensitivity (= True Positive Rate), specificity (= True Negative Rate), precision (= Positive Predictive Value), and F1 score ( = 2 TP/(2 TP + FN + FP)).
6
The prediction strategies considered are different combinations of (i) the types of models used (summarized in table Y) and (ii) selected sub-sets of all variables in the data set to use in prediction. Different sets of variables are defined by using some or all of demographics, one or several of the three neurophysiological tests (Stroop, Trail, Semantic), and the Walk-12 PROM. For example, a (i) logistic regression model using (ii) demographic variables only. Standard errors for prediction error statistics were computed by Jackknife resampling on the test folds. The performance of two strategies was considered significantly different at 5% significance level of a Wilcoxon signed-rank test conducted on the paired sample of bootstrapped (by the Jackknife) error statistics on the test folds. A strategy was considered to predict better than an uninformed guess if had a significantly lower MMCE than the uninformed predictor of always predicting “non-faller”. Receiver Operator Characteristics (ROC) of prediction strategies were computed by varying the threshold for the predictive probability of the respective methods. Bootstrap confidence bands were computed for the false positive rate (= 1 – specificity) at a 5% level of confidence.
Ethical Considerations and Data Protection Guidance on the nature of the study was sought from the UK Health Research Authority (HRA) who determined that the appropriate designation was ‘Service Development’. The study was subsequently vetted by hospital governance and R&D groups. Patient (oral) consent to participate in the study was obtained and recorded in the clinical notes. Data analysis was conducted on a completely anonymised dataset. Non-anonymized data was stored securely for use by the patient’s clinical team, accessible only through the hospitals secured severs.
7
Results An overview of all of the results obtained in our predictive analysis can be found in the appendix. Below we present a selection of these results, focusing on the four most pertinent findings. 1. The Trail test, by itself, produces the best predictions. Moreover, addition of other neuropsychological, demographic, or physical function-related variables, to the Trail test data, doesn’t improve the model. Table 1 presents the goodness of prediction obtained from using only the demographical variables or variables from the three neuropsychological tests, or the Walk-12. The prediction goodness is reported for the best method, among those reported in the appendix. It may be observed that the trail test makes the best predictions (Wilcoxon signed-rank p < .001), though it should be mentioned that each neuropsychological test is missing for a different and substantial set of patients (around 1/3), therefore differences in measures of prediction goodness may in principle arise not only from the prediction strategy but also from the different patient sample. However, adding any of the other variables does not significantly improve the goodness of prediction (Wilcoxon signed-rank residuals p < .001) on the subsets of patients on which such predictions are possible (see appendix). Table 1: Best possible prediction from the five different variable sets. Dataset Utilized
Best Method
Mean Misclassificatio n Error (MMCE)
Sensitivity
Specificity
Precision
F1 - Score
Demographics
SVM (Gauss)
0.139 (± .019)
0.153 (± .049)
0.996 (± .004)
0.833 (± .118)
0.231 (± .075)
Stroop test
Naïve Bayes
0.153 (± .025)
0.508 (± .084)
0.924 (± .020)
0.585 (± .091)
0.371 (± .080)
Trail test
Random Forest
0.117 (± .022)
0.550 (± .083)
0.958 (± .015)
0.758 (± .085)
0.619 (± .071)
Semantic
LDA
0.161 (± .023)
0.245 (± .067)
0.965 (± .013)
0.604 (± .121)
0.311 (± .080)
Walk – 12
LDA
0.169 (± .024)
0.100 (± .045)
0.990 (± .007)
0.700 (± .230)
0.153 (± .074)
For each of the five variable sets (demographics and four neuropsychological tests, columns), the following are reported: the (subjectively chosen) best strategy of prediction for that variable set (second column), and measures of prediction goodness for that strategy, including Jackknife-estimated standard errors (five rightmost columns). Goodness of prediction is on the full population which has all variables predicted from available.
8
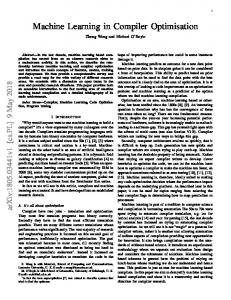
2. The best statistical strategy for predicting falls appears to be a random forest. Table 2 presents the goodness of prediction for selected prediction strategies on the patients which have the trail test available, hence differences are directly attributable to the method used. The results clearly demonstrate that the optimal (MMCE) values are produced by the random forest method, when compared with the logistic regression or majority prediction (Wilcoxon signed-rank on residuals p < .001). Moreover, the trail test appears superior to simple demographic data, such as age, which are well documented risk factors for falls across both model types (Wilcoxon signed-rank on residuals p < .001). Figure 1 compares the receiver operating characteristics (ROC) for the two Logistic Regression baselines as well as the Random Forest method. Table 2: Comparison of selected methods on patients with available trail test.
Method
Data Utilized
Mean Misclassification Error (MMCE)
Sensitivity
Specificity
Precision
F1 - Score
Random Forest
Trail Test
0.117 (± .022)
0.550 (± .083)
0.958 (± .015)
0.758 (± .085)
0.619 (± .071)
Demographics
0.166 (± .026)
0.200 (± .068)
0.976 (± .012)
0.667 (± .148)
0.293 (± .089)
Trail Test
0.150 (± .025)
0.400 (± .081)
0.953 (± .016)
0.675 (± .104)
0.487 (± .081)
Demographics
0.199 (± .028)
0.033 (± .027)
0.976 (± .012)
0.167 (± .223)
0.040 (± .047)
0.184 (± .027)
0.000 (± .000)
1.000 (± .000)
-
0.000 (± .000)
Logistic Regression
Majority
The rows are different prediction strategies, determined by which method is used (first column), and which variables are predicted from (second column. Measures of prediction goodness for that strategy, including Jackknife-estimated standard errors (five rightmost columns). Goodness of prediction is on the population which has the trail test available. Note that all patients with trail test available also have the demographics variables available.
9
Figure 1 – The Receiver Operating Characteristics (ROC) for Random Forest and Logistic Regression based classifiers The data sets upon which the following ROCs are based was the restricted data set consisting of those with trail data (excluding those for which the trail data was missing). The figure illustrates the second conclusion that the random forest (RF) based predictor appears to be superior to that of logistic regression (LogReg) when both utilize only the Trails data. Moreover, both of these models are superior to the baseline model of demographic (Demog) data (consisting of common risk factors for falls) and the logistic regression, which suggests that direct cognitive and neuropsychological measurement (Trail) appear to improve predictive capabilities, at least in our dataset. The Area under the ROCs (AUROCs) are LogReg on Demog (0.65), LogReg on Trail (0.78), and RF on Trail (0.87).
3. The random forest strategy on the trail test is still the best method to predict falls after accounting for missing data. The above paragraphs show that random forest on the trail test can reliably predict falls on the patients who have a trail test recorded. Since the fact that a trail test recorded may introduce a bias, it needs to be checked how the predictive approach generalizes to the whole population. For this, prediction strategies which would use a trail test are replaced by the majority prediction (no fall) whenever the trail test is not available. It can be observed that the Random Forest utilizing Trail test data is still excellent in this real world setting, predicting better (Wilcoxon signed-rank on residuals p < .001) than the other methods considered. Table 3: Comparison of selected methods on the full patient population.
Prediction Model
Mean Misclassification Error (MMCE)
Sensitivity
Specificity
Precision
F1 - Score
0.119 (± .018)
0.409 (± .067)
0.975 (± .009)
0.758 (± .085)
0.508 (± .069)
0.157 (± .020)
0.080 (± .036)
0.990 (± .006)
0.667 (± .218)
0.125 (± .061)
0.140 (± .019)
0.294 (± .062)
0.972 (± .010)
0.675 (± .104)
0.392 (± .072)
Logistic Regression (Demographic Data)
0.160 (± .020)
0.000 (± .000)
1.000 (± .000)
-
0.000 (± .000)
Majority
0.160 (± .020)
0.000 (± .000)
1.000 (± .000)
-
0.000 (± .000)
Random Forest Tuned (Trail Test Population) & Majority (Remaining Population) Random Forest (Demographic Data) Logistic Regression (Trail Test Population) & Majority (Remaining Population)
The rows are different prediction strategies, determined by which method is used (first column), and which variables are predicted from (second column. Measures of prediction goodness for that strategy, including Jackknife-estimated standard errors (five rightmost columns). Goodness of prediction is on the full population. Whenever a trail test is not available for a prediction strategy that otherwise uses the trail test, a majority prediction is performed.
10
4. Altering the predictive threshold allows us to produce a highly specific and sensitive tool Threshold tuning allows us to trade off specificity for sensitivity of the random forest model. For example, on the trail sub-group, we are able to achieve 68% (± 7.7) sensitivity, 90% (± 2.3) specificity, 0.600 (± 7.6) precision, and 0.630 (± 0.063) F1-score. On the whole population where trail test data can be missing one obtains the following values: 51% (± 6.9) sensitivity, 94% (± 1.4) specificity, 0.600 (± 0.076) precision, and 0.533 (± .062) F1-score. When overall accuracy is the desired outcome, the model described here is capable of a maximum of 76% precision (PPV), with only a modest reduction in sensitivity (Table 2 and 3).
11
Discussion This study describes what we believe is the first attempt to develop a tool for falls prediction that uses cognitive variables in a predictive modelling context. The predictive paradigm, coupled with our unique data set, has identified a single cognitive test – the trail test – as the most informative predictor for falling in a neurological population with an unprecedented degree of accuracy, sensitivity and specificity. This is in stark contrast to previous models including a large number of variables and lower predictive power, and suggests that our initial hypothesis regarding the interpretability and reproducibility have been a justified concern.
Falls Prediction Tools in Context The current gold standard measure in falls prediction is the STRATIFY questionnaire13,21. There are two further, more recent tools to predict falls in a neurological population: Yoo et al. use a combination of risk factors (including assessment of gait, and insight into gait ability) coupled with logistic regression analysis22; Kabeshova et al., have identified a neural network that is able to predict falling18. A summary of these three methods is displayed in Table 4. Table 4: Comparison with state-of-art methods on acute neurological populations.
Name/Method
Prediction Strategy
Sens.
Spec.
PPV
Predictive
Interpretable
Useable
Reference
Proposed method
Random Forest on Trail Test
68% (± 7.7%)
90% (± 2.3%)
60% (± 7.6)
Yes
Yes
Yes
Above
67%
57%
No
No
Yes
[14]
84.4%
86%
16.4%
No
Yes
No
*Note: The fall rate was 3%*
88.0%
65.1%
Yes
No
No
STRATIFY Yoo et al., 2015 Kabeshova et al., 2016
Logistic regression on Risk Factors data Logistic regression on Prospective Risk Factors data NEAT on Prospective Risk Factors data
48.2 %
9.3% (Yoo et al)
[21]
[18]
Columns are, from left to right: the name of method; how it predicts: sensitivity/specificity/PPV as reported in the manuscript, hence some are without confidence intervals as they have not been predictively evaluated. A question mark “?” is used when the statistic in question was not reported. Next, three questions are proposed: whether predictive validation was employed for the method; whether the prediction is clinically/neurologically interpretable; and finally, whether applying the method in clinical practice is easy and straightforward based on the infrastructure provided.
12
Our approach improves on the state-of-the-art, as reported above, in a number of ways:
Accuracy in a clinical context. Methods with low specifity are not useful in a clinical neurological setting where the majority of patients do not fall- since a low specificity model in practice will lead to wasted resources (e.g. staff time, cost of any interventions), and even may induce a fear of falling, which can be more detrimental than actually falling with regards to health-related quality of life23. Further, for the purpose of directing scarce resources, the positive predictive value (PPV) of the other strategies is quite low. Our model is capable of a maximum PPV of 76% (Table 2 and 3). Hence, in terms of accuracy, we are able to offer the best tool available.
Usability in a clinical context. Our prediction is based solely on the trail test which can be easily conducted without the patients even leaving their beds. Hence it can be applied in everyday practice similar to the STRATIFY tool, while the other approaches would require a larger number of variables measured.
Predictive reliability. Predictive error estimation guarantees that the performance will not degrade, as long as the strategy is applied to a similar population – unlike for example the STRATIFY tool or non-predictive logistic regression where this has been observed before. Of course it remains to be seen whether it is the models or only the predictive modelling strategy that generalizes well to new types of populations.
Scientific parsimony. Our predictive model is parsimonious and well-interpretable: the fact that the trail test in itself allows the best prediction is scientifically interesting and points towards a number of hypotheses that may lead to novel insights on the interaction of human cognitive abilities and falling, or more generally overall risk assessment in a neurological population.
Strengths, Weaknesses and Further Research One of the main limitations of this study is a result of the data being collected in a single tertiary centre that covered acute neurological, neurosurgical, and neurorehabilitation care, suggesting that the generalization of these results should be considered carefully. Specifically, the neurorehabilitation population of patients represented less than 10% of the total, and faller cohorts, and therefore, we would argue that if this tool is utilized by other hospitals which may have a different composition of patients, the predictive accuracy on the
13
particular population needs to be checked first – this can be done easily by running the code we have provided in appendix F and checking the estimated statistics of prediction goodness on new data. A subtler question to answer is whether the final models transfer easily between population, or whether it is the best strategy (e.g., trail test & random forest) which can yield a different model for each hospital. Efficacy in a dedicated neurorehabilitation unit remains to be demonstrated, and this represents an important avenue for future research. The main strength of this study is that our model is based on direct measurements of cognition, rather than proxy measurements, which are likely to be more affected by confounding factors. Moreover, the information collected in our study is already collected in the course of a clinical work-up for many patients in the in-patient neurological setting. For example, the Trail Making test is part of the standard neuropsychological evaluation at the hospital in which this study was conducted, and is widely recognized as being useful in stroke patients for a number of reasons24. The burdens associated with data collection are greatly reduced in such a situation, because it allows for recycling of information that is already generated for other uses.
Implications for Policy Makers, and Clinicians The primary implication of this study is that a novel, highly sensitive and specific tool, for predicting falls in the acute neurological population, which surpasses the capabilities of the other tools available in this setting, is now available to policy makers and clinicians. However, we argue that the results presented here are important, not only because of their predictive power, but also because they demonstrate the efficacy of the two paradigm shifts we described earlier. In future studies, prediction models should be focus more acutely on the theoretical relevance of the data collected, with regards to the outcome being predicted, as was originally highlighted as being important. It is only then, that the true power of these modern statistical techniques will be fully realized.
Conclusion Although we must be cautious in making any definitive conclusions, it seems reasonable to suggest machine learning could improve the predictive faculties of future generations of predictive tools. Furthermore, the highly notable predictive power associated with the use of direct measurements of cognitive function highlights an important avenue for future research in falls risk prediction.
14
References 1.
World Health Organization. WHO Global Report on Falls Prevention in Older Age. Ageing And Life Course, family And Community Health. WHO Press. 2007. Available at: http://www.who.int/ageing/publications/Falls_prevention7March.pdf [Accessed 10 Jan. 2015].
2.
Rubenstein LZ. Falls in older people: epidemiology, risk factors and strategies for prevention. Age Ageing, 2006:35-S2:ii37-ii41.
3.
The University of York. The economic cost of hip fracture in the U.K., Health Promotion, England. 2000.
4.
Stevens J, Corso P, Finkelstein E. and Miller T. The costs of fatal and non-fatal falls among older adults. Injury Prevention, 2006:12(5), pp.290-295.
5.
Healey F, Oliver D. Preventing falls and injury in hospitals. The evidence for interventions. Health Care Risk Rep 2006:June;12-7
6.
National Patient Safety Agency. Slips trips and falls in hospital, NPSA: London. 2007
7.
Scuffham P, Chaplin A, and R. Legood. Incidence and costs of unintentional falls in older people in the United Kingdom. Journal of Epidemiology and Community Health. 2003; 57;740-744.
8.
Parrot, S. The Economic Cost of Hip Fracture in the UK. Centre of Health Economics, University of York; 2000.
9.
Kannus P, Palvanen M, Niemi S, Parkkari J. Alarming Rise in the Number and Incidence of Fall-Induced Cervical Spine Injuries Among Older Adults. The Journals of Gerontology Series A: Biological Sciences and Medical Sciences. 2007;62(2):180-183.
10. Oliver, D. Falls risk-prediction tools for hospital inpatients. Time to put them to bed?. Age and Ageing, 2008:37(3), pp.248-250. 11. Gillespie L, Robertson M, Gillespie W, et al. Interventions for preventing falls in older people living in the community. Cochrane Database of Systematic Reviews. 1996. 12. Oliver D, Britton M, Seed P, Martin F. and Hopper A. Development and evaluation of evidence based risk assessment tool (STRATIFY) to predict which elderly inpatients will fall: case-control and cohort studies. BMJ, 1997:315(7115), pp.1049-1053. 13. National Institute for Health and Care Excellence. Falls. Assessment and prevention of falls in older people (full NICE guideline). Clinical guideline 161. National Institute for Health and Care Excellence. 2013 14. Billington J, Galvin R, and Fahey T. Diagnostic accuracy of the STRATIFY clinical prediction rule for falls: A systematic review and meta-analysis. BMC Family Practice, 2012:13(1), p.76.
15
15. Hastie, TJ, Tibshirani RJ, and Friedman JH. The Elements Of Statistical Learning. New York, NY: Springer, 2016. Print. 16. Kirova AM, Bays RB, and Lagalwar S. Working Memory and Executive Function Decline across Normal Aging, Mild Cognitive Impairment, and Alzheimer’s Disease. BioMed research international, 2015. 17. Rantakokko M, Mänty M, and Rantanen T. Mobility Decline in Old Age. Exercise and Sport Sciences Reviews, 2013:41(1), pp.19-25. 18. Kabeshova A, Launay C, Gromov V, et al. Falling in the elderly: Do statistical models matter for performance criteria of fall prediction? Results from two large population-based studies. European Journal of Internal Medicine, 2016:27, pp.48-56. 19. Rowe T. and Juthani-Mehta M. Urinary tract infection in older adults. Aging Health, 2013:9(5), pp.519-528. 20. Amboni M, Barone P, and Hausdorff J. Cognitive contributions to gait and falls: Evidence and implications. Movement Disorders, 2013:28(11), pp.1520-1533. 21. Aranda-Gallardo M, Morales-Asencio J, Canca-Sanchez, J, et al. A survey of cross-validation procedures for model selection, Statistics Surveys, 2010:4;40–79. 22. Yoo S, Kim S, Shin Y. A prediction model of falls for patients with neurological disorder in acute care hospital. Journal of the Neurological Sciences. 2015;356(1-2):113-117. 23. Grimbergen, Yvette AM, Annette Schrag, Gordon Mazibrada, George F. Borm, and Bastiaan R. Bloem. "Impact of falls and fear of falling on health-related quality of life in patients with Parkinson's disease." Journal of Parkinson's disease 3, no. 3 (2013): 409-413. 24. Tamez E, Myerson J, Morris L, White D, Baum C, and Connor L. Assessing Executive Abilities Following Acute Stroke with the Trail Making Test and Digit Span. Behavioural Neurology, 2011:24(3), pp.177185.
16
Supplementary Appendix Table of Contents Page 2
List of Investigators
Page 3
Patient Recruitment, inclusion/exclusion criteria & statistics
Pages 4 – 6
Predictive Bench Mark Analysis Description
Pages 7 – 8
Description of Tests
Page 9
Cohort Demographics
Pages 10 - 12
Summary Statistics for Raw Data
Pages 13 - 19
All Predictive Analysis Results
Page 20
References
17
Investigators Mr. B.A. Mateen Mr. M. Bussas Dr. C. Doogan Dr. D. Waller Dr. A. Saverino Dr. F. J. Király Prof. E. D. Playford
18
Cohort, Demographics, inclusion/exclusion criteria, and statistical analysis Patient Recruitment Data was collected between the 17th November 2014 and 17th December 2014 at the National Hospital for Neurology & Neurosurgery, a tertiary neuroscience centre from a prospective cohort of 323 patients from 3 neurosurgical, 3 neurological, and 2 neuro-rehabilitation wards. The exclusion criteria for the study included: non-fluency of English, inability to provide informed consent because of severe cognitive impairment, communication difficulties, severe mood or behavioral problems, and specific contra-indication for each test that have been highlighted in appendix Table 1.
Demographics The mean time from admission to testing was 4.46 days (s.d. 8.66) for the prospective cohort. The demographics for the fallers and non-fallers were then compared using two-tailed t-tests. The p-value, illustrating the degree of significance in the difference between fallers and non-fallers, has been reported. Age, number of years of formal education and ethnicity did not significantly differ between the faller and non-faller cohorts. However, there were significantly more men (p