Machine Learning Challenges in Mars Rover Traverse Science Rebecca Castaiio Michele Judd Robert C. Anderson Tara Estlin Jet Propulsion Laboratory, 4800 Oak Grove Drive, Pasadena, CA 91 109-8099
Abstract The successful implementation of machine learning in autonomous rover traverse science requires addressing challenges that range from the analytical technical realm, to the fuzzy, philosophical domain of entrenched belief systems within scientists and mission managers. These challenges are many. They include helping scientists understand the benefits and risks of using machine leaming onboard and guiding them to distill and translate science goals into clear tasks that can be accomplished by algorithms. The technical challenges include, among other things, developing robust verification and validation plans. The ultimate test of onboard machine learning acceptance is if it flies and is executed onboard and delivers successful results during the mission. This last hurdle can be overcome by developing an implementation plan that poses an acceptable risk vs. reward scenario for mission managers.
[email protected]
[email protected] [email protected] [email protected]
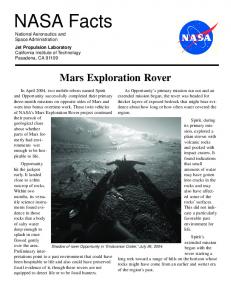
rovers such as the FIDO (Field Integrated Design and Operations) rover, as shown in Figure 1. As rovers continue to increase the distance they travel during a traverse, the importance of performing science data analysis onboard greatly multiplies. As the downlink bandwidth capability shrinks in comparison to the vast amount of terrain data gathered by the rover, the ability to summarize, highlight and prioritize the data becomes more and more valuable. The rover must now intelligently select what data to transmit back to Earth. We will discuss how recently developed machine leaming prioritization techniques address this challenge.
We are working on rover traverse science applications that address each of these issues. In this paper we will describe what we are doing and how we approach these challenges.
1. Introduction There are two fundamental constraints driving the need for using machine leaming to perform onboard science data analysis. The first constraint is the spacecraws limited downlink bandwidth and the second is the communication time delay between Earth and the spacecraft. Many spacecraft platforms will benefit from an onboard, machine learning capability. Our work focuses on providing this capability to a mobile rover on the surface of Mars. We are demonstrating and validating our technology using data from field test
Figure 1. FIDO rover in August 2002 field test in Arizona. We have tested our algorithms on image data from this field test. Opportunistic science, another application enabled by onboard machine leaming, will address not only the downlink bandwidth constraint - but also that of the communication delay. The capability of opportunistic science enables a rover to perform data collects, which were not originally planned, when an interesting science target is encountered - without having to wait for a command from Earth.
The goal of onboard science analysis is to increase mission science return. The keys to achieving this objective are threefold. We must first identify a metric of increased science return that the scientists will support. We then have to develop algorithms that achieve this increase in science return. Finally, we formulate a plan to integrate the technology into the mission at a risk level acceptable to the project manager and project scientist.
2. Getting Scientists Onboard Onboard data analysis will be impossible to fly without the backing of the scientific community. In order to gain their support, we must understand their point of view. In general, scientists want control over what data is collected. They also want the return of all the raw data collected. The motivation for this mindset is that they feel they are best qualified to make data gathering decisions to maximize science return. Furthermore, they contend that any preprocessing of the data may result in a loss of crucial scientific information. This mode of operation works well under limited operating conditions, such as constraining rover targets to be within the region defined by the most recent images sent back to Earth. NASA envisages future rovers with the ability to move beyond this localized region. This capability will force scientists to undergo a paradigm shift with respect to their data gathering strategies. In these new missions, scientists will no longer be able to “see” all of the terrain the rover will traverse. In addition, these new missions will have instruments with data gathering abilities that far exceed the allocated downlink bandwidth for the mission. Thus, much more data can be collected than can be sent back to the researchers on Earth. As a result, the scientist will soon be forced to decide what data to collect and return without prior visual surface information of an area. The scientist’s data gathering options include: taking no science data during the traverse; collecting data at a fixed time interval, or fixed distance interval; or allowing the rover to make intelligent decisions about what data to gather and transmit. As a prerequisite to selecting option three (the rover making its own data gathering and data transmittal decisions), we hope to convince scientists that the onboard science capabilities will yield more science return than the other predefined options. We are approaching this from several directions such as verification and validation using data from current or past missions and interacting with scientists at all stages of development and testing. We will outline
these interactions development.
beginning
with
system
Working with scientists, JPL’s Onboard Autonomous Science Investigation System (OASIS) team has identified three classes of data evaluation criteria (Castaiio et. a1 2003). Researchers are interested in identifying the existence of certain pre-specified signals of scientific interest. The second criterion is the identification of unexpected, or anomalous, features, as these can lead to new scientific discoveries. Finally researchers want to capture a description of the typical characteristics of a region. In the next section, we present our approaches to each of these prioritization criteria.
3. Automated Rover Traverse Science Application The onboard rover traverse science data analysis system for data prioritization and opportunistic science must be able to identify indicators of scientifically significant information. This involves extracting features from the collected data and then evaluating the data based on the extracted features. Here we describe the features upon which we are initially focusing, the methods for prioritization, and our approach for both verifying that the algorithms are accurate and validating that the performance of the algorithms is acceptable to scientists. 3.1 Feature Extraction The first step in onboard analysis is to extract features that can be used to assess the scientific value of the data. We have initially concentrated on the geology and, more specifically, on the rocks in a scene. Intuitively, this makes sense, as rocks are a predominate feature on the surface of Mars, and can thus provide valuable insights into the geological processes involved in forming the existing landscape. There have been several approaches to locating rocks in images, including that of Gulick et al. [Gulick, et a.1, 19991. Our approach begins by locating rocks in a stereo image pair. To find the rocks, the stereo range information, already calculated for navigation purposes, is transformed to produce a height image. In the height image, the value of each pixel represents the elevation of the point above the ground plane of the scene (rather than the distance fiom the point to the camera, as in the range image, or the brightness of the point in the scene, as in the original grayscale image). Level contours in the height image are then calculated and these contours are connected, from the peaks to the ground, to identify the rocks [Gor, et al., 20011. Rock properties including albedo, visual texture and shape [Fox, et al, 20021 are then extracted from the rocks identified.
We measure albedo, which indicates the reflectance properties of a surface, by computing the average grayscale value of the pixels that comprise the image of the rock. Visual texture can be described by intensity variations at different orientations and spatial frequencies within the image [Gilmore, et al., 20001. We measure texture using a filter bank in which each filter is tuned to a different combination of orientation and spatial frequency [Castano, et al, 19991. 3.2 Image Prioritization The features extracted from a group of images are then used to rank the images using the three distinct prioritization algorithms described in this section. 3.2.1 KEYTARGETSIGNATURE Scientists have studied landing areas extensively and have an idea of what they expect to see or encounter during an in situ mission. On a mission, the instruments have all been carefully selected to collect information that will provide valuable insight into the history of, or current conditions on, the planet. Examples of what they are looking for include any signs of life, past or present, and any signs of water, past or present. The presence of carbonate minerals is a specific example of what would be a key discovery. Thus, when only limited data can be sent to Earth, it is very important to scientists that any data containing key signatures indicating significant scientific discoveries is among the data that is retumed. We specify the target signature for a rock of interest as a feature vector whose values are provided by the scientists. Rocks are prioritized as a function of the distance of their extracted feature vector from the specified weighted feature vector. 3.2.2 NOVELTY DETECTION Often, scientific discoveries are made not by identifying a sought after signature, but as a result of encountering a novel, unexpected signature that is not readily explained using current models. Following this approach, images with interesting features, such as rocks with unusual shapes or textures, should be ranked higher than images without distinctive features. We have developed three methods for detecting and prioritizing novel rocks, representing the three dominant flavors of machine learning approaches to novelty detection: distance-based, probability-based (i.e. "generative"), and discriminative. These methods for novelty detection are applicable to a variety of novelty detection tasks, but are specifically designed with onboard constraints and large candidate feature spaces in mind. 3.2.3 REPRESENTATIVE SAMPLING One of the objectives for rover traverse science is to gain an understanding of the region being traversed. As such,
we want to have information on representative rocks, not just potentially very interesting unusual rocks, retumed to Earth. A region is likely populated by several types of rocks with each type having a different abundance. A uniform sampling will be biased towards the dominant class of rock present and may result in smaller classes not being represented at all in the downlinked data. In our representative sampling algorithm, the rocks are clustered into groups based on their feature vectors using K-means. The science team pre-assigns a weighting, or importance value, to each property (shape, albedo, texture) in the feature vector. Different weight assignments can be used to emphasize the properties of highest interest. For example, albedo and texture are typically used to distinguish types of rocks, but rock size may be used if sorting is of interest. For example, rocks that have been subjected to a geologic process such as flooding may be sorted over a surface area according to their size. The presence of such sorting provides information about the processes that may have occurred. The data is then prioritized to ensure that representative rocks from each class are sampled. Now that all three prioritization techniques have been described, we will now discuss how we are verifying and validating these algorithms.
3.3 Performance Verification Performance verification involves ensuring that the algorithm implementation is working correctly under the specified operating conditions. This can be segmented into two separate considerations. The implementation must first correctly execute the specified algorithm, i.e. no bugs, and then the algorithm must perform the desired operations under claimed circumstances.
For the onboard science application, each stage is verified independently, i.e. rocks correctly identified, features correctly extracted, and prioritizations performed correctly for given feature vector sets. The first two of these, rock identification and feature extraction, are affected by data sampling conditions which may alter data values in ways that are independent of the properties of the scene. An obvious example is that lighting conditions will affect the albedo measurement of a rock, leading to misleading conclusions if no corrections are made. We are testing the algorithms on a number of relevant sources, including rovers collecting data in the JPL Mars Yard, rovers collecting data in the field, hand-held instrument measurements under varying conditions, Mars Pathfinder Mission data, and, when it becomes available, Mars Exploration Rover (MER) Mission data. At this point, we limit claims about the variability of operating conditions under which consistent results will be acquired, but these factors, such as lighting compensation are under consideration.
For given feature values, it is straightforward to verify that the prioritization algorithms correctly sort the lists of rocks and images according to the specified priority metric. This can be tested by using actual feature values and by conducting extensive testing using synthetic features. However, the overall goal of onboard prioritization is to ensure that the automated prioritization results correspond to a prioritization similar to that which the scientists would assign for the same data. Demonstrating that this objective is met falls within the realm of validation. 3.4 Performance Validation
One of our primary concerns in this project is to develop techniques for validating the results of our autonomous prioritization algorithms. In particular, we would like quantitative measurements so that we can gauge how closely our algorithms match the priorities of experts. Discrepancies can arise at multiple stages of the analysis process. First, the features extracted may not be informative for the scene properties that scientists consider important. Second, if the algorithms for extracting and prioritizing the features do not correspond well with the actual properties of the scene, the resulting prioritization will not match well with scientists evaluations. We have approached the problem of characterizing what the scientists consider interesting by involving scientists early in the algorithm design and development processes. We validated the design by comparing the results of prioritizing data using our algorithms to scientists’ prioritizations of the same data. After collecting information from the experts, statistical methods were used for the following: to combine the results from a number of experts, to compare consistency across the experts, and to compare their results with the prioritizations produced by our algorithms. We compared rankings using the Spearman rank coefficient [Lehmann, 19751,which yields a correlation coefficient between two rankings and thus provides a quantitative similarity measure. Our analysis indicated that scientists tend to group the image data set into several classes. There was consistent agreement on the order of importance of each of the classes. Within classes, the agreement varied from very little in the least important class to very high agreement in a class in which images were unique. It was also clear that the scientists do not usually prioritize data based on the general question “Which image provides the most science information?” For example, a scientist may be studying the sedimentology of an area. To approach the automated analysis in this way, each of the possible scientific questions needs to be identified, and techniques for extracting and ranking the relevant information would then need development.
4. Technology Integration Plan With a science analysis application that is operating within onboard resource requirements’ and supported by the scientists, one final challenge remains: to convince mission managers to fly the software. There are several stages of mission development that machine leaming applications can be introduced. One of the optimal times is during early mission planning stages. This works well if the machine leaming techniques will provide a capability that is considered an enabling technology needed for the mission to achieve its objectives. One of the keys to this approach is to make mission designers aware of the new machine learning capability early on in the design process. Early integration can provide new design options, capabilities and cost savings that can increase the overall acquisition of mission science.
A second possible stage of introducing the new machine leaming capability is during mission development. This is significantly more difficult because the mission will almost always be struggling to maintain time and budget schedules. They would be more likely to descope some of the mission functionality than to add a new capability that may solve some of the problems they are encountering. Once the mission is flying, and assuming that the spacecraft is operating well, there is a great reluctance to change anything. This is where a tiered approach to introducing autonomous machine leaming algorithms into missions can be initiated. A tiered approach consists of incremental demonstrations and integration of the technology into the missions. This approach may begin with a completely non-intrusive, no-risk, ground demonstration and can culminate with a full demonstration of the technology onboard. The mission managers must first be convinced of some quantified benefit to their mission or to future missions. The technology provider’s desire to demonstrate their technology is not a motivation for the mission manager. The technology provider must demonstrate a benefit to the mission itself, such as new science enabled by the technology or the possibility of making a greater number of scientific discoveries. For the rover traverse science application, we have identified several steps to integrate the technology. The first step is to demonstrate the operational capability of the software. This will be done with data returned to Earth from the rover, beginning with Mars Exploration Rover (MER) Mission data. In this case, the data sent to Earth will be analyzed for
’ An issue we do not discuss in this paper.
interesting features and then prioritized to show which features and images are given the highest priority by the algorithms. These results are then shown to the scientists to validate desired performance. Our next step is to shadow operations on the ground by demonstrating the technology under flight conditions, that is, with the same raw data and telemetry information available onboard the rover itself. Introduction of the onboard traverse science capability in increasing levels of autonomy would begin during an extended mission phase and would initially perform shadow operations onboard. The OASIS rover traverse science system has a multi-leveled functionality that involves increasing levels of autonomy. In the most basic configuration, data collected for navigation is analyzed and prioritized. Thus, the rover takes no additional data. The results downloaded for this operation can be either the highest ranked set of image data, and/or a data summary table. For example, if only five images for the traverse can be downloaded, the five images that the algorithms have tagged as having the highest priority would be selected, rather than using another selection mechanism. This mode does not involve any bits of additional download. With a few additional bits, a summary table of the terrain traversed, including a table of rocks and their properties, can be downloaded. This table provides a very condensed, computationally inexpensive summary of the region. Our next level of functionality is to provide the rover with the capability of stopping when a key signature is detected. Scientists pre-define these key target signatures on Earth and then upload them to the rover. The rover will stop when a signature indicating an extremely important scientific feature is identified with high confidence. At a slightly higher level of autonomy, if an interesting or highly novel feature is identified, it may not be of sufficient significance to halt all further planned operations for the day, but it may be desirable to take additional measurements such as with a color camera or spectrometer. These can then be downloaded at the next communication opportunity. Increasing the autonomy level still further, we could allow the system to command the rover to slightly deviate from its planned path to get an additional measurement at a new viewpoint of, or closer to, the interesting target. Finally, the highest level of autonomy would involve the rover actually deciding to take a contact measurement of an interesting target. Another approach to gaining acceptance of machine leaming onboard is to first demonstrate the capability in a limited capacity as an experiment onboard a spacecraft. Opportunities can arise when a
spacecraft is no longer able to perform its original mission, as with the Wide-field Infrared Explorer (WIRE) spacecraft which lost the coolant to its instrument shortly after launch. Although the instrument could not be used, the rest of the spacecraft including the startracker remained operational. Researchers had the chance to propose new uses of the spacecraft such as demonstration of new technologies. Also, student-lead projects such as those in the University Nanosat Program can be a forum for technology demonstration. Often these universities welcome the opportunity to put additional capabilities on their spacecraft, although the spacecraft may have extremely limited resources.
Acknowledgements We would like to thank our sponsors, the Interplanetary Network Directorate Program, the Intelligent Systems Program of CICT, and the AISRP. We would also like to acknowledge the hard work of the rest of the current Onboard Autonomous Science Investigation System (OASIS) team: Dan Gaines, Forest Fisher, Dennis DeCoste, Dominic Mazzoni, Ben Bomstein, Andres Castaiio, Lucas Scharenbroich, Lin Song, Marty Gilmore, and James Dohm.
References Castaiio, R., Anderson, R. C., Estlin, T., DeCoste, D., Fisher, F., Gaines, D., Mazzoni, D., and Judd, M (2003). Rover Traverse Science for Increased Mission Science Retum. Proc. 2003 IEEE Aerospace Con$ Big Sky, Montana. Castaiio, R. L., Mann, T., and Mjolsness, T. Texture analysis for Mars rover images. Proc. App. of Digital Image ProcessingZII, SPIE Vol. 3808, July, 1999. Chien, S., et al., " Autonomous Science on the EO-1 Mission", iSAIRAS,Nara, Japan, May 2003. Fox, F., Castaiio R., and Anderson, R. C. (2002). Onboard autonomous rock shape analysis for Mars rovers. Proc. 2002 IEEE Aerospace Con$, Big Sky, Montana. Gilmore, M., et al. Strategies for autonomous rovers at Mars. Journal of Geophysical Research, Vol. 105, No. E12, Dec. 2000 pp. 29223-29237. Gor, V., Castaiio, R., Manduchi, R., Anderson, R., and Mjolsness, E. Autonomous Rock Detection €or Mars Terrain. Space 2001, AIAA, Aug. 2001. Gulick, V.C., Morris, R. L., Ruzon, M. A., and Roush, T. L. (2001). Autonomous image analysis during the 1999 Marsrokhod rover field test. Journal of Geophysical Research, Vol. 106, No. E4 (pp.7745-7767). Lehmann, E.L. (1975). Nonparametrics: Methods Based on Ranks, 1975.
Statistical