International Journal of Machine Learning and Computing, Vol. 8, No. 2, April 2018
Machine Learning in Predicting Hemoglobin Variants Monalisha Saikia Borah, Bikram Pratim Bhuyan, Mauchumi Saikia Pathak, and P. K. Bhattacharya
considerable pain and suffering to the patients and their families, and are major drain on health resources in India. The detection of patients with abnormal hemoglobin will help in the prevention of more serious hemoglobin variants (Hb variants) cases [3]. Appropriate diagnosis of these genetic diseases is very important for treating these diseases. Appropriate diagnosis requires the accurate detection of the types of thalassemia or hemoglobinopathies occurring. So in order to do so, trained manpower or professionals are required to interpret the obtained data, which is generated from the HPLC-based Hemoglobin typing machine. However, there is sometimes a lack of or shortage of such trained professionals in healthcare centers or hospitals. So, there is a need for machine learning tools, which can help in the detection or diagnosis of the type of thalassemia or hemoglobinopathies status. Machine learning is a core sub-part of artificial intelligence, which studies the different algorithms used for learning from the data. Classification is an area of machine learning where the observations are categorized based on the input data. Machine learning techniques have been previously reported in the literature for medical diagnosis [4], [5]. Amendolia et al. [6] compared two machine learning algorithms k-nearest neighbor (KNN) and multi-layer perceptron (MLP) to classify the patient into pathological and non-pathological cases, and subsequently the pathological cases into α-thalassemia carrier and β-thalassemia carrier. A neural network and a genetic programmatically evolved decision tree were used in [7] to distinguish between thalassemic, thalassemic trait, and normal patients. In [8] a comparative analysis of the unconstrained functional network classifier, MLP and support vector machine (SVC) was performed to classify patients into the non-thalassemia and thalassemia groups. Recently in [9] it was shown that the performance of the classification methods using machine learning techniques mostly depends on the quality of the data used in the learning process. It also illustrated that the beta-thalassemia data can be used to classify the genotype of beta-thalassemia patients, and the thalassemia screening was performed based mainly on indicators, such as MCV, MCH and HbA2. It also showed that all the classification techniques, including KNN, MLP, BNs, naïve bayes, and multinomial logistic regression, can be used for screening beta-thalassemia. In the above-mentioned papers, it has been shown that machine learning techniques, such as data mining, has immense use in various fields including engineering, medical science, life science, etc. A comparison of the machine learning algorithms can be used to classify the type of disease or to differentiate between the pathogenic and non-pathogenic forms of a disease. Decision tree helps in classifying a genetic disease whether it is in the heterozygous or homozygous state.
Abstract—Disease diagnosis is of the utmost importance in providing appropriate medical treatment. Genetic diseases, such as hemoglobinopathies and thalassemia, need to be diagnosed accurately and on time. Though Hb variants are diagnosed using a HPLC-based hemoglobin typing machine. appropriate interpretation of the data obtained is still necessary and this requires trained professionals. Machine learning helps to interpret the obtained data and in predicting the type of Hb variants, thus reducing the workload of health professionals. In this study, the obtained data are classified using the following classifiers, namely logistic regression, support vector classifier (SVC), k-nearest neighbor (KNN), Gaussian naïve bayes, perceptron classifier, linear SVC, stochastic gradient descent, decision tree, random forest, and multi-layer perceptron. The pre-processing, visualization and the classification steps were implemented using Python 2.7 on an Intel Core i5 computer. The performance of each classifier was then tested by initially creating a confusion matrix. Indices including “precision,” “recall,” and “f1-score” were used to quantify the quality of each model. KNN, decision tree, and random forest show better classification results in comparison to the other classifiers. With a precision of 93.89%, recall of 92.78%, and f1-score of 93.33%, the decision tree and random forest classifiers prove to be better classifiers in predicting the Hb variants with a higher accuracy rate. Index Terms—Data mining, disease prediction, Hb variants, hemoglobinopathies, machine learning, thalassemia.
I. INTRODUCTION Genetic hematological diseases, such as thalassemia and hemoglobinopathies, are prevalent worldwide. The South-east Asian countries have a wide prevalence of these types of genetic blood diseases. HbE, HbS, beta-thalassemia, alpha thalassemia and compound HbE-beta-thalassemia are mostly prevalent in India and even in the North-east region of the country. Hemoglobinopathies are the structural defects in hemoglobin formed because of abnormalities in the formation of the globin moiety; thalassemia are synthesis defects, which are characterized by a reduced rate of normal hemoglobin due to absent or decreased synthesis of the globin polypeptide chains [1], [2]. Genetic hemoglobin disorders with severe anemia cause Manuscript received January 30, 2018; revised March 22, 2018. Monalisha Siakia Borah is with the Department of Bioscience, Asian Institute of Management and Technology, Guwahati, Assam 781022, India (e-mail:
[email protected]). Bikram Pratim Bhuyan is with the Department of Computer Science and Engineering, Kaziranga University, Jorhat, Assam 785006, India (e-mail:
[email protected]). Mauchumi S. Pathak is with the Department of Biochemistry, Silchar Medical College and Hospital, Silchar, Assam 788014, India (e-mail:
[email protected]). P. K. Bhattacharya is with the Department of General Medicines, North Eastern Indira Gandhi Regional Institute of Health and Medical Sciences, Shillong, Meghalaya 793018, India (e-mail:
[email protected]).
doi: 10.18178/ijmlc.2018.8.2.677
140
International Journal of Machine Learning and Computing, Vol. 8, No. 2, April 2018
The major drawback observed in the previous research is that only one hemoglobin variant is taken into consideration in the classification process. Also, the experiments were carried out comparing the minimum number of classifier algorithms. Our approach was to learn how different classifiers can be used to predict diseases, such as Hb variants, and to identify which classifier is best and gives the more accurate prediction with greater “precision,” “recall,” and “f1-score.” The present study includes the use of computer technology including machine learning in healthcare studies such as the detection and diagnosis of diseases with good accuracy, which may reduce the overall workload.
transformed data set was segregated randomly into the training and test data. About 80% of the data was randomly selected for the training process. Randomized division cancelled out the bias that could be present in the selection. A classifier algorithm was then implemented on the training data and the performance of the classifier tested on the test data. Many classification algorithms have been proposed in the literature [12]. We would like to classify the prepared data using the following classifiers, namely logistic regression, support vector classifier (SVC), KNN, Gaussian naïve bayes, perceptron classifier, linear SVC, stochastic gradient descent, decision tree, random forest and multi-layer perceptron. We have implemented the pre-processing, visualization (statistical analysis) and the classification steps using Python 2.7 on an Intel Core i5 computer.
II. MATERIALS AND METHODOLOGY A. Materials The samples were collected for this study after ethical clearance from the Institutional Ethical Committee. The pro forma was filled up and details including the sample number, date, age, sex, religion, caste, blood group, and family history were recorded before collecting the blood samples. 2.5 mL of venous blood was collected in EDTA coated vacutainers for sample analysis. The blood samples sent for the hemoglobin typing test were analyzed for the complete blood count (CBC) including WBC, RBC, HGB, HCT%, MCV, MCH, MCHC, and PLT using an automated hematology analyzer (pocH-100i, Sysmex Corporation, Kobe Japan) [10], within 24 hours of blood collection. Then, the blood samples were screened for hemoglobinopathies and thalassemia, and the characterization of the samples along with quantification of the different Hb components, i.e., Hb A0, Hb A2, Hb F, A1a, A1b, A1c, F, P3, LA1c/CHB1 etc. were carried out using a fully automated ion exchange high performance liquid chromatography (HPLC)-based hemoglobin testing system (D-10, BioRad, USA) [11]. Around 1500 samples were tested for hemoglobin typing and the results obtained were used for the machine learning study. The data set collected has the following attributes: Sl. No, date, age, sex, caste, religion, blood group, WBC, RBC, HGB, HCT%, MCV, MCH, MCHC, PLT, A1a, A1b, A1c, F, P3, A0, A2, LA1C, diagnosis. The subclasses of the diagnosis variables (Hb variants) taken into consideration are: beta-thalassemia major, beta-thalassemia trait, compound heterozygous for HbE & beta-thalassemia trait, compound heterozygous for HbS & beta-thalassemia trait, HBE heterozygous, HBE homozygous, HbS disease, HbS trait, and normal. B. Methodology The methodology of this study has 7 phases, which are shown below. After collecting the data, the data was subjected to a cleaning process so that no outliers or missing values are present. After this, an appropriate statistical analysis (both descriptive and inference statistics) was performed on the data to understand the interdependency of the variables. This step can also be termed as the feature selection procedure. A reduced set of attributes is the resultant, as shown in Table I. Now, before providing the data to the classifier, the
TABLE I: THE ATTRIBUTES OF THE SELECTED DATA SET.. Attribute WBC RBC HGB MCV MCH MCHC F A0 A2 LA1C/CHB-1 Diagnosis
Data type Real Real Real Real Real Real Real Real Real Real Nominal
Fig. 1. Methodology for hematology classification.
141
International Journal of Machine Learning and Computing, Vol. 8, No. 2, April 2018
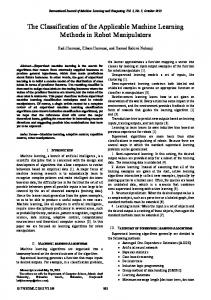
“precision,” “recall,” and “f1-score” in accordance with the equations shown above. When observed, these equations provide the same results as when the above indices are computed with the help of true positives, true negatives, false positives and false negatives. The “f1-score” is in fact the harmonic mean of the “precision” and “recall.” Different classifiers including logistic regression, SVC, KNN, Gaussian naïve bayes, perceptron, linear SVC, stochastic gradient descent, decision tree, random forest, and multi-layer perceptron were used in our study. For each of the classifiers, the different indices, including the “precision,” “recall,” and “f1-score” were computed from the confusion matrix. The results obtained are depicted in TABLE II. It is seen that the KNN, decision tree and random forest show better classification results when compared to the other classifiers. With a precision of 93.89%, recall of 92.78% and f1-score of 93.33%, the decision tree and random forest classifiers were proven to be better classifiers in predicting the Hb variants with a higher accuracy rate. Random forest is in fact generated using many decision trees. Decision trees are formed by taking different subsets of attributes and in accordance to maximum information gain those specific attributes form the decision tree for better performance. Thus, we can see that from the random forest that the best possible decision tree, in terms of accuracy, was projected. Entropy was taken into consideration in forming the decision tree. A decision tree is shown in Fig. 2. The decision tree can also be used for rule generation. For example, we can create a rule for diagnosing the beta-thalassemia trait, a variant of Hb, as shown in Fig. 2. If (A0 > 71.5 && 4.05 < A2 < 9.7 && RBC > 4.25) → beta-thalassemia trait. The rule generated can be used to observe the range of variables or attributes involved in formulating the decision tree. This rule, which shows that for the diagnosis to be the beta-thalassemia trait, A0 is always >71.5, A2 value should always be between 4 and 10, and mainly in the range of 4.05-9.7. The observed RBC value is always >4.25. These ranges provide important information regarding the specific variant of hemoglobin. Domain experts have also validated the ranges of the variables making it a useful technique. In this way, various rules can be generated using the decision tree, which helps to predict the Hb variants.
The performance of each classifier was now tested by initially creating a confusion matrix. As the “diagnosis” attribute has 9 hemoglobin variants prediction labels, as-mentioned above, the dimensions of the confusion matrix created will be 9 × 9. The total count of true positive, true negative, false positive and false negative of each label was calculated. Subsequently, various indices such as the “precision,” “recall,” and “f1-score” were used to quantify the quality of each model.
III. RESULTS AND DISCUSSION Following the methodology described in the previous section, the performance of each classifier is presented in this section. The equations required to compute the “precision,” “recall,” and “f1-score” indices are shown below.
A(i, j ) , where n = 9.
Recall of label “i” = Re (i) =
(1)
n
A(i, j ) j 1
Precision of label “i” = Pr (i) =
n
A(i, j ) , where n = 9 (2)
A( j, i) j 1
F1-score of label “i” = F1 (i) = 2 * Re(i) * Pr(i ) Re(i ) Pr(i )
(3)
n
Re(i) Average recall of a classifier =
i 1
, where n = 9
(4)
n n
Average precision of a classifier =
Pr(i) i 1
, where n = 9 (5)
n n
F1(i) Average F1-score of a classifier =
i 1
, where n = 9 (6)
n TABLE II: THE PREDICTION RESULTS Classifier
Precision (%)
Recall (%)
F1-score (%)
Logistic regression SVC KNN Gaussian naïve bayes Perceptron Linear SVC Stochastic gradient descent Decision tree Random forest Multi-layer perceptron
89.23 66.67 92.23 77.89 78.12 81.56 76.67 93.89 93.89 85.22
87.34 64.78 91.67 69.78 75.23 78.34 67.11 92.78 92.78 82.34
88.27 65.71 91.95 73.61 76.65 79.92 71.57 93.33 93.33 83.76
After formulating the confusion matrix “A” for each of the classifiers mentioned in TABLE II, we calculated the
Fig. 2. Decision tree.
142
International Journal of Machine Learning and Computing, Vol. 8, No. 2, April 2018 [9]
IV. CONCLUSIONS This study proves that machine learning can be used in healthcare because it helps in the prediction and diagnosis of the Hb variants. Predicting the type of Hb variants is possible with the help of machine learning by using different classifiers. Experimentally, the decision tree and random forest classifiers were proven to be the fore-runners in terms of classifying the Hb variants. An in-depth study with a large number of samples may help in generating greater “precision,” “recall,” and “f1-score” values, which actually imply greater accuracy. Better data mining algorithms can also be developed in the future to further initiate a more detailed study.
M. N. Amin and M. A. Habib, "Comparison of different classification techniques using WEKA for hematological data," American Journal of Engineering Research (AJER), vol. 4, no. 3, pp. 55-61, 2015. [10] Kobe, “Instruction manual for pocH-100i, SYSMEX corporation,” Japan, Asia Pacific Edition B. [11] Instruction Manual for D-10 Dual Program, Bio-Rad Laboratories, United States. [12] C. M. Bishop, Pattern Recognition and Machine Learning, New York: Springer -Verlag, 2006, ch. 4.
Monalisha Saikia Borah specializes in medical biotechnology. She has worked as a senior research fellow on the DBT Project in the Department of Biochemistry of Gauhati Medical College & Hospital, Assam and presently works as an Assistant Professor & the Head of the Department of Bioscience, Asian Institute of Management & Technology, Guwahati, Assam.
REFERENCES [1]
[2]
[3]
[4]
[5]
[6]
[7]
[8]
M. S. Borah, P. K. Bhattacharya, M. S. Pathak, and D. Kalita, "A hospital based study of Hb variant and beta thalassaemia mutational pattern characterization among the people of Northeast region of India," Annals of Pathology and Laboratory Medicine, vol. 3, no. 3, pp. 134-140, 2016. S. L. Thein and J. Rochette, "Disorders of hemoglobin structure and synthesis," Principles of Molecular Medicine, NJ: Humana Press, 1998, pp. 179-190. M. S. Pathak, M. S. Bora, and D. Kalita, "Disorders of haemoglobin variants in paediatric patients attending in a tertiary care hospital of North East India," International Journal of Biological and Medical Research, vol. 5, no. 1, pp. 3841-3846, 2014. M. Fatima and M. Pasha, "Survey of machine learning algorithms for disease diagnostic," Journal of Intelligent Learning Systems and Applications, vol. 9, no. 1, pp.1-16, 2017. N. Esfandiari, M. R. Babavalian, A. E. Moghadam, and V. K. Tabar, "Knowledge discovery in medicine: Current issue and future trend," Expert Systems with Applications, vol. 41, no. 9, pp. 4434-4463, 2014. S. R. Amendolia, G. Cossu, M. L. Ganadu, G. Bruno, G. L. Masala, and G. M. Mura, "A comparative study of k-nearest neighbour, support vector machine and multi-layer perceptron for thalassemia screening," Chemometrics and Intelligent Laboratory Systems, vol. 69, no. 1, pp. 13-20, 2003. W. Wongseree, N. Chaiyaratana, K. Vichittumaros, P. Winichagoon, and S. Fucharoen, "Thalassaemia classification by neural networks and genetic programming," Information Sciences, vol. 177, no. 3, pp. 771-786, 2007. E. A. El-Sebakhy and M. A. Elshafei, "Thalassemia Screening Using Unconstrained Functional Networks Classifier," in Proc. IEEE International Conference on Signal Processing and Communications, Dubai, United Arab Emirates, 2007, pp. 1027-1030.
143
Bikram Pratim Bhuyan was born in Guwahati, Assam, India on November 23, 1988. He completed his M.Tech. in information technology at Tezpur University in 2016. He is currently working as an Assistant Professor in the Department of Computer Science and Engineering, Kaziranga University, Jorhat, Assam 785006, India. His areas of interest are knowledge representation and reasoning, graph theory, game theory, complexity analysis and algorithms. Mr. Bhuyan is a professional member of the ACM (Association for Computing Machinery) and ICSES (International Computer Science and Engineering Society). His work on formal concept analysis was awarded as the best paper in an IEEE sponsored International conference (CSCITA 2017). He has worked as a peer review panel member in various international conferences and journals including IEEE CINE 2017, ICCISN 2017, IEEE ICCSCE 2017 AJFAM, IJSTR etc.
Mauchumi Saikia Pathak obtained her MD in biochemistry and is presently a Professor and the Head of the Department of Biochemistry of Silchar Medical College & Hospital, Silchar, Assam. She has published many research papers in international and national journals.
Prasanta Kr. Bhattacharya obtained his MD in medicine and his PhD. He is presently a Professor and the Head of General Medicine of Neigrihms, Shillong, Meghalaya. He has many publications in reputed international and national Journals.