ICCST 2013
Machine Learning Techniques Applied To Intruder Detection In Networks J. L. Henao R, J. E. Espinosa 0
Abstract- The intrusion in data networks, are a constant
problem faced by networks administrators. Because of this, it is necessary identify, study and propose techniques to detect the moment in which the network is attacked, with the purpose of take measures to mitigate these threats. In this paper was conducted a study of the threats taxonomy that
and principal component analysis PCA (dimensionality reduction) for complete data sets because the attacks are not self-contained, i.e. are not on a single frame, given that to perpetrate it is necessary to run a series of steps that must inevitably use a minimal amount of these (frames), both for gathering information and for implementing intrusion.
could lead to an attack in a data network. For this, we have identified the most relevant characteristics of the network traffic in order to be processed and classified using machine learning techniques,
specifically
dimensionality
reduction
artificial neural networks
the
normalization
(Z-Score),
(peA) and classification based on (ANN) to suggest an intrusion detection
system (IDS).
Index Terms
-
Threat, network attacks, normalization,
dimensionality reduction, classification, IDS,Jntruder Detection Systems, neural networks.
I.
INTRODUCTION
Athe software, hardware, or even people who are part of a computer attack takes advantage of a weakness or flaw in
computing environment, in order to make a profit or generate a damage causing a negative effect on the security of the system which then has a direct impact in the organization assets[1]. Detection of attacks (intrusion or intrusions) is a highly sensitive issue because the Internet is growing in an exponential rate and with it, does cyber-attacks by exploiting flaws procedures (known as exploits) in the Internet protocols, operating systems and application software. Some protective measures such as firewalls are designed to prevent and audit the intruder's activities, but cannot ensure full system protection. Therefore, it is necessary to develop dynamic mechanisms such as intrusion detection systems (IDS), which act as a second line of defense. This article discusses security in data networks in relation with the intrusion detection, we propose a model for detecting them using feature selection on attack frames generated in a controlled environment, dimensionality reduction on the selected features and the subsequent classification (belonging or not to the category of attack) using machine learning techniques such as Artificial Neural Networks (classification) J. L. Henao R, assistant professor of Poliecnico Colombiano "Jaime Isaza Cadavid". Medellin, Colombia (e-mail:
[email protected]). J. E. Espinosa 0, assistant professor of Politecnico Colombiano "Jaime Isaza Cadavid". Medellin, Colombia (e-mail:
[email protected]).
II.
THEORETICAL FRAMEWORK
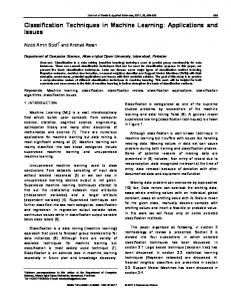
A. The Informatics Attacks The execution of a computer attack passes through well recognized 5 stages [2]. • Recognition. This stage involves Information Gathering with respect to a potential victim, who may be an individual or an organization. • Exploration. Here we use the information obtained in the recognition phase to test the target and try to obtain data on the victim's system, in areas such as IP addresses, host names and authentication data, among others. • Accessing. In this instance the attack begins to materialize through the vulnerabilities and flaws exploitation of the system found during the scanning and recognition phases. • Maintaining Access. During the time the attacker has access to the system, he seeks to implement tools to allowing regain access to this in the future from anywhere from Internet. • Remove Traces. Once the attacker was able to obtain and maintain access to the system, he tries to remove or erase all traces left during the intrusion to avoid detection by security or the data network administrators. The intrusion detection in a computer system is the process of monitoring events occurring in a computer system or in the data network, as well as the necessary analysis to detect intrusions [3]. The intrusion detection systems can be classified according to different parameters [4]. ID
� ===so=u=r =( =e rn=-l� n;fo=r =m a = l= =oi '=l ==�I �I ===== A=n=a=IY=S� is;lr=a=- =�=y ====� A malies II I I A bu s II no ,,--_ HI_D_ S _.... ...__ D_ , --'
Fig. 1. Classification of intrusion detection systems.
ICCST 2013
2
B. Normalization It is very common that the values obtained in each data set are not homogeneous, i.e. they are defined in different numerical scales and follow different statistical distributions. However, to make use of different values, and ensure convergence of some learning algorithms, the data must be homogeneous among themselves. The normalization process allows us to scale the values to fall within a specific range and to facilitate subsequent handling of the data. The normalization in this work was carried out using the process Z-Score, which uses the mean and standard deviation, where the new value is obtained as follows: v-v V' (1) =--
(J
Where: Vi
=
detection. They had proven to be powerful classifiers with strong capabilities of generalization and learning, with characteristics that make it feasible to use in the IDS. The unsupervised ANN allows the training without mediation of the human intervention. On the other side are self-organizing networks that are trained without supervised and neurons are grouped according to the input patterns. They have the ability to describe topological relationships between the input signals so that the most significant similarity relations between the input signals are converted into spatial relationships among neurons [4]. The works that had use ANN as a classifier for intrusion detection were oriented to anomaly detection, and misuse detection. Many of them support their processes in the use of MLP's (Multilayer Perceptron) architecture, taking as a source of information the packets TCP / IP and analyzing their different fields.
New value. Current Value. V = Average. (J = Standard Deviation. V
C.
=
Principal Component Analysis (PCA)
The principal component analysis (PCA) is a statistical technique proposed in the early twentieth century by Hotelling (1933), who was based on the work of Karl Pearson (1901) and research over orthogonal adjustments for minimal squares. Interpreting the defmitions of different authors, one can say that the PCA is a multivariate statistical technique which allows sectioning the information contained in a set of p variables of interest in m new independent variables. Each explains a specific part of information and by linear combination of the original variables making possible to summarize the total information in few components and reduce the dimension of the problem [5]. New principal components or factors are a linear combination of the original variables, and will also be independent of each other.
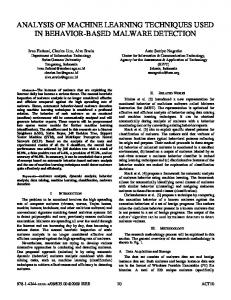
D. Artificial Neural Networks (ANN) The artificial neural networks "ANN", are a paradigm for learning and automatic processing inspired by the animals nervous system work. It is an interconnection of neurons in a network which works to produce an output stimulus [6]. The process of intrusion detection by abnormalities has as main feature: the need to identify unknown attacks through the normal behavior modeling, for this it has been frequently used technics of machine learning, highlighting the Artificial Neural Networks and the Support Vector Machines (SVM). Both techniques provide benefits in terms of its power of generalization and detection capability, but have the disadvantage that their detection efficiency is inversely proportional to the number of input features. Therefore, we can say that the use of these techniques requires correctly choose of the features for classification and tries not to affect the efficiency of the IDS and his viability [4]. The use of ANN is one of the techniques that present greater advantages in its application on systems for intrusion
Fig. 2. Perceptron (taken from http://ape.iict.ch/teachinglAIOSIAI OS_Labo/Labo4Supervised/SupervisedLeaming_files/perceptron.gif).
Each perceptron performs a weighted sum of its inputs and then apply a nonlinear function called activation function (J sigma) to produce the output of the neuron. Figure 2 shows a perceptron. In this example, b is the offset or bias of the neuron [7]. Although the classical model of the perceptron is able to solve linearly separable problems, they are not practical in solving real classification problems. For this reason the task becomes valuable to the extent that it is associated with other neurons, building an interconnected network. Typically, the axon of a neuron gives his information as "input signal" to a dendrite of another neuron and so on. The perceptron used a matrix for represent neural networks and is a tertiary discriminator who maps its input x (a binary vector) to a single output value (a single binary value) [(x) (1) through this matrix.
[(x)
=
{ 1 W.x 0
u
>
0
otherwise
(2)
Where w is a vector of real weights and w. x is the dot product, u is the 'threshold', which represents the degree of inhibition of the neuron, and it is a constant term that does not depend of the value in the input. The value of [(x) (0 or 1) is used to classify x as a positive or negative event, if we are working with a binary classification problem. The threshold can be used to compensate the activation function. The weighted sum of the
ICCST 2013
3
inputs should produce a value greater than neuron the 0 to 1. III.
u
occurring, each data set consists of a minimum of 10000 frames, where noise can be 80% as in the case of a simple attack (one cycle) of intensive port scanning done with the NMAP program, which runs approximately 2220 frames, until 10% as in the case of Flooding attack. Data Selection: In this step we select the frames to be studied. Features Extraction: In this process is extracted the fields of interest from each frame. Normalization And Dimensionality Reduction: This step is performed preprocessing the data set with the goal of obtain a set of data standardized to feed the Knowledge Base and test the hypothesis according to the case. Classification: In this step the sets obtained earlier are classified as attack or normal traffic. Knowledge Base (K B): It is the total data set already classified and properly identified, which are divided into 2/3 for the set of training and validation and 113 as test set, to avoid the overfitting in the neural network model. Learning Algorithm: Algorithm used for training the system and the parameters obtained from it are the ones we use in the classifier.. Not Classified Traffic: Unclassified data set, for feeding the classifier to determine whether it is an attack or a normal traffic. Classifier: Element of the system that classifies the frames according to the rules provided by the learning algorithm.
to change state of
PROPOSED MODEL
The bases that support the model we propose, his definition and subsequent validation are essentially three premises: • The threats are the preamble for the attack. They are not self-contained, i.e. they are implemented through a set of frames that fully provide information to the attacker over a specific vulnerability. • The threats are not the only traffic present in the data network at the time of its execution, in other words the frames that are generated in an attack are accompanied by normal traffic packets. We call noise the normal traffic in the process of data acquisition and pre-processing for classification. • In the recognition process of the system by the attacker, he doesn't expose a single type of threat, generally are a set of these, each of which provides different information. In summary, threats to a data network are composed of a set of frames with specific characteristics that seek to detect vulnerabilities in a system, which represent risks that are used to launch attacks. According to the above, we propose the following model, which was tested and validated in the following sections of this paper.
•
•
•
•
•
IV.
ACQUISITION AND DATA PREPROCESSING
A. Compilation OfData In this work was necessary obtaining a data set to allow training of the learning algorithm. For this task we used free distribution programs such as Wireshark to capture frames, VirtualBox for virtualization, NMAP to scan ports, idswakeup and hping (on Linux platform) as a source of denial of service attacks DoS. With the above first two tools we simulate attacks in a network composed for a virtual machines such as Linux (Ubuntu Server 10.11), Windows XP SP2 and Windows 7.
B. Selection and Extraction ofFeatures
Fig. 3. Proposed Model.
Where: •
Acquisition And Data Preprocessing. Acquisition Of Data: It is the process We capture the network traffic using a sniffer (Wireshark) in specific times and where We knew an attack is
Any threat of intrusion start with the exploration of the target system, and in this way obtains a list of possible vulnerabilities so we can make an attack. The only way for the attacker to have knowledge of these, is sending different types of frames that are used for this purpose, and analyze the response you receive from the target machine. According to the above is necessary to use frames that establish a connection to the target computer, put another way, using the connection-oriented frame. This condition is in the TCP frames, for this reason in this study we took into account only these, since attacks to be detected can only be carried out by establishing a connection to the target host. The following fields were selected in each frame:
4
ICCST 2013 TABLET FIELDS SELECTED FROM THE TCP FRAME
C.
Bit Length 16 8 16 16 32 32 8 16
Field Len Ttl Sport Oport Se q Ack TCPFlags Window
These features were taken, as they are the frame fields that come into play when it comes to establishing an attack or threat type DoS and port scan. The fields of the source address wasn't taken, given that it can be faked, so it is not a clear indication of threat. A program was developed in C to take the aforementioned fields of the frames that would have the identifier (06) in byte 23 (17 hex), because in this byte of the TCP / IP frames indicates the type of protocol that going in this, being 06 value corresponding to the type TCP. OltOc:
.-�'-�. Oltn. , 0 ..... OII00.�'.Olt2J. (bin. OaI1, Oue, 0..00, O.U, O_. 0II.2._, o..n, o.7d. 0.1 •• _. 0.01._. 0Il00. Oxdf. 0.19, OUI. 0...1 . Ox... 0x1•• 0"''. 0..". 0>12., 0,,10,
��.pt�� o.h.
�' ....
Od., Odd, 0.00, 0111., 0111. 0",, _. O!rfd, Odb, Ollll,
0IIl1. OlIOc:, 0..&.
..,...
Odd, 0,,011, 01100. OOll', o..tO.OII00. OdS, eDt1, 011". o••t, 0.00,010100, Oo6l, o.-" o.f., o"st. o.oo, 0.00, 0••'. 0.60.010 .... O"'S. 0.)01. 0.10. O l . O.H. Ode, 0 . 0..).1. 0."'. 0_._):
0lI-l'. 0Il00, o.01. 0x06. , 0Il00, o.w, . OloIO, o.a •. 0.01. oaot. 0.0.. 0.... 0>111. OlIn. 0..11. 0.10. 011)0. .
00. 0.0. 0ll1f
CIIoOf OlIOO
0.00, o.bl. , 0.00, o.ot, 01