Available online at www.sciencedirect.com Available online at www.sciencedirect.com
Procedia Engineering
ProcediaProcedia Engineering 00 (2011) Engineering 15 000–000 (2011) 2892 – 2896 www.elsevier.com/locate/procedia
Advanced in Control Engineeringand Information Science
Making of Intelligent Data Processing System of the Experiment in the Coefficient Determination of the thermal Conductivity JIANG Xing-fanga*, LI Fenga, LI Xianga, OUYANG Jifangb b
a School of Mathematics & Physics, Changzhou University, Changzhou, 213164, China School of Mechanism & Engineering, Changzhou University, Changzhou, 213016, China
Abstract For solving the questions the intelligent processing system of data in the coefficient determination of the thermal conductivity based on MTB (Multimedia ToolBook) had been developed. The questions included the accuracy of the report results for students. The accuracy could not be checked by teachers. In particular, the questions were in the experiment for the coefficient determination of the thermal conductivity. There were many difficulties when the students developing the intelligent system. The difficulties included how to handle the data of the experiment in extracurricular activities of science and technology. The difficulties were how to obtain the number of the experiment data, how to get the temperature values by interpolation, and how to realize the intelligent look-up-table. The difficulties were studied hard for half year and the intelligent system that guided by the professor had been developed successfully. The achievement was shown two aspects. The first one was that the intelligent system was suit for physics experiment teaching for every physics teachers and students whom were learning physics experiment in Changzhou University. The second one was that the students’ skills of the science experiment, students’ scientific thinking and innovation, and the students’ realistic scientific styles had been developed and trained in the process of developing the intelligent system.
© 2011 Published by Elsevier Ltd. Open access under CC BY-NC-ND license. Selection and/or peer-review under responsibility of [CEIS 2011] Keywords: Information Science; Physics experiment; data processing; Multimedia; intelligent look-up- table
* Corresponding author. Tel.: 086 0519 85880088; fax: 086 0519 86330301. E-mail address:
[email protected].
1877-7058 © 2011 Published by Elsevier Ltd. Open access under CC BY-NC-ND license. doi:10.1016/j.proeng.2011.08.544
2
JIANG Procedia Engineering Engineering 00 15 (2011) (2011) 000–000 2892 – 2896 JiangXing-fang Xing fangetetal. al// Procedia
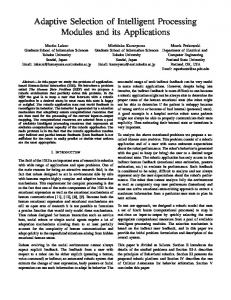
1. Introduction The training goal of Physics experiment teaching was to develop students’ skills of the science experiment, to develop students’ scientific thinking and innovation, and to train realistic scientific styles. The styles were the theory with practice, serious scientific attitude, and active spirit of exploration [1]. With the rapid development of science and technology, the higher education was from elite education stage to mass education stage. The physics experiment teaching must adapt to the society of human knowledge, ability, and the quality of the increasingly in curriculum, teaching content, and teaching models and methods. The teaching reform was adapted to the social requirements such as the practical ability, creative ability, employ ability, and entrepreneurship ability. A series of the interesting experiments, design experiments, semi-quantitative experiments, students self-experiments had been described in reference [2]. These experiments such as the study of measuring the rotational inertia of hangers, pencil pendulum experiment, a diffraction grating based on CD experiment were developed. This paper was based on information technology [3-5] to develop an intelligent data processing system of physical experiment by students. 2. Coefficient determination experiment of the thermal conductivity The experiment in the coefficient determination of the thermal conductivity is an important thermal experiment. When the two bodies were in contact, the heat was transferred from the hotter object to the colder object. The process was known as thermal conduction. The thermal conduction was decided by the heat which passed through the cross section per unit time, the temperature gradient, the coefficient of the thermal conductivity when the transferred direction of heat was fixed. There were two copper plates in the experiment. The heating plate was on the top and the cooling plate was on the bottom shown in figure 1. The sample was in the center of the two plates and transferred the heat from the heating plate to the cooling plate. There were two thermocouples for measurement temperatures of the heating plate and the cooling plate. One of them was connected the heating plate and the ice water mixture. The other one was connected the cooling plate and the ice water mixture. The electromotive forces caused by the temperature difference were measured by the thermocouples. The steady state of the heat conduction was arrived when the heat transferred from the heating plate to sample was equal to the heat was sent out from the sample to surrounding air. The heating rate of the sample was equal to the rate of the heat sent out. The experiment method was that the heating rate was obtained from the rate of the heat sent out. The thermal conductivity of the sample was obtained from formula (1). − cmKh(D + 4δ ) (1) λ= 1 πD 2 (T1 − T2 )(D + 2δ ) 2 Where, c was noted the heat capacity of the cooling plate, m was noted the mass of the cooling plate, h was noted the thickness of the sample, D was noted the diameter of the cooling plate, δ was noted the thickness of the cooling heat plate, T1 and T2 were temperatures of the heating plate and the cooling plate respectively in steady state. The heat conduction rate of the sample was decided by the rate of the heat sent ΔT . out K = Δt T =T2 There were four difficulties to develop the intelligent system for the coefficient measurement of the thermal conductivity. The first one was how to get the temperature by look-up table in developed intelligent system. The second one was how to draw the curve that was the relationship between the temperature of the cooling plate and the time. The third one was how to draw the tangent line and to obtain the slope. The fourth one was how to calculate the coefficient of the thermal conductivity and to estimate the uncertainty.
2893
2894
al. / /Procedia – 2896 Jiang XingJIANG fang etXing-fang al Author et name ProcediaEngineering Engineering15 00(2011) (2011)2892 000–000
Data holes
Power hole
Power on/off
Hot cylinder Heating plate Sample Cooling plate
Thermocouple1
Thermocouple2
Insulation cup
Voltmeter mV
Count time s
PID
ⅠⅡ Start High Cut External Ⅰ Heating Start/ potentionmeter Signal Reset Ⅱ Cooling stop Fan Manual Lower selection button buttonpowerControl Manual mode control
Fig. 1. Experimental device diagram of the thermal conductivity determination
3. Intelligent look-up-table and the linear interpolation To solve the above problems, the Multimedia ToolBook as a preferred development tool [6-7] was used. In the interface there were many objects such as the topic, the data table, the shown result, the suggested region, coordinates and axes, experimental points, tangent line, buttons. The buttons included “Clear”, “default”, and “Calculation”. The “Calculation” button was programmed with intelligent function. The intelligent function was abilities of intelligent diagnosis and rapid computing capacity. The button of “Clear” was used to initialize. The all data in the fields would be removed when the button was clicked. The fields were included refillable fields and shown fields. The button of “Default” was shown the default data. The default data were input was very faster and was significant because the number of the experiment data was more. The default data was effective and the chance of error was reduced. The button “Calculation” was operated the entire intelligence system. The functions were as follow. The diagram of the button of “Calculation” was shown in Figure 2. 3.1. Mouse entered / left events The “arrow” shape was charged to “hand” shape when the mouse went on the button of “Calculation”. It indicated the state was an operational state and the prompt was shown in the field90 as “Are the test data entered? Click it if the data were input.” The “hand” shape was returned to “arrow” shape when the mouse left the button of “Calculation” and the prompt was shown in the field90 as “Back”. 3.2. Mouse clicked event There were many contents in the event of “to handle buttonclick” to the “Calculation” button program. The arrays were signed at first. The arrays were stored the data of the electromotive forces caused by the temperature difference. The arrays were stored the relationship table between the electromotive forces and the temperature difference. The arrays were stored the values of the temperature by look-up-table and linear intercept. The arrays were stored the data of the cooling plate near the temperature in ready state. The arrays were shown the experiment results as well as. The experiment results included the rate of cooling heat in cooling heat plate and the coefficient of the thermal conductivity. The arrays included the 34 arrays for storing the data of the electromotive forces, the 139 arrays for the electromotive forces and the temperature difference, the 34 arrays for storing the values of the
3
JIANG Procedia Engineering Engineering 00 15 (2011) (2011) 000–000 2892 – 2896 JiangXing-fang Xing fangetetal. al// Procedia
4
temperature calculated by look-up-table and linear interpolation, the 24 arrays for storing the data near the temperature in ready state, and several arrays for showing the experiment results. Arraies set
Promption
NO
Number of data n>15 ? YES Table of the electromotive force and the temperature
Linear interpolation and rounding
NO
The value of emf was same as the table?
YES Shown Temperature Assigned the same value from the last datum to end point Shown experiment points Shown experiment curve Obtained the average slope Shown tangle line Calculated and shown the coefficient of thermal conductivity
Fig. 3. Coefficient determination of the thermal conductivity
Fig. 2. The diagram of the button of “Calculation”
2895
2896
al. / /Procedia – 2896 Jiang XingJIANG fang etXing-fang al Author et name ProcediaEngineering Engineering15 00(2011) (2011)2892 000–000
The smart identification was very important after the arrays were signed. The intelligent system did not work when the number of the data was less than 15 and the prompt was shown in the field90 as “Enter the complete experimental data, please.” The number of experiment data n ( n ∈ [15, 22] ) was identified by the intelligent system. The experiment data was the data of the electromotive forces caused by the temperature difference. To obtain the temperatures there were two steps. The first one was that one of the experiment data was equal to the datum of the table and the temperature was displayed at once. The second one was that one of the experiment data was not equal to the datum of the table and the method of linear interpolation was used. The law of the 4 off 5 carried was used in the linear interpolation and the temperature was displayed in the right interface domain. The experiment points were displayed in appropriate position of the interface. The slope of the curve near the temperature in ready state that the curve was the relationship between the temperature of the cooling plate and the time was obtained by the slope average method of many points. The tangent line in the temperature in ready state was drawn. The coefficient of the thermal conductivity was calculated based on the formula (1) and the uncertainty was estimated. The uncertainty was retained one digit and the digit was aligned to the end digit of the significant figures. The results were shown in figure 3. 4. Conclusions Physics was originated in Physics experiment and was the foundation of nature science. Physics was an important foundation subject for well-trained in discovering problems, analyzing problems, and solving problems. Physics experiment played a supporting role for the study of physics. The experimental data processing was important mean for obtaining the correct experimental results. The intelligent system was developed by students Extracurricular Activities directed by the professor. The intelligent system of physics experiment data processing was beneficial of physics experiment teaching for teachers and students. The techniques of the “smart look-up-table”, “linear interpolation”, “intelligent diagnosis”, and other statistical techniques could also be extended to chemical, biological and other disciplines. Acknowledgements This paper authors express their sincere thanks to the reviewer for suggestions and comments. This work was supported by the practices issues of creative train plan of Jiangsu province (SCZ0905133F) and Open Issues of Jiangsu Key Lab of Modern Optical Technology, Soochow University (KJS1004). References [1] Huo Jianqing. “The guiding ideology and the content interpretation of the College Physics Experiment basic requirements” . Physics and Engineering. 2007, Vol. 1, 17. pp. 5-9 (in Chinese) [2] Wang Sihui, Su Weining, Zhou Jin. “Simplifying and deepening the University Physics experiment”. Physics experimention. 2007, Vol. 5, 27 . pp. 28-30 (in Chinese) [3] Wang Lihong. “MathCad-based research on college physics experiment data processing”. Experimental Science and Technology. 2007, Vol. 6, 5. pp. 4-5 +58 (in Chinese) [4] Ramon Rubio Garcia, Javier Suarez Quiros, Ramon Gallego Santos, et al. Interactive multimedia animation with Macromedia Flash in descriptive geometry teaching[J]. Computer and Education. 2007, 49, pp. 615-639 [5] Xuangui Xin, Jiang Xing Fang. Multimedia software development and application of physics teaching. Shanghai: East China Normal University Press. 2001. [6] Jiang Xingfang, BI Tianyu, Chen fangfang, Jiang Zhongyi. “Making of the intelligent calculation system for physical parameters of oceanic internal wave”. IEEE, SOPO, 2010. [7] Jiang Xingfang, Jiang Hong. “Making of intelligent processing system of experiment data in physics experiment”. IEEE, FSKD’09, 2009, 2. pp. 257-261.
5