Karyotis V, Kakalis A, Papavassiliou S. Malware-propagative mobile ad hoc networks: asymptotic behavior analysis. JOURNAL OF COMPUTER SCIENCE AND TECHNOLOGY 23(3): 389–399 May 2008
Malware-Propagative Mobile Ad Hoc Networks: Asymptotic Behavior Analysis Vasileios Karyotis, Anastasios Kakalis, and Symeon Papavassiliou∗ Network Management and Optimal Design Lab (NETMODE), School of Electrical and Computer Engineering National Technical University of Athens (NTUA), Athens, Greece E-mail: {vassilis, kakalis}@netmode.ntua.gr;
[email protected] Revised February 10, 2008. Abstract In this paper, the spreading of malicious software over ad hoc networks, where legitimate nodes are prone to propagate the infections they receive from either an attacker or their already infected neighbors, is analyzed. Considering the Susceptible-Infected-Susceptible (SIS) node infection paradigm we propose a probabilistic model, on the basis of the theory of closed queuing networks, that aims at describing the aggregated behavior of the system when attacked by malicious nodes. Because of its nature, the model is also able to deal more effectively with the stochastic behavior of attackers and the inherent probabilistic nature of the wireless environment. The proposed model is able to describe accurately the asymptotic behavior of malware-propagative large scale ad hoc networking environments. Using the Norton equivalent of the closed queuing network, we obtain analytical results for its steady state behavior, which in turn is used for identifying the critical parameters affecting the operation of the network. Finally, through modeling and simulation, some additional numerical results are obtained with respect to the behavior of the system when multiple attackers are present, and regarding the time-dependent evolution and impact of an attack. Keywords
1
wireless ad hoc networks, infection efficiency, closed queuing networks
Introduction
Wireless ad hoc networks have become recently very popular for supporting modern networking requirements under various application environments and scenarios. At the same time, significant concerns have been raised for the security of networking systems and more specifically wireless networks. Considerable effort has been put in modeling and studying the behavior and impact of malicious software (malware) propagation, mainly in wired networks that span most of the economic and popular services[1] . Such a modeling is rather important for realizing correctly the potentials of active attacks and the parameters related to them, which in turn can be used for developing robust and efficient networks. Early attempts to model malware spreading in wired networks were based on techniques from the field of epidemics[2] , properly modified to comply with computer network operation[3] . Such models are of deterministic nature, and their main objective is to formulate an ordinary differential equation describing the behav-
ior of the system (through the node infection and recovery rates), leading eventually to an analytical time function of the number of infected nodes. For different types of malware threats, the basic ordinary differential equation (corresponding infection and recovery rates) has been modified[4−6] , in order to encapsulate various types of attack behaviors (infection models) and reactions (recovery mechanisms). However, more accurate description of the behavior of the system cannot be achieved, because of the single-parameter variability of such approaches. Despite the volume of work aiming at wired networks[3−8] , wireless ad hoc networks have not yet received similar attention. In addition, the stochastic behavior of the malicious nodes and the unpredictable nature of the wireless environment make deterministic approaches unsuitable for such types of networks. In this paper, on the basis of the theory of closed queuing networks, we propose a probabilistic model that is able to model and capture the aggregated behavior of a large ad hoc network attacked by a malicious node, where legitimate network nodes are prone to propagate
Regular Paper ∗ Corresponding author, phone: +30 210 772–2550, fax: +30 210 772–1452. This work was partially supported by Greek General Secretariat for Research and Technology of the Ministry of Development (PENED project under Grant No. 03ED840).
390
J. Comput. Sci. & Technol., May 2008, Vol.23, No.3
infections they receive to their neighbors. In order to focus on the generic behavior of the network we use the Norton equivalent representation of the proposed closed queuing network model that allows us to acquire asymptotic analytical results of the behavior of the system in its steady state. Depending on the acquired relations, we are able to identify the critical system parameters and the way they affect the operation of the network. In order to analyze the influence of various system parameters on the network operation and identify which of them can be exploited by an attacker for increasing its effectiveness or by the network itself for enhancing its robustness, we focus on the average number of infected nodes and the average throughput of the non-infected queues of the Norton equivalent system, which can be indicative of the overall asymptotic system behavior independently of a specific network instant. Furthermore, the Infection Efficiency (IE )[9] of an attack is obtained through simulation and used as a comprehensive attack evaluation metric in order to assess the impact of attackers on the network for a specific time period and scenario, indicating potential shortterm variations and effects. Finally, some insight regarding the behavior and evolution of the system when multiple attackers operate simultaneously and independently in the network, is gained via modeling and simulation. The rest of the paper are organized as follows. In Section 2 we describe the system model assumptions and the node infection model under consideration, while in Section 3 the proposed closed queuing network and its corresponding Norton equivalent models are presented. In Section 4, the steady state behavior of the aggregated system is acquired, and in Section 5 the system evaluation metrics are described and analyzed. Section 6 presents some numerical and simulation results, while Section 7 concludes the paper and presents some future work. 2
System and Network Infection Models
We consider a network of N legitimate nodes and a single attacker, all with a common transmission radius R. We assume that all the nodes are randomly and uniformly spread over the deployment region of the network and are able to move around the network area according to the random walk mobility model with wrapping[10] . Essentially, the random geometric graph representation of a wireless ad hoc network follows[11,12] . In order to better demonstrate the proposed model and ensure the ergodicity of the under-
lying Markov chain, we assume that all the nodes are alive for the duration of the studied time interval, i.e., no energy constraints are considered. Throughout our study, two network nodes are considered as connected whenever each one lies within the other’s transmission radius. Legitimate nodes can be in one of two states, namely infected or non-infected. Infected nodes are expected to initiate recovery processes in order to return to their previous non-infected state. However, as attackers might have available several types of malware or an infected node might not immunize itself permanently from a specific type of attack, a recovered node is prone to become infected again, by a different or possibly the same threat (e.g., when not patched properly). Thus, a node starting at the non-infected state (i.e., being susceptible to receive infections) will become infected at some time instant, in which case it will transit to the infected state, and after a recovery process it will return to the non-infected state, being again susceptible to further infections. This infection model is referred to as Susceptible-Infected-Susceptible (SIS)[2] , as opposed to other possible infection models, most notably the Susceptible-Infected-Removed (SIR), where a node is removed after the recovery process (indicating permanent immunization of the node). Essentially, a legitimate node will oscillate between the infected and non-infected state as long as active threats are present in the network deployment region and more specifically in the neighborhood of the node. A network node might have multiple links with infected neighbors and/or the attacker(s) and is prone to receive infections from any one of these links. Moreover, these infections are assumed to arrive in a nondeterministic fashion. The recovery process is of similar nature, but not necessarily of the same statistical type. Throughout our analysis, following current literature paradigm[8,9,13] , we assume that the arrival process of infections in each link of a legitimate node is Poisson, while the recovery process of each network node is exponentially distributed. We denote by λi the infection arrival rate of link i and by µj the recovery rate of node j. The described node infection model can be mapped to that of an M/M/1 queue, where an infection corresponds to an arrival that requires service, and the recovery process to the service itself[9,13] . 3
Closed Queuing Network Model
The set of legitimate nodes of the attacked ad hoc network can be separated at any instant in two subsets, the first one consisting of the currently infected
Vasileios Karyotis et al.: Malware-Propagative Mobile Ad Hoc Networks: Asymptotic Behavior Analysis
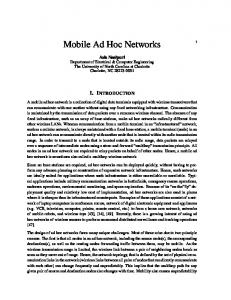
nodes and the second containing the non-infected ones. By mapping each legitimate node with its links to an M/M/1 queue, as described above, each subset of nodes can be represented by a set of queues, and thus the network of legitimate nodes by a closed multi-queue network, as shown in Fig.1.
391
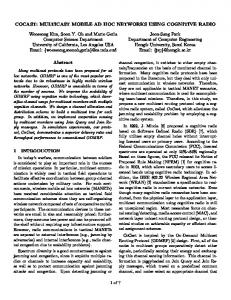
non-infected, it will lie in the upper group and its service rate will be determined by the number of links that the node has with currently infected nodes and the attacker (the sum of the corresponding link infection rates due to the assumption of exponential distribution). The corresponding rate of the node in its queue in the group of infected queues will be naturally µi = 0, as long as the node remains non-infected and thus in the upper group. Dealing with the closed queuing network of M/M/N queues directly is somewhat cumbersome and in many cases intractable. To overcome this problem we produce the Norton equivalent of the system and solve that instead[14] . In the Norton equivalent, each of the M/M/N subsystems is substituted with an M/M/1 subsystem, whose total rate is equivalent to the rate of the original. In our case, since the queues of each subsystem are parallel and because of the fact that all the service rates are exponentially distributed, the rate of the equivalent subsystem will be the sum of the corresponding rates. Consequently, the Norton equivalent of the original system will have the form shown in Fig.2. Explicit definition of each queue’s service rate, i.e., λ(N −i+1) and µ(i), depends on the specific model parameters and assumptions and constitutes a necessary step for solving the system analytically.
Fig.1. Closed queuing network model.
As the nodes in each subset are independent, the queues representing a subset are parallel. Furthermore, according to the SIS infection paradigm, nodes cycle through the non-infected and infected subsets for the duration of an attack. Consequently, the output of the queues representing the set of non-infected nodes becomes the input of the queues corresponding to infected nodes and the output of the latter becomes the input of the first one, respectively. Without loss of generality, in the following we assume that the upper-part queues of Fig.1 represent the set of non-infected nodes, while the lower-part queues represent the set of infected nodes.
Fig.2. Norton equivalent of the closed queuing network model.
Each node has its own queue in each of the infected or non-infected group of nodes, so that there are N queues in each one of the two groups (infected and noninfected). However, at every time instant a node is actually in only one of the two groups, leaving its queue in the other group empty. By this mapping, each group of nodes corresponds to an M/M/N system, where the instantaneous service rate of each queue is set according to the state of the node (infected or non-infected) and current topological characteristics. Thus, if a node i is
The Norton equivalent of the original queuing system consists of a two-queue closed queuing network, where N packets, i.e., legitimate nodes, circulate. At any instant, if i nodes are infected, then N − i are noninfected. Both service rates are state-dependent according to the number of packets (nodes) in the corresponding queue. Without loss of generality, we assume that the lower queue represents the group of infected legitimate nodes and denote it as “infected”, while the upper queue represents the non-infected nodes and we denote
392
J. Comput. Sci. & Technol., May 2008, Vol.23, No.3
the queue as “non-infected”. It should be noted that the state-dependent service rate of the non-infected queue depends not only on the number of currently non-infected nodes N − i, but the attacker as well, since even when all nodes are noninfected, infections are possible due to the attacker’s existence. This means that the corresponding Markov chain of the system is not absorbing in the state of “all nodes non-infected”. The notion of state-dependent service rate of the non-infected queue can be extended to the case of multiple attackers, in which case the service rate will have the form λ(N − i + M ), M being the number of attackers. Our analysis here is focused on the case of a single attacker (i.e., M = 1), while some insight for the case of multiple attackers is obtained through simulation in Subsection 6.2. 4
For the analytical study of the system, we focus on the infected queue of the Norton equivalent. Its steady state distribution, denoted by π(i), represents the probability that there are i packets (nodes) in this queue. Using balance equations for the respective Markov chain, the explicit expression for the steady state distribution can be obtained as: i Y λ(N + 1 − i + j) µ(j) j=1
(1)
where π(0) is the probability of no infected nodes in the PN network. Applying the normalization condition i=0 π(i) = 1, we get: π(0) ·
N Y i X λ(N + 1 − i + j) = 1. µ(j) i=0 j=1
NX −i+j
λ(N + 1 − i + j) = λπ
³ R ´2 L
km λm
NX −i+j
km
m=1 (N − i + j) N −i+j = λ · K(i) · (N − i + j)
(i − j + 1)(N − i + j). (3)
Using (3) for the total infection rate, relation (2) becomes: π(0) ·
N Y i h X λπ ³ R ´2 (N − i + j)(i − j + 1) i = 1. µ L j i=0 j=1
By setting α−1 = comes: π(0) ·
λπ µ
¡ R ¢2 L
, the above expression be-
N Y i h X 1 (N − i + j)(i − j + 1) i =1 α j i=0 j=1
(4)
which can be reduced to: π(0) ·
N h³ ´i X 1 i=0
α
N! i = 1. (N − i)!
(5)
Setting N −i = k and changing the summation index to k, (5) becomes: π(0) ·
N h X k=0
m=1
=λ
πR2 πR2 (N − (N − i + j) + 1) = (i − j + 1) L2 L2
(2)
Assuming that all legitimate nodes have the same link infection rate λ, i.e., λi = λ, ∀i ∈ {1, 2, . . . , N }, and the same recovery rate µ, i.e., µi = µ, ∀i ∈ {1, 2, . . . , N }, the total P recovery rate of the infected queue will be µ(i) = i µi = i · µ. The total infection rate of the non-infected queue is obtained as follows: λ(N + 1 − i + j) =
K(i) =
where i − j + 1 is the total number of currently infected nodes (including the attacker). Thus, the value of the total infection rate of the non-infected queue becomes:
Steady State Analysis of the Norton Equivalent
π(i) = π(0) ·
where km is the number of infected nodes (including the attacker) within the neighborhood of a legitimate node indexed by m. The sum of the partial node infection rates (km λm ) spans the number of the non-infected nodes (N − i + j) at the considered instance of the system. The sum of all km ’s divided by the total number of summands yields the average number K(i) of infected neighbors for a node, which depends on the number of currently infected legitimate network nodes i, as expected. Taking on the non-infected node’s viewpoint, the average number of infected neighbors for a network with the aforementioned node placement and mobility assumptions is as follows:
1 αN −k
N!i =1 k!
or equivalently N N ! · π(0) X αk · = 1. αN k!
(6)
k=0
As the number of legitimate nodes becomes very large, the sum of (6) converges to the power series expansion
Vasileios Karyotis et al.: Malware-Propagative Mobile Ad Hoc Networks: Asymptotic Behavior Analysis
of eα . Thus, the probability of no infected nodes can be approximated as: π(0) ∼ =
αN −α ·e N!
αN −i · e−α = π 0 (N − i) (N − i)!
(8)
where π 0 (N − i) is the steady state distribution for the non-infected queue. By using relation (8), the probability of a completely infected network equals π(N ) = e−a . It is noted that the error introduced by the above approximation is negligible for values of α and N commonly used in practice, as it is demonstrated in Section 6. Relation (8) clearly indicates the critical parameters that affect the behavior of the system. Assuming a fixed area of the network deployment region, the number of legitimate nodes (i.e., the density of the network) along with the common transmission radius and the ratio of the link infection rate to the node recovery rate are decisive factors regarding the overall behavior and stability of the system. On the basis of (8), we can calculate the average number of infected nodes (the expected number of packPN ets), E[i] = i=1 i · π(i), as follows: N −1 ³ X αk−1 ´ E[i] = e−α · N eα − α (k − 1)! k=1 µ λπ = N − α = N − ³ ´2 . R L
(9)
Similarly, the average throughput of the non-infected PN queue E 0 [γ] = i=1 λ(i) · π 0 (i) can be obtained using (3) as follows: E 0 [γ] =
N X
level of study. For instance, the average throughput of the infected queue represents the average instantaneous recovery rate of the network.
(7)
and the steady state distribution can be obtained as: π(i) =
393
c(i − 1)(N + 2 − i)π 0 (i)
i=1
¡ ¢2 . After some manipulations the avwhere c = λπ R L erage throughput of the non-infected queue can be obtained as: h i E 0 [γ] = c · α(N + 2 − α) − (N + 2)(1 − π 0 (0) . (10) Additional quantities, like the average throughput of PN the infected queue E[γ] = i=1 µ(i)π(i), may be computed following the above procedure and interpreted into network terms, depending on the desired detail
5
Evaluation Metrics and Discussion
The network damage caused by malware spreading can have various undesirable forms, such as host unavailability, data corruption, or machine breakdown. In any case, the host node essentially becomes nonoperational, or at least of reduced performance. From a network perspective, we focus on such unavailability and performance degradation and consider that the imminent result of an infection actually means that an infected node remains non-operational until it recovers. In that sense, a general system-wide operationevaluation metric that captures the overall impact caused by an attacker and respective infected legitimate nodes to the network itself, should be a function of the number of infected nodes and be independent of the time interval under consideration. The quantity that effectively indicates this impact throughout the system operation is the average number of infected nodes, since it represents the overall expected network damage caused by the attacker. With respect to the Norton equivalent model, the average number of infected nodes in the network equals the average number of nodes in the infected queue E[i] given by relation (9). Furthermore, the throughput of a queue is indicative of the instantaneous service potentials of the system. Similarly, the average throughput represents the average rate of customers served over a time interval. In terms of the Norton equivalent system, the throughput of the non-infected queue is descriptive of the instantaneous total infection rate of the malicious nodes. In other words, the throughput of the non-infected queue indicates the instantaneous capability of malicious nodes to infect legitimate nodes, and therefore the average throughput of the non-infected queue E 0 [γ], obtained by (10), is indicative of the average capability of the group of infected nodes to infect the rest of the legitimate network nodes. In order to evaluate the efficiency of attackers in harming a network within a specific time period, we use a general attack-evaluation metric that captures the overall impact caused by an attacker to the network. Since unavailability of a percentage of the network for a time period causes reduced network operation, a combined metric for the number of infected nodes over a time interval is more suitable for the overall performance characterization. Therefore we use the Infection Efficiency IE , of an attack, which is defined
394
J. Comput. Sci. & Technol., May 2008, Vol.23, No.3
as the integral of the time function of the number of infected network nodes[13] , to characterize the overall performance of an attack for a specific combination of system parameters. Intuitively, IE is the product of the number of infected network nodes in an interval by the duration of the corresponding interval, and therefore provides a combined measure of the instantaneous damage (i.e., absolute value of the number of infected nodes) and the corresponding interval that the damage takes place. It should be pointed out that the first category of metrics concerning the steady-state of the system describes the behavior of the system on the average, and essentially depicts the corresponding damage induced by the attackers independently of the time period in which it takes place. On the other hand, the Infection Efficiency IE is able to capture short-term variations and can be used for assessing specific attack scenarios, indicating the induced damage in conjunction to the time interval in which the damage takes place. 6
by relation (6), for different values of the parameter α (with fixed L, different R and λ/µ yield different α). It is evident that N = 25 nodes suffice for all the instances depicted, in order for the approximation to be acceptable. It is interesting to note that for large values of R and λ/µ, N > 7 achieves perfect match between the approximated and the accurate value of π(0). Furthermore, as R or λ/µ increases, i.e., α decreases, even fewer network nodes suffice. The approximation error for other states of the steady-state distribution follows similar trends, since the probabilities of the rest of the states follow from that of the state with no infected nodes.
System Evaluation
In this section we evaluate the behavior of the considered system under different combination parameters and for different evaluation metrics. We assume the deployment network region to be square with side L = 1500m. By fixing the deployment area and varying the number of legitimate nodes, we study the behavior of the system as the network density increases from values representing sparse topologies to values corresponding to massively dense networks. As already mentioned, the analytical results presented so far describe the asymptotic behavior of the attacked network in the event of large scale networks where the number of legitimate nodes increases to infinity, i.e., N → ∞. However, in practice, ad hoc networks have a finite number of network nodes. Throughout our numerical study, in order to realize the behavior of actual systems with respect to the controllable parameters and in terms of the attacker’s impact we apply and evaluate the acquired results on finite networks. Therefore, before proceeding with the presentation of the corresponding results, we initially investigate the impact of the approximation introduced in relation (7) and demonstrate that the error incurred by this approximation is negligible for values of α and N commonly used in practice. More specifically, in Fig.3 we plot the probability of no infected nodes π(0) as obtained by relation (7) (denoted with “app” in the figure) as well as its exact value (denoted with “acc” in the figure), as it is obtained
Fig.3.
Probability of zero nodes infected (accurate-approxi-
mated).
6.1
Performance Evaluation and Numerical Results
We first focus on the probability of a completely infected network, given by: −
π(N ) = e
µ R λπ( L )2
.
(11)
Complete infection of legitimate nodes, denoted as pandemia in epidemics terms, corresponds to an ultimately successful attack that has achieved its purpose of completely damaging a network. In reality, the network has been severely damaged much earlier than total infection, as its traffic-carrying capability will have been reduced significantly by the time that a large percentage of the legitimate nodes (e.g., in the order of 80%) will be infected. In Fig.4, the probability of total infection with respect to the ratio of link infection to recovery rates is presented for various values of the node transmission
Vasileios Karyotis et al.: Malware-Propagative Mobile Ad Hoc Networks: Asymptotic Behavior Analysis
radius. Here, it should be noted that as indicated by expression (11), the probability of pandemia depends only on the transmission range, the link infection rate and the recovery rate. The number of legitimate nodes does not affect such an event. This is expected, as a denser network does not guarantee that all the nodes will be constantly infected. On the contrary, greater N allows more nodes (those placed away of the source of infection) at the early stages of the infection to remain intact. However, a greater link infection-recovery rate ratio means that every node becomes infected easier. Similarly, a greater transmission radius results in more neighbors for a single node and thus increased potential infections as the number of transmission links associated with infected nodes increases. As observed in Fig.4, higher transmission radii lead with higher probability to the pandemic state, even for values of the infection to recovery rates ratio below unity. In any case, larger values of R increase the speed of converge of π(N ) to unity. Similar observations hold for the probability of complete infection with respect to the common transmission radius for various values of the infection to recovery rate ratio. However, the behavior of the network is more sensitive to changes in the ratio λ/µ than to changes in the transmission radius R as far as the pandemic state is concerned.
395
bination of system parameters is more desirable for an attacker.
Fig.5. Average number of infected nodes vs. λ/µ.
Fig.6. Average number of infected nodes vs. R.
Fig.4. Probability of all nodes infected vs. λ/µ.
In Figs. 5, 6, 7, the average number of infected nodes, E[i], is plotted against the ratio of link infection rate to the recovery rate, the transmission radius and the number of legitimate network nodes respectively. E[i] is rather indicative of the aggregated behavior of the attacked network and provides an overall metric of the attacker’s impact on the normal operation of the network. Clearly, higher E[i] indicates that the com-
Specifically, Fig.5 presents E[i] against the ratio of the link infection to the recovery rate for two different combinations of the transmission radius and the number of network nodes. It is evident that as the ratio λ/µ increases, E[i] approaches the total number of legitimate nodes for the given network scenario. However, for larger transmission radii, the speed of increase in E[i] is higher as expected. Fig.6 presents the behavior of E[i] as a function of the transmission radius for two different values of the number of nodes and ratio of the link infection rate to the recovery rate. Again, as the transmission radius increases, E[i] approaches the total number of legitimate nodes of the specific network instance. The rate of convergence increases for higher values of λ/µ ra-
396
J. Comput. Sci. & Technol., May 2008, Vol.23, No.3
tio. Compared with the corresponding results in Fig.5, the rate of increase is faster now, since parameter R is squared in the denominator as opposed to the linear power of λ/µ in the previous case.
Fig.7. Average number of infected nodes vs. N .
ber of legitimate nodes. For demonstration purposes and simplicity in the representation, we fix the recovery rate to µ = 1 and vary only the link infection rate λ.
Fig.9. Average throughput of the non-infected queue vs. R.
The dependence of the average number of infected nodes on the number of legitimate nodes is linear as can be verified by (9) and shown in Fig.7. The combination of larger values of R and λ/µ yields the higher number of E[i] for all values of legitimate nodes, while the combination with smaller values of R and λ/µ yields the lower values of E[i]. It should be noted that the behavior of the network is more sensitive to changes in the value of λ/µ rather than variations in R.
Fig.10. Average throughput of the non-infected queue vs. N .
Fig.8. Average throughput of the non-infected queue vs. λ.
In Figs. 8, 9 and 10, the average throughput of the non-infected queue E 0 [γ] is presented against the link infection rate, the transmission radius and the num-
Specifically, in Fig.8 we show the average throughput of the non-infected queue with respect to the link infection rate for various combinations of the transmission radius and the number of legitimate nodes. It is observed that E 0 [γ] increases with increasing values of the link infection rate λ (and thus the ratio λ/µ), transmission radius R and the number of legitimate nodes N , as expected. Nevertheless, an increase in the number of legitimate nodes (i.e., node density) causes a much greater increase in the achieved throughput than an increase in the transmission radius. It is also interesting to note that for larger node densities (i.e., number of legitimate nodes) the increase in the average throughput
Vasileios Karyotis et al.: Malware-Propagative Mobile Ad Hoc Networks: Asymptotic Behavior Analysis
E 0 [γ] is larger, due to the use of a larger transmission radius. This is visible in Fig.8 by comparing the differences between curves corresponding to the same node density for large values of the link infection rate. Similar results hold in Fig.9, where the average throughput of the non-infected queue is plotted against the common transmission radius. Once more, the network density is more influential to E 0 [γ] than the link infection rate. Finally, in Fig.10, E 0 [γ] is depicted with respect to the number of legitimate nodes, i.e., node density. The relation is linear and as expected, the smaller E 0 [γ] corresponds to the combination of λ and R with smaller values, whereas the higher to the combination with larger values. 6.2
Simulation Results
In this subsection, on the basis of modeling and simulation, some numerical results are presented, in order to acquire some time-dependent insight of the corresponding attacks utilizing the metric of Infection Efficiency IE , and identify the behavior of the system and the potential gains that can be achieved by the existence of multiple attackers in the network.
Fig.11. Network evolution over time.
In Fig.11, the evolution of the number of infected nodes i is shown as a function of time for a network with N = 500 nodes, transmission range R = 200 and various values of λ/µ. It is observed that the greater the value of λ/µ, the greater the number of infected nodes of the corresponding attack for its duration. It can be also observed that after the initial transitive effect, the number of infected nodes oscillates around a mean value, and the higher the number of network nodes, the smaller the deviation around the mean value. Furthermore, for very large values of λ/µ (i.e., λ/µ = 10, λ/µ = 20), the results begin to converge, indicating the
397
existence of a threshold value of λ/µ, above which the behavior of the system is approximately the same.
Fig.12. Infection Efficiency for single attacker.
In Fig.12, the infection efficiency IE for attacks with one malicious node is shown for various combinations of system parameters. Since IE directly depends on the number of infected nodes at every time instant, it is observed that for larger transmission radii, larger λ/µ and larger network densities (i.e., larger N ), IE increases. However, the transmission radius has a smaller impact than the network density, as IE increases faster for the latter. Furthermore, there exists a threshold of R, below which IE is very low, which is attributed to the fact that for such small transmission radii, the impact of the attacker is marginal, as its neighborhood will be rather small as well. The latter is evident for the scenarios of R = 75m, the infection efficiency of which is significantly lower than their counterparts with larger transmission radii. Being indicative of the impact of system parameters in the short-term behavior of the system, IE can be further used for designing and evaluating various attack strategies, as expressed by different combinations of attacker-related parameters. For instance, in [13], IE was used for the evaluation of topology control-based attack strategies, when compared to the attacks that did not utilize any topology-dependent information. In Fig.13, the expected number of infected nodes for multiple attackers (i.e., 2 and 6 attackers) is presented for N = 200 and R = 200m. It can be observed that increasing the number of attack nodes increases E[i] as well, by a factor of 10% approximately, for all values of λ/µ. However, the increase of the attack damage does not scale proportionally to the increase in the number of network nodes, as the attack gain for the case of 2 attackers (representing a double increase in the number of attackers) is comparable to the gain of 6 attackers (representing a three-fold increase with respect to
398
J. Comput. Sci. & Technol., May 2008, Vol.23, No.3
the case of 2 malicious nodes). This happens due to the combined effect of attackers wandering around the deployment region independently and the propagative nature of the networks considered. The first translates into overlapping areas among the attackers, while the latter means that the attackers’ contribution to malware propagation is diminished as they now belong to a bigger set of malicious nodes (attackers and infected legitimate nodes).
Fig.13 Expected number of infected nodes vs. N for multiple attackers.
Fig.14. Infection efficiency for multiple attackers.
Finally, in Fig.14, the infection efficiency IE for multiple attackers is shown and compared to that of a single attacker. As expected, for the increasing number of attackers, IE increases as well for the duration of the observation period, reflecting the trend already established for the average number of infected nodes. Once more, the increase in IE does not scale linearly with the increase in the number of attackers, for the same reasons identified above.
7
Conclusions
In this paper the propagation of malware over a wireless ad hoc network is studied. The legitimate nodes were assumed to follow the SIS infection model and to be capable of propagating malware once they become infected themselves. We proposed a probabilistic model inspired by the theory of closed queuing networks that is able to capture the aggregated behavior of the system under an attack. On the basis of the Norton equivalent of the proposed model, we managed to describe the overall asymptotic behavior of the system and find its steady state behavior. The obtained analytical results were used in order to identify the critical parameters affecting the operation of the network and the impact of an attack. It is noted that in this work we assumed a common transmission radius for all nodes and addressed the problem from the network point of view. Our future work is focused on the explicit solution of the system from the attacker’s perspective (in the computation of the total infection rate of the non-infected queue, λ(i)), in order to study the cases of different transmission radii. Furthermore, the study of the transient behavior of the system, when the attacker or legitimate nodes face energy constraints and have to be removed once their energy supplies run out, is of high research and practical importance. Extending the proposed model to these cases will allow the study of topology control protocols that can be used either by the attackers in order to increase the efficiency of their attack strategies, or the legitimate network nodes in their effort to counterfeit an attacking scheme more efficiently and thus make the network more robust. It should be noted that the presented closed queuing network framework for malware propagation in principle can be used to model the propagation of active threats in any type of network where the nodes can be in one of two states at each time instant, namely infected or non-infected. In this paper, we focused on the explicit solution of the problem in mobile ad hoc networks. However, considering the specific characteristics of other types of networks (e.g., power-law graphs, complete graphs), the proposed framework allows modeling of malware spreading in a variety of closed sets and types of propagative behaviors. References [1] Peeters J, Dyson P. Cost-effective security. IEEE Security and Privacy Magazine, May–June 2007, 5(3): 85–87. [2] Pastor-Satorras R, Vespignani A. Epidemics and Immunization in Scale-Free Network. Handbook of Graphs and Net-
Vasileios Karyotis et al.: Malware-Propagative Mobile Ad Hoc Networks: Asymptotic Behavior Analysis
[3]
[4]
[5]
[6]
[7]
[8]
[9]
[10]
[11]
[12]
[13]
[14]
works: From the Genome to the Internet, Bornholdt S, Schuster H (eds.), Berlin: Wiley-VCH, 2002, pp.113–132. Chen Z, Gao L, Kwiat K. Modeling the spread of active worms. In Proc. 22nd Annual Joint Conference of the IEEE Computer and Communications Societies (INFOCOM), Vol. III, San Francisco, CA, USA, March–April 2003, 1890–1900. Zou C C, Gong W, Towsley D. Code red worm propagation modeling and analysis. In Proc. the 9th ACM Conference on Computer and Communications Security (CCS), Washington, DC, USA, November 2002, pp.138–147. Zou C C, Gong W, Towsley D, Gao L. The monitoring and early detection of Internet worms. IEEE/ACM Trans. Networking, October 2005, 13(5): 961–974. Rohloff K, Basar T. Stochastic behavior of random constant scanning worms. In Proc. the 14th International Conference on Computer Communications and Networks (ICCCN), San Diego, CA, USA, October 2005, pp.339–344. Garetto M, Gong W, Towsley D. Modeling malware spreading dynamics. In Proc. 22nd Annual Joint Conference of the IEEE Computer and Communications Societies (INFOCOM), Vol. III, San Francisco, CA, USA, March–April 2003, pp.1869–1879. Ganesh A, Massoulie L, Towsley D. The effect of network topology on the spread of epidemics. In Proc. 24th IEEE Conference on Computer Communications (INFOCOM), Vol. II, Miami, FL, USA, March 2005, pp.1455–1466. Karyotis V, Papavassiliou S, Grammatikou M, Maglaris B. On the characterization and evaluation of mobile attack strategies in wireless ad hoc networks. In Proc. the 11th IEEE Symposium on Computers and Communications (ISCC 2006), PulaCagliari, Sardinia, Italy, June 2006, pp.29–34. Le Boudec J-Y, Vojnovic M. Perfect simulation and stationarity of a class of mobility models. In Proc. 24th IEEE Conference on Computer Communications (INFOCOM), Vol. IV, Miami, FL, USA, March 2005, pp.2743–2754. Gilbert E N. Random plane networks. Journal of the Society for Industrial and Applied Mathematics, December 1961, 9(4): 533–543. Wan P-J, Yi C-W. Asymptotic critical transmission ranges for connectivity in wireless ad hoc networks with Bernoulli nodes. In Proc. the 6th IEEE Wireless Communications and Networking Conference (WCNC), Vol. 4, New Orleans, LA, USA, March 2005, pp.2219–2224. Karyotis V, Papavassiliou S, Grammatikou M, Maglaris B. A novel framework for mobile attack strategy modeling and vulnerability analysis in wireless ad-hoc networks. International Journal of Security and Networks (IJSN), 2006, 1(3/4): 255– 265. Lazar A A. Optimal control of an M/M/m queue. In Proc. the ACM SIGMETRICS Conference on Measurement and Modeling of Computer Systems, Performance Evaluation Review, College Park, Maryland, USA, April 1982, 11(1): 14–20.
Vasileios Karyotis received the diploma in electrical and computer engineering from the National Technical University of Athens, Greece, in 2004 and the M.Sc. degree in electrical engineering from the University of Pennsylvania, Philadelphia, in 2005. Currently, he is a Ph.D. candidate at the School of Electrical and Computer Engineering, National Techni-
399
cal University of Athens. Since June 2007 he has been the recipient of one of the two departmental fellowships of the School of Electrical and Computer Engineering, National Technical University of Athens. His main research interests span the areas of topology control and malware propagation in wireless ad hoc/sensor networks, resource allocation in CDMA-based ad hoc networks and the applications of queuing theory and point processes in wireless ad hoc networks. Anastasios Kakalis is a senior year student at the School of Electrical and Computer Engineering, National Technical University of Athens, Greece, working on his senior year project. In 2003 and 2006 he worked as a web-developer and teaching assistant in training seminars for using personal computers and common desktop applications. His main research interests lie in the area of ad hoc/sensor networks and malware propagation. Symeon Papavassiliou received the diploma in electrical engineering from the National Technical University of Athens, Greece, in 1990 and the M.Sc. and Ph.D. degrees in electrical engineering from Polytechnic University, New York, in 1992 and 1995, respectively. Currently he is with the Faculty of Electrical and Computer Engineering Department, National Technical University of Athens. From 1995 to 1999, Dr. Papavassiliou was a senior technical staff member at AT&T Laboratories in Middletown, New Jersey, and in August 1999 he joined the Electrical and Computer Engineering Department at the New Jersey Institute of Technology (NJIT), where he was an associate professor until 2004. Dr. Papavassiliou was awarded the Best Paper Award in INFOCOM’94, the AT&T Division Recognition and Achievement Award in 1997, and the National Science Foundation (NSF) Career Award in 2003. Dr. Papavassiliou has an established record of publications in his field of expertise, with more than one hundred and fifty technical journal and conference published papers. His main research interests lie in the area of computer and communication networks with emphasis on wireless communications, high-speed networks, ad-hoc and sensor networks, vehicular networks, and distributed computing.