Management Systems in Production Engineering Date of submission of the article to the Editor: 04/2015 Date of acceptance of the article by the Editor: 06/2015
2015, No 3 (19), pp 142-146 DOI 10.12914/MSPE-05-03-2015
COMPUTATIONAL SIMULATION OF FIRE DEVELOPMENT INSIDE A TRADE CENTRE Constantin LUPU, Nicolae Ioan VLASIN, Cristian TOMESCU, Vlad Mihai PĂSCULESCU, Marius Cornel ŞUVAR National Institute for Research and Development in Mine Safety and Protection to Explosion INSEMEX PETROSANI – ROMANIA Abstract: Real scale fire experiments involve considerable costs compared to computational mathematical modelling. This paperwork is the result of such a virtual simulation of a fire occurred in a hypothetical wholesale warehouse comprising a large number of trade stands. The analysis starts from the ignition source located inside a trade stand towards the fire expansion over three groups of compartments, by highlighting the heat transfer, both in small spaces, as well as over large distances. In order to confirm the accuracy of the simulation, the obtained values are compared to the ones from the specialized literature. Key words: CFD, FDS, simulation, burning, fire
INTRODUCTION In order to understand, predict and describe the development of a burning and its’ influence on the surrounding environment, there are used a series of scientific methods in whose development are involved both practical experiments and mathematical modelling. The achievement of real scale experiments or even at a proportionally decreased scale, involves substantial costs, as well as a high work volume. Once with the development of the knowledge from this field and with the computers’ processing power increase, the prediction of the volume and direction of smoke, of the toxic and flammable gas concentrations and the calculation of pressures and temperatures due to burnings have experienced a significant progress and have decreased the costs to a reasonable level. Computational modelling of fires in closed spaces comprises two distinct methods: zone type modelling and field type modelling. The first method involves dividing the considered space in two distinct control volumes: an upper volume containing burned and hot gases engaged by the fire, and a lower volume with fresh and cold air content. Through the second method, the domain is divided in a large number of control volumes, proportional to the dimensions of the objects comprised in the simulation. For these volumes, through the CFD technique (Computational Fluid Dynamic), there are calculated the state equations of the gases and the mass, moment and energy conservation equations. In case of fires, there are used both models for combustion and models for turbulences and thermal radiations, flame propagation, ashes quantity, etc. This method has become not only a tool for the researchers but it also has applicability in the conventional engineering of fires for the optimization of the buildings’ safety. The accuracy of computational simulations depends, for example, on the resolution of the network of volumes, but especially on the limitations and uncertainties of the applications from this relatively new domain.
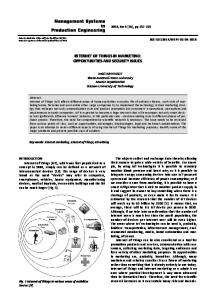
SIMULATION OF A FIRE OCCURRED IN A HYPOTHETICAL WHOLESALE WAREHOUSE The objectives of the virtual simulation of the fire using FDS software aims to estimate the temperatures occurred at the level of a trade stand in which there were stored various goods of more or less combustible content, the development of the fire from the occurrence of the ignition source until the burning of the entire trade stand, and depending on these estimated temperatures, the approximation of the flame front propagation outside the compartment and released heat quantity, hot gases and smoke migration inside the wholesale warehouse [2]. The development of the fire inside a compartment In order to initiate the burning inside a compartment, there has been taken into account a supposed ignition source located in a trash bin from nearby a wooden shelf. At a 0.154 m distance from the trash bin there is a cardboard box. On the shelves there are stored textiles and other cardboard boxes. In the middle of the room there is a chair and a table, both made of wood. The trading stand is made of PVC carpentry (Fig. 1).
Fig. 1 Geometry of the trading stand
Management Systems in Production Engineering 3(19)/2015
143
C. LUPU, N.I. VLASIN, C. TOMESCU, V. M. PĂSCULESCU, M. C. ŞUVAR - Computational simulation of fire development inside... Table 1 Materials Characteristics Material/ Substance Wood
Density [kg/m3] 640
Specific heat [kJ/(kg·K] 2.85 1.29 (23˚C) 1.35 (50˚C) 1.47 (100˚C) 1.59 (˚C)
Thermal conductivity [W/(m·K)] 0.14 0.192 (23˚C) 0.175 (50˚C) 0.147 (100˚C) 0.134 (˚C)
Heat release [kJ/kg] 17000
Heat release per unit area [kW/m2] 200
Ignition temperature [˚C] 240
PVC
1380
20000
312
390
Corrugated cardboard
250
1.336
0.05
18000
150
218-246
Plastic
950
1.67
0.18
31000
400
349
Textiles
240
1.357
0.1
17000
250
220
After the discretization of the geometry, there resulted a mesh with 718.008 cells. The trading stand has a 3.75 length, a width of 3.37 m and the height of 3.4 m, resulting in a total volume of 42.97 m3. The distances between the shelves vary between 0.5 and 0.7 m, and the distance between the top shelf and the ceiling is 0.96 m. The atmospheric conditions frame into the normal limits, meaning: atmospheric pressure: 1.01325x10⁵ Pa, temperature inside the warehouse: 20˚C, relative humidity: 40%. The characteristics of the materials used are presented in Table 1 [1, 3, 4, 6, 7]. Ignition source In the tested scenario, the ignition source initiates the burning process of the plastic bin within a time periods which represents the sum of the pyrolysis time of the solid and the induction time of the gaseous phase. Once with the flow rate increase, the heat flux per area increases, and the required time for heating and for the pyrolysis of the solid decreases consequently. On the other hand, an increase of the gas rate will result in a decrease of the flux residence time. This phenomenon will delay the onset of the chemical reaction or will even avoid its’ initiation. The presence of a driven (piloted) ignition affects the combustion process by local decrease of induction time. The solid heating is the predominant mechanism in the combustion process, with a low rate of the gas flux and with a normal concentration of oxygen. Fig. 2 presents this ignition model, having a very short time of ignition – approx. 7.8 seconds.
In case of a non-driven ignition (Fig. 3), the induction time increases significantly, and flames occur spontaneously as a result of the progressive heating of the combustible material. At the same time of 300 seconds from enabling the ignition source, the maximum temperature reached has been 53˚C and increasing.
Fig. 3 Non-driven ignition
Flame propagation Flame propagation over solid surfaces may be seen as a continuous process of driven ignition. In order for the flame to propagate, in front of it there must be transferred enough heat from the flame or from other heat sources. Vaporized fuel is then released and convectively transported outside the area, where it mixes with oxidants and forms the flammable mixture in the area from the front of the flame, following to be ignited by it.
Heat transfer Based on the 2nd thermodynamic principle, heat transfer has three components: transfer by radiation, transfer by conduction, transfer by convection. Fig. 4 presents the three phases of the thermal transfer. The 1st phase (Fig. 4a) represents a start moment in heat transfer from the object containing the source, object already in the burning process, towards the neighbouring cardboard box. This transfer is carried out horizontally, and it is based more on radiative transport, phenomenon amplified in the 2nd phase, once with the increase in temperature. Fig. 2 Driven ignition
144
Management Systems in Production Engineering 2(18)/2015 C. LUPU, N.I. VLASIN, C. TOMESCU, V. M. PĂSCULESCU, M. C. ŞUVAR - Computational simulation of fire development inside...
a)
b)
c)
Fig. 4 Heat transfer: a) heat transfer – 1st phase, b) heat transfer – 2nd phase, c) heat transfer – 3rd phase a)
b)
d)
c)
Fig. 5 Flame propagation inside the trade stand
The convective transport of heat starts also in the 1st phase, being carried out by hot gases elevation towards the above shelves, pre-heating their material. In the 2nd phase, the radiative transport of heat brings the temperature of the boxes’ surface to the value of nondrive ignition, so to a value at which a spontaneous ignition of the material occurs and implicitly to an increase of the hot gases quantity which rises towards the ceiling of the trading stand (Fig. 4b). The 3rd phase is characterised by an increase in heat flux towards the shelves from the upper proximity, flux which is achieved through convective transfer based on hot gases elevation (Fig. 4c). The temperature of the shelves reaches and exceeds the ignition threshold, the front of the flame spreading itself in the compartment. The various phases of fire evolution within a compartment are presented in Fig. 5 (a, b, c, d), and the moment when the flame propagates outside the trading stand is presented in Fig. 6.
Heat release rate The development of a fire is generally characterised in terms of released heat rate versus time. The released heat rate is not a fundamental property of a fuel and that is why it cannot be calculated from the main properties of the material, being usually determined through tests. Table 2 highlights the heat release rate, measured in several situations [5]. Table 2 Heat release rate for some materials and situations Fuel A burning cigarette A typical light bulb A burning candle
80 W 100 W
A human being at normal exertion A burning wastepaper basket
100 kW
A burning 1 m2 pool of gasoline
2.5 MW
Burning wood pallets, stacked to a height of 3 m Burning polystyrene jars, in 2 m2 cartons 4.9 m high Output from a typical reactor at an NPP
Fig. 6 Flame propagation outside the trade stand
Heat release rate (HRR) 5W 60 W
7 MW 30-40 MW 3.250-3.411 MW
In case of a simulated fire, following the computerized analysis at the level of one arbitrary compartment considered and supposed to hold the ignition source, the heat release rate graph of values has been obtained (Fig. 7). Comparing the resulted value of almost 5 MW, of the heat release rate from a burnt compartment comprising a small volume of combustible materials with the volume of the entire trading stand which has a 7 MW value (as stated
Management Systems in Production Engineering 3(19)/2015
145
C. LUPU, N.I. VLASIN, C. TOMESCU, V. M. PĂSCULESCU, M. C. ŞUVAR - Computational simulation of fire development inside...
in Table 2), measured when burning a stack of wooden pallets with a height of 3 meters [5], the computational analysis can be considered to be very close to the real burning.
Fire development in the wholesale warehouse The computational analysis of the fire at this scale (90x84x7 m) has required the discretisation of the entire geometry (Fig. 8) into a number of 3.628.800 cells, meshing which has also been split into 6 sub-meshes in order to take advantage of the benefices brought by parallel processing.
Fig. 8 Geometry of the wholesale warehouse
Fig. 7 Heat release rate
The result of the analysis is completed with a series of parameters updated during the simulation, the maximum estimative values and the graphic representations of the most significant ones being: heat flux – MAX and Heat flux – MEAN, 96 kW/m2
22 kW/m2
radiative heat flux – MAX and Radiative heat flux – MEAN, 89 kW/m2
17.5 kW/m2
convective heat flux – MAX and Convective heat flux – MEAN 19 kW/m2
3.8 kW/m2
Fig. 9 Processing time
Processing a calculation cycle involving the entire geometry of the trading platform is extended to 38:44 hours for a simulation period of 600 seconds, which delays a lot the achievement of results close to the real ones and limits the time period for the simulation to be carried out (Fig. 9). The distance between two rows of compartments (width of the access pathways) is 2.8 m. However, Fig. 10a highlights the radiative hear transport over this distance and the increase in temperature of the trade stand located across the source stand, leading to its’ ignition (Fig. 10b). a)
conductivity – MAX and Conductivity – MEAN, 22 kW/m2
2.9 kW/m2
b)
optical density – MAX and Optical density – MEAN. 1.95 kW/m2
1.5 kW/m2 Fig. 10 Radiative heat transport: a) radiative transport between two trade stands b) Ignition of the stand located at 2.8m from the fire-place
146
Management Systems in Production Engineering 2(18)/2015 C. LUPU, N.I. VLASIN, C. TOMESCU, V. M. PĂSCULESCU, M. C. ŞUVAR - Computational simulation of fire development inside...
Hot gases from the burning area ensure the convective transport of heat and its’ distance transmission, leading to the ignition of the ceilings of some compartments that are located far from the burning perimeter (Fig. 11a). From here, the rapid expansion of the fire is inherent (Fig. 11b). a)
b)
Fig. 11 Ignition of combustible materials located far from the fire-place: a) onvective heat transport, b) expansion of the burning
The heat release rate by the burning of three rows of stands is presented in Fig. 12, hence the estimated value of 330 MW. Other estimated values are shown in Table 3. Fig. 11 Ignition of combustible materials located far from the fire-place: a) onvective heat transport, b) expansion of the burning
Fig. 12 Heat release rate Table 3 Estimated values of temperature transport Parameter
Value
Radiative Loss
2,25x10⁵
Measurement unit
kW
Conductive Loss
2,8x10⁵
kW
Convective Loss
-3750
kW
Constantin Lupu, Nicolae Ioan Vlasin, Cristian Tomescu, Vlad Mihai Păsculescu, Marius Cornel Şuvar National institute for research and development in mine safety and protection to explosion – INSEMEX Petrosani 32-34 G-ral. Vasile Milea Stret, Petrosani, Hunedoara county – ROMANIA e-mail:
[email protected]
CONCLUSIONS Mathematical modelling of potential high-risk events allows the estimation at a reasonable cost of the risks that may be subject to personnel, buildings and environment. Although it requires a large volume of information for the input data, multiple tests with considerable processing times even for a simple simulation, the prediction of such events may be a barrier between “to happen” or “not to happen”. Estimations through mathematical modelling thereby become an amazing resource in the in the occupational health and safety field, environmental protection, design, regardless of the industry branch. However, due to limitations imposed by the processing power, it is almost impossible to simulate the entire history of a long lasting event, using time and space settings close to real ones, and a sufficiently fine resolution of the meshing in order to obtain accurate results. Yet, a simulation performed over a time period of tens to hundreds of seconds may result in real advantages with immediate applicability. REFERENCES [1] Fiber Properties comparison, Fiber and Fabric Properties. „IngeoTM fiber technical information,” Technical Bulletin 180904. NatureWorks LLC, Mar. 2003. [Online]. Available: http://www.ingeofibers.com [Apr. 15, 2015]. [2] G. Hadjisophocleous and Q. Jia. „Comparison of FDS Prediction of Smoke Movement in a 10-Storey Building with Experimental Data,” vol. 45. Boston: Springer US, 2009. [3] M. Heinisuo, M. Laasonen, and J. Outinen. „Fire design in Europe,” in M. Mazzolani Ed. Urban Habitat Constructions Under Catastrophic Events: COST C26 Action Final Report. New York: CRC Press LLC, 2010, pp. 375-402. [4] C. J. Hilado. Flammability Handbook for Plastics. New York: CRC Press LLC, 1998. [5] B. Karlsson and J. Q. Quintiere. Enclosure Fire Dynamics. New York: CRC Press LLC, 1999. [6] F. Kreith. The CRC handbook of thermal engineering. Boca Raton: CRC Press LLC, 2000. [7] K. B. McGrattan, H. R. Baum and A. Hamins. „Thermal Radiation from Large Pool Fires,” NISTIR 6546. Gaithersburg, MD, USA: National Institute of Standards and Technology, 2000.