IOP PUBLISHING
NANOTECHNOLOGY
Nanotechnology 19 (2008) 325305 (4pp)
doi:10.1088/0957-4484/19/32/325305
Manipulating feature sizes in Si-based grating structures by thermal oxidation Xin Chen1, Ran Ji2 , Ning Dai1 , Roland Scholz2 , Martin Steinhart2, Kornelius Nielsch2 and Ulrich G¨osele2 1 National Key Lab of Infrared Physics, Shanghai Institute of Technical Physics, Chinese Academy of Sciences, Shanghai 200083, People’s Republic of China 2 Max Planck Institute of Microstructure Physics, Weinberg 2, D-06120 Halle/Saale, Germany
E-mail:
[email protected]
Received 27 March 2008, in final form 6 June 2008 Published 2 July 2008 Online at stacks.iop.org/Nano/19/325305 Abstract We report a method for manipulating feature sizes in Si-based grating structures by thermal oxidation, which allows the realization of fin width/period ratios not directly accessible by laser interference lithography. Taking advantage of the expansion in volume associated with the thermal oxidation of Si, grating structures with very high fin width/period ratios of the order of 0.96 were obtained, whereas subsequent chemical etching of the oxide yields grating structures with fin width/period ratios as small as ∼0.06.
by wide grooves, may find their applications in the lab-ona-chip technology or they may serve as biomedical sensor arrays with enhanced surface area for the detection of proteins and DNA. Upon thermal oxidation of Si, the volume per Si atom increases by 125% [6]. Therefore, oxidation and subsequent selective etching of the oxide thus formed with aqueous HF solution allow reducing the dimensions of Si micro- and nanostructures [7]. However, previous works have mainly focused on the fabrication of Si nanowires or Si nanodots. Much less attention has been paid to the systematic oxidative expansion of Si nanostructures to reduce the spacing between them. Here we report the systematic exploitation of thermal oxidation to extend the range of realizable feature sizes in grating structures generated by LIL on Si wafers (figure 1). We show that grooves as narrow as 30 nm in grating structures with P = 265 nm on silicon wafers are accessible via the oxidative expansion of Si nanofins. Moreover, the removal of the oxide yields arrays of parallel nanofins with WF values even in the sub-10 nm range.
1. Introduction The mass fabrication of integrated circuits, electronic and optical devices on silicon (Si) and silica substrates has been developed for decades [1]. Si wafers decorated with nanoscaled patterns are potential components for nanoelectromechanical systems (NEMS), as well as for nanofluidic, nanoelectronic and nano-optical devices [2]. Electron beam lithography (EBL) [3] and scanning probe lithography (SPL) [4] have been used to pattern a variety of substrates. Even though serial methods such as EBL and SPL enable the generation of features with a resolution in the nm range, they are costly and time-consuming. Laser interference lithography (LIL) is a parallel high-throughput technique which allows defining patterns on the wafer scale [5]. For instance, large-area arrays of parallel fins with a width WF and a height H , separated by grooves with a width WG , can be fabricated. Their period P is defined as the centre-tocentre distance between two adjacent grooves or two adjacent fins, respectively. However, the nature of optical interference imposes limitations on the attainable ratio DC (duty-cycle) = WF /P (i.e. WG /P = 1 − DC) that typically lies between 0.3 and 0.7. It is nevertheless desirable to fabricate patterns with DC values beyond the range accessible by LIL. We anticipate that arrays of narrow channels in grating structures with DC values close to 1 are an interesting material platform for size-selective preconcentration and sensing of biomolecules. Grating structures with small DC values, i.e. thin fins separated 0957-4484/08/325305+04$30.00
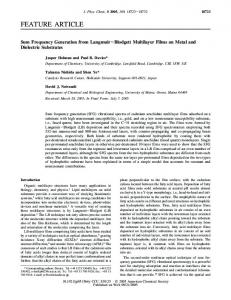
2. Experimental details We spin-coated a 70 nm thick antireflection layer (WiDE8B, i-fin wet-developable ARC, Brewer Science, USA) and a 180 nm thick photoresist layer (TSMR-iNO27, OHKA, Japan) onto (110) oriented Si wafers covered by a 25 nm thick silica layer (figure 1(a)) and generated line patterns with HeCd lasers 1
© 2008 IOP Publishing Ltd Printed in the UK
Nanotechnology 19 (2008) 325305
X Chen et al
Figure 1. Schematic diagram of the fabrication of grating structures on (110) oriented Si wafers with DC values beyond the limits set by conventional LIL.
(λ = 325 nm) [8–11]. We removed residual photoresist from the developed areas by a short application of O2 plasma for 30 s (‘descum’ process; 100 W; 30 sccm; 10 mbar) using a SI220 reactive ion etching (RIE) machine (Sentech, Germany). The SiO2 layer was then removed from the developed areas by a second RIE step with CHF3 gas plasma (100 W, 20 sccm and 10 mbar, duration 3 min) so that the underlying Si was uncovered (figure 1(b)). The grooves were etched with a KOH solution (weight ratio KOH:H2 O:isopropanol = 2:2:1) at room temperature. The (110) faces of Si exhibit the highest etching rate [12] so that aligned grooves with nearly rectangular cross sections were obtained. Their position was defined by the developed areas where the Si was directly exposed to the base. In the areas still covered by SiO2 , underetching was prevented by the high etch contrast between the different crystal faces of Si so that nanofins were conserved between adjacent grooves. Subsequently, the remaining silica on top of the Si nanofins was removed by etching with a 5 wt% aqueous HF solution at room temperature (figure 1(c)). Thermal oxidation of the wafers at temperatures ranging from 900 ◦ C up to 1050 ◦ C in air led to the growth of fresh silica layers on the Si nanofins, and consequently WG significantly dropped (figure 1(d)). A subsequent etching step with aqueous HF solution yielded Si nanofins with reduced WF values, and successively carrying out several oxidation/etching cycles may result in the formation of Si nanofins with WF values even in the sub-10 nm range (figure 1(e)). We characterized the patterned Si wafers by scanning electron microscopy (SEM) and transmission electron microscopy (TEM). Cross-sectional specimens for TEM were prepared by embedding the samples in epoxy resin and slicing them with a diamond wire saw into approximately 400 μm thick sections. The sections were
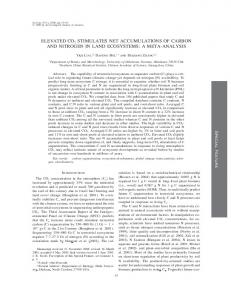
Figure 2. SEM images of grating structures on (110) Si wafers with a period of 265 nm. (a) Native grating structure after LIL and wet etching ( WF = 120 nm; DC = 0.45 and H ≈ 810 nm); ((b)–(e)) grating structures after thermal oxidation at 950 ◦ C in air for (b) 45 min ( WF = 145 nm; DC = 0.55), (c) 90 min ( WF = 165 nm; DC = 0.62), (d) 180 min ( WF = 185 nm; DC = 0.70) and (e) 300 min ( WF = 245 nm; DC = 0.92).
ground and polished to a thickness of approximately 80 μm, upturned, dimple-ground and further polished to a thickness less than 15 μm. The samples were then thinned to electron transparency by ion milling from both sides with Ar (PIPS, Gatan). SEM images were taken with JEOL JSM 6300 and 6340 machines operated at accelerating voltages of 5 kV. TEM investigations were carried out with JEOL 1010 and CM 20T machines operated at 100 and 200 kV, respectively. The WG , WF and P values were determined from SEM and TEM images. Because the oxidation of Si at curved interfaces is retarded [13], the remaining Si cores in the fins were slightly biconcave (cf figure 4(a)). For the sake of comparability, we determined DC from the widest section of the fins.
3. Results and discussion The significant narrowing of the grooves caused by volume expansion upon thermal oxidation is obvious from the SEM 2
Nanotechnology 19 (2008) 325305
X Chen et al
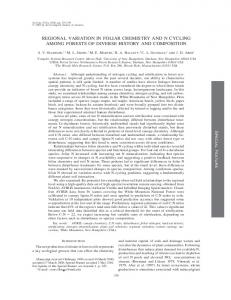
Figure 3. DC as a function of the oxidation time, as determined from the SEM images shown in figure 2.
images seen in figure 2. Initially, the width of the developed areas amounted to 135 nm and that of the non-developed areas in between to 130 nm ( P = 265 nm). Pattern transfer by RIE and wet etching yielded nanofins with WF = 120 nm and H = 810 nm, separated by nanogrooves with WG = 145 nm, corresponding to a DC value of 0.45 (figure 2(a)). Oxidization at 950 ◦ C for 45 and 90 min reduced WG to 120 nm (figure 2(b)) and 100 nm (figure 2(c)), respectively. WG amounted to 80 nm (figure 2(d)) and to 25 nm (figure 2(e)) after oxidation times of 180 min and 300 min, respectively. In turn, WF increased from initially 120 nm prior to the oxidation (figure 2(a)) to 240 nm (figure 2(e)). Thus, the DC value increased from 0.45 (figure 2(a)) to 0.91 (figure 2(e)). Figure 3 displays the relationship between DC and the oxidation time, as determined from figure 2. It should be noted that narrow nanogrooves in grating structures with high DC values close to 1 can be converted to nanochannels by over-oxidation [14], bonding or deposition steps [15]. Figure 4 shows typical cross-sectional TEM images of the oxidized grating structures. The interface between the Si core and the outer silica layer is clearly discernible (figure 4(a)). The Si core with a diameter of ∼90 nm is connected with the underlying Si wafer and covered by a silica layer with a thickness of ∼40–55 nm. The thickness of the silica layer is not uniform because oxidation of Si at curved interfaces is retarded [13, 14]. The silicon nanofins can be converted into silica by extended oxidation times or by oxidation at higher process temperatures. No silicon cores were found in silica nanofins obtained by successive oxidation steps at 950 ◦ C for 100 min and at 1000 ◦ C for 120 min (figures 4(b) and (c)). The WG values of the narrowest parts of the grooves decreased from ∼90 nm (figure 4(a)) to ∼10 nm (figures 4(b) and (c)) whereas DC increased from ∼0.67 to ∼0.96. Grating structures with a very low DC value can be fabricated using grating structures with a high P value as a starting material and one or several successive processing cycles involving thermal oxidation and subsequent removal of the silica formed with aqueous HF solution. For example,
Figure 4. TEM cross-sectional images after thermal oxidation of the silicon nanofins seen in figure 2(a) at (a) 950 ◦ C for 90 min, (b) and (c) 950 ◦ C in air for 100 min followed by another thermal oxidation at 1000 ◦ C in air for 120 min; (b) overview; (c) detail.
subjecting native grating structures with WF = 640 nm, P = 1.4 μm and DC = ∼0.46 (figure 5(a)) to several successive processing cycles involving thermal oxidation and wet etching with HF solution yielded modified grating structures with nanofins as narrow as 80 nm separated by silicon grooves with WG ≈ 1.32 μm (figures 5(b) and (c)). Thus, DC could be reduced to a value as small as ∼0.06. Figure 5(d) shows another grating structure with P ≈ 340 nm, WF ≈ 30 nm and DC ≈ 0.09 obtained from a native grating structure with an initial WF value of 140 nm, an initial P value of about 340 nm and an initial H value of about 1.2 μm, which was processed in the same way as the sample seen in figure 1, followed by three successive processing cycles involving thermal oxidation at 900 ◦ C in air for 120 min and wet etching with 5 wt% HF solution for 5 min. Future work will aim at the investigation of the mechanical properties of narrow Si nanofins that may significantly deviate from those of bulk Si. 3
Nanotechnology 19 (2008) 325305
X Chen et al
Foundation (Az. I/80 780). Additional support by the Shanghai Pujiang Talent Plan (no. 07PJ14095) and the NSFC (no. 20704042) is gratefully acknowledged. The authors thank S Hopfe for technical support.
References [1] Park D and Ryu B 2006 ECS Trans. 2 11 [2] Lee S S, Lin L Y and Wu M C 1995 Appl. Phys. Lett. 67 2135 Thorsen T, Maerkl S J and Quake S R 2002 Science 298 580 Craighead H G 2000 Science 290 1532 Newell W E 1968 Science 161 1320 [3] Craighead H G 1984 J. Appl. Phys. 55 4430 Craighead H G, Howard R E, Jackel L D and Mankiewich P M 1983 Appl. Phys. Lett. 42 38 [4] Demers L D and Mirkin C A 2001 Angew. Chem. Int. Edn 40 3069 Hong S, Zhu J and Mirkin C A 1999 Science 286 523 Piner R D, Zhu J, Xu F, Hong S H and Mirkin C A 1999 Science 283 661 [5] Anderson H, Smith H I and Schattenburg M L 1983 Appl. Phys. Lett. 43 874 [6] Marcus R B and Sheng T T 1982 J. Electrochem. Soc. 129 1278 Kao D B, McVittie J P, Nix W D and Saraswat K C 1987 IEEE Trans. Electron. Devices 34 1008 Kao D B, Mcvittie J P, Nix W D and Saraswat K C 1988 IEEE Trans. Electron. Devices 35 25 [7] Marcus R B, Ravi T S, Gmitter T, Chin K, Liu D, Orvis W J, Ciarlo D R, Hunt C E and Trujillo J 1990 Appl. Phys. Lett. 56 236 Liu H I, Biegelsen D K, Ponce F A, Johnson N M and Pease R F W 1994 Appl. Phys. Lett. 64 1383 Shi Y, Liu J L, Wang F, Zhang R, Gu S L, Han P, Hu L Q and Zheng Y D 1996 J. Vac. Sci. Technol. A 14 1194 Kedzierski J, Bokor J and Anderson E 1999 J. Vac. Sci. Technol. B 17 3244 Ravi T S, Marcus R B and Liu D 1991 J. Vac. Sci. Technol. B 9 2733 Kim G M, Kovalgin A, Holleman J and Brugger J 2002 J. Nanosci. Nanotechnol. 2 55 Yin Y, Gates B and Xia Y 2000 Adv. Mater. 12 1426 [8] Spallas J P, Hawryluk A M and Kania D R 1995 J. Vac. Sci. Technol. B 13 1973 [9] Savas T A, Schatenburg M L, Carter J M and Smith H I 1996 J. Vac. Sci. Technol. B 14 4167 [10] Petter K, Kipp T, Heyn Ch, Heitmann D and Sch¨uller C 2002 Appl. Phys. Lett. 81 592 [11] O’Brien M J, Bisong P, Ista L K, Rabinovich E M, Garcia A L, Sibbett S S, Lopez G P and Brueck S R J 2003 J. Vac. Sci. Technol. B 21 2941 [12] Kendall D L 1975 Appl. Phys. Lett. 26 195 Kendall D L 1990 J. Vac. Sci. Technol. A 8 3598 [13] Uematsu M, Kageshima H, Shiraishi K, Nagase M, Horiguchi S and Takahashi Y 2004 Solid-State Electron. 48 1073 Nagase M, Fujiwara A, Takahashi Y, Murase K and Kurihara K 1998 Microelectron. Eng. 41/42 527 [14] Chen X, Ji R, Steinhart M, Milenin A, Nielsch K and G¨osele U 2007 Chem. Mater. 19 3 [15] Chou H, Spence C, Scherer A and Quake S 1999 Proc. Natl Acad. Sci. USA 96 11 Mao P and Han J 2005 Lab Chip 5 837 Cao H, Yu Z, Wang J, Tegenfeldt J O, Austin R H, Chen E, Wu W and Chou S Y 2002 Appl. Phys. Lett. 81 174
Figure 5. SEM images of grating structures with exceptionally small DC values. (a) Native grating structure ( WF = 640 nm; P = 1.4 μm; H ≈ 1.5 μm); (b) grating structure seen in (a) after four successive processing cycles involving thermal oxidation at 950 ◦ C in air for 120 min followed by chemical etching in 5 wt% HF solution. (c) Silicon fins seen in (b) after three more processing cycles including thermal oxidation at 900 ◦ C for 60 min in air and chemical etching in 5 wt% HF solution. (d) Grating structure with DC = 0.09 obtained from a parent structure with WF = 140 nm and P ≈ 340 nm after three successive processing cycles involving thermal oxidation at 900 ◦ C in air for 120 min and wet etching with 5 wt% HF solution for 5 min.
4. Summary In summary, a method for manipulating feature sizes in Sibased grating structures by thermal oxidation was reported, which allows the realization of fin width/period ratios values far beyond the range directly accessible by LIL. Taking advantage of the expansion in volume associated with the thermal oxidation of Si, grating structures with outstandingly high fin width/period ratios of the order of 0.96 were obtained. Selective etching of the silica thus formed yields arrays of narrow nanofins consisting of the residual Si cores. Hence, fin width/period ratios as small as ∼0.06 can be realized by this approach.
Acknowledgments This work was funded by the German Ministry of Education and Research (no. FKZ03N8701) and the Volkswagen 4