FOCUS ON MAPPING THE BRAIN review
Mapping brain circuitry with a light microscope
npg
© 2013 Nature America, Inc. All rights reserved.
Pavel Osten1 & Troy W Margrie2,3
The beginning of the 21st century has seen a renaissance in light microscopy and anatomical tract tracing that together are rapidly advancing our understanding of the form and function of neuronal circuits. The introduction of instruments for automated imaging of whole mouse brains, new cell type–specific and trans-synaptic tracers, and computational methods for handling the whole-brain data sets has opened the door to neuroanatomical studies at an unprecedented scale. We present an overview of the present state and future opportunities in charting long-range and local connectivity in the entire mouse brain and in linking brain circuits to function. Since the pioneering work of Camillo Golgi and Santiago Ramón y Cajal at the turn of the last century1,2, advances in light microscopy (LM) and neurotracing methods have been central to the progress in our understanding of anatomical organization in the mammalian brain. The Golgi silver-impregnation method allowed the visualization of neuron morpho logy, providing the first evidence for cell type–based and connectivity-based organization in the brain. The introduction of efficient neuroanatomical tracers in the second half of the last century greatly increased the throughput and versatility of neuronal projection mapping, which led to the identification of many anatomical pathways and circuits, and revealed the basic principles of hierarchical and laminar connectivity in sensory, motor and other brain systems3,4. The beginning of this century has seen a methodsdriven renaissance in neuroanatomy, one that is distinguished by a focus on large-scale projects that yield unprecedented amounts of anatomical data. Instead of the traditional ‘cottage-industry’ approach to studying one anatomical pathway at a time, the new projects aim to generate complete data sets—so-called projectomes and connectomes—that can be used by the scientific community as resources for answering specific experimental questions. These efforts range in scale and resolution from the macroscopic to the microscopic: from studies of the human brain by magnetic resonance imaging to reconstructions of dense neural circuits in
small volumes of brain tissue by electron microscopy (see Review5 and Perspective6 in this Focus). Advancements in LM methods, the focus of this Review, are being applied to the mapping of point-topoint connectivity between all anatomical regions in the mouse brain by means of sparse reconstructions of anterograde and retrograde tracers7. Taking advantage of the automation of LM instruments, powerful dataprocessing pipelines, and combinations of traditional and modern viral vector-based tracers, teams of scientists at Cold Spring Harbor Laboratory (CSHL), Allen Institute for Brain Science (AIBS) and University of California Los Angeles (UCLA) are racing to complete a connectivity map of the mouse brain—dubbed the ‘mesoscopic connectome’—which will provide the scientific community with online atlases for viewing entire anatomical data sets7. These efforts demonstrate the transformative nature of today’s LM-based neuroanatomy studies and the astonishing speed with which large amounts of data can be disseminated online, and have an immediate impact on research in neuroscience laboratories around the world. As the mouse mesoscopic connectomes are being completed, it is clear that LM methods will continue to impact the evolution of biological research and specifically neuroscience: new trans-synaptic viral tracers are being engineered to circumvent the need to resolve synapses, which has constrained the interpretation of cell-to-cell connectivity in LM studies, and new assays
1Cold Spring Harbor Laboratory, Cold Spring Harbor, New York, USA. 2Department of Neuroscience, Physiology and Pharmacology, University College London, London, UK. 3Division of Neurophysiology, The Medical Research Council National Institute for Medical Research, London, UK. Correspondence should be addressed to P.O. (
[email protected]) or T.W.M. (
[email protected]).
Received 2 march; accepted 15 April; published online 30 may 2013; doi:10.1038/nmeth.2477
nature methods | VOL.10 NO.6 | JUNE 2013 | 515
review b
Ti:sapphire
PMT
c
PMT
PMT
Camera
Piezo element
Microtome y
Camera
515-nm laser
Detection objective
Illumination objective
Knife
Light sheet
y x
y
x x
z z
npg
© 2013 Nature America, Inc. All rights reserved.
Motorized x-y-z stage
Motorized x-y-z stage
Motorized x-y-z stage
z
J. Kuhl
a
FOCUS ON MAPPING THE BRAIN
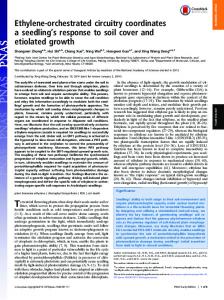
Figure 1 | Whole-brain LM methods. (a) In STP tomography, a two-photon microscope is used to image the mouse brain in a coronal plane in a mosaic grid pattern, and a microtome sections off the imaged tissue. Piezo objective scanner can be used for z-stack imaging (image adapted from ref. 15). (b) In fMOST, confocal line-scan is used to image the brain as 1-micrometer thin section cut by a diamond knife (image adapted from ref. 16). (c) In LSFM, the cleared brain is illuminated from the side with a light sheet (blue) through an illumination objective (or cylinder lens 19) and imaged in a mosaic grid pattern from the top (image adapted from ref. 20). In all instruments, the brain is moved under the objective on a motorized x-y-z stage; PMT, photomultiplier tube.
combining anatomical and functional measurements are being applied to bridge the traditional structure-function divide in the study of the mammalian brain. In this Review, we aim to provide an overview of today’s state of the art in LM instrumentation and to highlight the opportunities for progress as well as the challenges that need to be overcome to transform neuronal-tracing studies into a truly quantitative science that yields comprehensive descriptions of long-range and local projections and connectivity in whole mouse brains. We also discuss present strategies for the integration of anatomy and function in the study of mouse brain circuits. Automated light microscopes for whole-brain imaging The field of neuroanatomy has traditionally been associated with labor-intensive procedures that greatly limit the throughput of data collection. Recent efforts to automate LM instrumentation have standardized and dramatically increased the throughput of anatomical studies. The main challenge for these methods is to maintain the rigorous quality of traditional neuroanatomical studies, which results from detailed visual analysis, careful data collection and expert data interpretation. There are currently two approaches to the automation of LM for imaging three-dimensional (3D) whole-brain data sets: one based on the integration of block-face microscopy and tissue sectioning and the other based on light-sheet fluorescence micros copy (LSFM) of chemically cleared tissue. The first approach has been developed for wide-field imaging, line-scan imaging, confocal microscopy and two-photon microscopy8–16. Common to all these instruments is the motorized movement of the sample under the microscope objective for top-view mosaic imaging, followed by mechanical removal of the imaged tissue before the next cycle of interleaved imaging and sectioning steps (Fig. 1a,b). As the objective is always near the tissue surface, it is possible to use high-numerical-aperture lenses to achieve submicrometer resolution close to the diffraction limits of LM. 516 | VOL.10 NO.6 | JUNE 2013 | nature methods
Three instruments have been designed that combine twophoton microscopy17 with subsequent tissue sectioning by ultrashort laser pulses in all-optical histology10, by a milling machine in two-photon tissue cytometry12 or by a vibrating blade microtome in serial two-photon (STP) tomography15 (Fig. 1a). Whereas in both all-optical histology and two-photon tissue cytometry the sectioning obliterates the imaged tissue, the integration of vibratome-based sectioning in STP tomography allows the collection of the cut tissue for subsequent analysis by, for example, immunohistochemistry (see below). In addition, the tissue preparation by simple formaldehyde fixation and agar embedding in STP tomography has minimal detrimental effects on fluorescence and brain morphology. This makes STP tomography applicable to a broad range of neuroanatomical projects that use genetically encoded fluorescent protein–based tracers, which are sensitive to conditions used for fixation, dehydration and tissue clearing. This method is also versatile in terms of the mode and resolution of data collection. For example, imaging the mouse brain as a data set of 280 serial coronal sections, evenly spaced at 50 micrometers and at x-y resolution of 1 micrometer, takes about ~21 hours and generates a brain atlas–like data set of ~70 gigabytes. A complete visualization can be achieved by switching to 3D scanning of z-volume stacks between the mechanical sectioning steps, which allows the entire mouse brain to be imaged, for instance, at 1-micrometer x-y resolution and 2.5-micrometer z resolution in ~8 days, generating ~1.5 terabytes of data15. The instrument is commercially available from TissueVision Inc. The Allen Brain Institute is using this methodology for its Mouse Connectivity project (see below). Two instruments have been designed to combine bright-field linescan imaging and ultramicrotome sectioning of resin-embedded tissue in methods named knife-edge scanning microscopy (known as KESM)13 and micro-optical sectioning tomography (MOST)14 (Fig. 1b). The latter was used to image Golgi-stained mouse brain
npg
© 2013 Nature America, Inc. All rights reserved.
FOCUS ON MAPPING THE BRAIN review at 0.33 × 0.33 × 1.0 micrometer x-y-z resolution, generating >8 terabytes of data in ~10 days13,14. The MOST instrument design was also recently built for fluorescence imaging (fMOST) by confocal laser scanning microscopy, with the throughput of one mouse brain at 1.0-micrometer voxel resolution in ~19 days16. Knife-edge scanning microscopy imaging is now also available as a commercial service from 3Scan. The second approach for automated whole-brain imaging is based on LSFM (also known as selective-plane illumination microscopy18 and ultramicroscopy19; Fig. 1c). This approach allows fast imaging of chemically cleared ‘transparent’ mouse brains without the need for mechanical sectioning19,20 but, at least until now, with some trade-offs for anatomical tracing applications. The chemical clearing procedures reduced the signal of fluorescent proteins, but this problem appears to be solved by a new hydrogel-based tissue transformation and clearing method termed CLARITY21 (see Perspective about this methodology in this Focus22). The spatial resolution of LSFM for the mouse brain also has been limited by the requirement for large field-of-view objectives with low power and low numerical aperture that were used to visualize the whole brain19,23. However, new objectives with long working distance and high numerical aperture, such as 8-millimeter working distance and 0.9 numerical aperture objective from Olympus, promise to enable LSFM of the whole mouse brain at submicrometer resolution. If necessary, LSFM can also be combined with one of several forms of structured illumination to reduce out-of-focus background fluorescence and improve contrast24–26. Taken together, these modifications are likely to enhance the applicability of LSFM to anterograde tracing of thin axons at high resolution in the whole mouse brain, as done by STP tomography in the AIBS Mouse Connectivity project (see below) and by fMOST in a recent report16. In addition, LSFM is well-suited for retrograde tracing in the mouse brain, which relies on detection of retrogradely fluorescence-labeled neuronal soma that are typically >10 micrometers in diameter. Such application was recently demonstrated for mapping retrograde connectivity of granule cells of the mouse olfactory bulb20 using rabies viruses that achieve high levels of fluorescent protein labeling27,28. Mesoscopic connectivity-mapping projects The labeling of neurons and subsequent neuroanatomical tract tracing by LM methods has been used for over a century to interrogate the anatomical substrate of the transmission of information in the brain. Throughout those years, the credo of neuroanatomy, ‘the gain in brain is mainly in the stain’, signified that progress was made mainly through the development of new anatomical tracers. Yet despite the decades of neuroanatomical research, the laborious nature of tissue-processing and datavisualization has kept the progress in our knowledge of brain circuitry at a disappointingly slow pace7. Today, neuroanatomy stands to greatly benefit from the application of high-throughput automated LM instruments and powerful informatics tools for the analysis of mouse brain data29,30. The high-resolution capacity LM methods afford, and the fact that an entire brain data set can be captured, makes these systems well-suited for the systematic charting of the spatial profile and the connectivity of populations of neurons and even individual cells projecting over long distances.
The pioneering effort in the field of anatomical projects applied at the scale of whole animal brains was the Allen Mouse Brain Atlas of Gene Expression, which cataloged in situ hybridization maps for more than 20,000 genes in an online 3D digital mouse brain atlas29,31,32. The proposal by a consortium of scientists led by Partha Mitra to generate similar LM-based atlases of ‘brainwide neuroanatomical connectivity’ in several animal models7 has in short time spurred three independent projects, each promising to trace all efferent and afferent anatomical pathways in the mouse brain. The aim of the Mouse Brain Architecture Project (http://brainarchitecture.org/) from the Mitra team at CSHL is to image >1,000 brains; the Allen Mouse Brain Connectivity Atlas project (http://connectivity.brain-map.org/) led by Hongkui Zeng at AIBS has a goal of imaging >2,000 brains; and the Mouse Connectome Project (http://www.mouseconnectome.org/) led by Hong-Wei Dong at UCLA has a goal of imaging 500 brains, with each brain injected with four tracers. Whereas the CSHL and UCLA projects rely on automated wide-field fluorescence microscopy (Hamamatsu Nanozoomer 2.0 and Olympus VS110, respectively) to image manually sectioned brains, the Mouse Connectivity project at the Allen Institute is being done entirely by STP tomography15. The main strength of these efforts is in the broad range of tracers used. Given that each tracer has its own advantages and problems33, the information derived from all three projects will ensure generalizable interpretation of the projection results throughout the brain. The CSHL group uses a combination of traditional anterograde and retrograde tracers, fluorophoreconjugated dextran amine34 and cholera toxin B (CTB) subunit35, respectively, which are complemented by a combination of viral vector–based tracers, GFP-expressing adeno-associated virus (AAV)36 for anterograde tracing (Fig. 2a) and modified rabies virus27 for retrograde tracing. Although the virus-based methods are less well tested, they offer advantages in terms of the brightness of labeling and the possibility of cell type–specific targeting using Cre recombinase–dependent viral vectors37 and transgenic lines expressing Cre recombinase from cell type–specific promoters38–40. The AIBS team uses solely anterograde tracing by AAV-GFP viruses that label axonal arborizations with GFP 41 (Fig. 2b), in many cases taking advantage of transgenic ‘driver’ mouse lines expressing Cre recombinase from cell type–specific promoters to achieve anterograde tracing of specific neuronal cell types. Finally, the team at UCLA is using a strategy of two injections per brain, each with a mix of anterograde and retrograde tracers42: CTB together with Phaseolus vulgaris leucoagglutinin43 and FluoroGold44 together with biotinylated dextran amine42,45. This approach has an added advantage of enabling direct visualization of the convergence of inputs and outputs from across different areas in one brain42,46,47. The unprecedented amounts of data being collected in these projects means that the considerable person-hours historically spent performing microscopy have largely shifted toward data analysis. The first step of such data analysis comprises the compilation of the serial section images for viewing as whole-brain data sets at resolutions beyond the minimum geometric volume of the neuronal structures of interest: soma for retrograde tracing and axons for anterograde tracing. All three projects offer a convenient way to browse the data sets online, including high-resolution magnified views that in most cases are sufficient to visually determine labeled soma and axons. All three projects use the Allen nature methods | VOL.10 NO.6 | JUNE 2013 | 517
review a
npg
© 2013 Nature America, Inc. All rights reserved.
b
Figure 2 | Primary motor cortex projection maps. (a) Mouse Brain Architecture data of AAV-GFP injected into the supragranular layers and AAV–red fluorescent protein injected in the infragranular layers (F. Mechler and P. Mitra; unpublished data). Front (left) and lateral (right) views of the volume-rendered brain (top); and coronal section image from the area marked by the dashed line (center) with magnification of the lower boxed region showing axonal fibers in the cerebral peduncle (left) and magnification of the upper boxed region showing projections to the midbrain reticular nucleus (right). Scale bars, 1,000 µm (top) and 20 µm (bottom). (b) Mouse Connectivity data of a similar AAV-GFP injection show the primary motor cortex projectome reconstructed in the Allen Brain Explorer48 (H. Zeng; unpublished data). Inset, magnified view and coronal section overview of projections in the ventral posteromedial (VPM) nucleus of the thalamus.
Mouse Brain Atlas for the registration of the coronal sections, which will help in the cross-validation of results obtained from the different tracers. The Allen Mouse Brain Connectivity Atlas website also offers the option to view the data after projection segmentation, which selectively highlights labeled axons, as well as in 3D in the Brain Explorer registered to the Allen Mouse Brain Atlas48 (Fig. 2b). The second step of data analysis requires the development of informatics methods for quantitation of the data sets, which will facilitate the interpretation of the data available online. The Allen Mouse Brain Connectivity Atlas online tools allow the user to search the projections between injected regions and display the labeled pathways as tracks in three dimensions in the Brain Explorer. The CSHL and UCLA connectomes can currently be viewed online as serial section data sets. The data from the Cre 518 | VOL.10 NO.6 | JUNE 2013 | nature methods
FOCUS ON MAPPING THE BRAIN recombinase driver mouse lines in the AIBS project provide a unique feature of cell-type specificity for the interpretation of the anterograde projections. The main strength of the CSHL and UCLA efforts lies in the multiplicity of the anatomical tracers used. The use of multiple retrograde tracers in particular will yield useful information, as retrogradely labeled soma (>10 micrometers in diameter) are easier to quantify than thin (