International Journal of the Physical Sciences Vol. 5(12), pp. 1890-1896, 4 October, 2010 Available online at http://www.academicjournals.org/IJPS ISSN 1992 - 1950 ©2010 Academic Journals
Full Length Research Paper
Mapping coastal geomorphology changes using synthetic aperture radar data Maged Marghany*, Zurina Sabu and Mazlan Hashim Institute of Geospatial Science and Technology (INSTEG), UniversitiTeknologi Malaysia 81310 UTM, Skudai, JohoreBahru, Malaysia. Accepted 17 September, 2010
This study presents work to utilize multi synthetic aperture radar (SAR) data to map the rate of spit change along the east coast of Kuala Terengganu, Malaysia. Multi temporal SAR data are involved in ERS-1 and RADARSAT -1 SAR data. Two algorithms have implemented to extract the spit‘s boundary from multi-SAR data which are Lee and Enhance Lee algorithms. The two algorithms are applied to multi-SAR data with window kernel sizes of 3 x 3, 5 x 5, and 7 x 7, respectively. The rate of spit change is estimated using the traditional method of historical vectors overlaying technique which were acquired from multi-SAR data by manual digitizing. This study shows that Enhance Lee algorithm with kernel window size of 5x5 provides better speckles reduction. It is interesting too to find that the spit has dominated by accretion since 1993 to 2003 which is 7 months/year. It can be concluded that the multi- SAR data can be used for mapping coastal geomorphology change in tropical area such as Malaysia. Key words: Lee algorithm, Enhance Lee algorithm, synthetic aperture radar, coastal geomorphology, spit. INTRODUCTION Spit is the key parameter to understand the phenomena of coastal hydrodynamic interaction. Therefore, spit is defined as a narrow tongue of sand extending from the shoreline that is usually created by long shore drift and also called sand spit (Evans, 1942). The spit geomorphology features along the east coast of Malaysia, however, is poorly understood. In fact, major coastal studies in Malaysia are restricted to classical marine biological researches. At present, there is no study that have been conducted along the Peninsular Malaysian coastlines to investigate the physical structure of spits’ geomorphology. Most studies have been restricted to utilization of traditional methods for shoreline identification based on beach profile surveying (Lokman et al., 1995). Remote sensing techniques can be major tool for coastal geomorphology studies. The applications of remote sensing in coastal geomorphology change are
*Corresponding author.
[email protected].
E-mail:
[email protected],
conducting by using aerial photograph and satellite images such as Landsat-5 Thematic Mapper Data. These were done by comparing the sequences of the aerial photographs; topography maps and topographic charts for study areas. Other studies of coastal geomorphology were conducted by using photo mosaics and photo index sheets. For example, shoreline changes were interpreted for the mosaics and current conditions of beach erosion that were based on field observations. Recently, researches found out how to use satellite imagery with the aerial photographs to detect coastal geomorphology pattern change (Holman et al., 1993; Ruessink 1994; Frihy e. al., 1998; Blodget, 1991; Zhu, 2001). These studies have used conventional techniques of vector overlays for aerial photograph and satellite imageries. Fighy et al. (1998) for instance, compiled the historical LANDSAT-MSS and TM satellite images with a series of topographic maps to study coastal geomorphology features changes along the Nile Delta Egypt. In this study, the migration of spit over 86-years can track due the dynamic changes of sand along the shoreline. Further, Gowda et al. (1995) used multidate satellite data
Marghany et al.
of SPOT and IRS to study the long term change of coastal geomrophology features such as cliffs/headlands, bays, beaches, sand dunes, spits, offshore islands, bars/shoals and river islands. They found that the multidate satellite data have indicated that the coast has not undergone major seasonal changes except a few modifications in the configuration and location of spits, shoals, bars mouths, etc. However, long term changes have occurred along estuarine mouths, spits, beaches and pocket beaches. Such changes are linked to the variations in the outflow from the rivers, nature, type and composition of landforms and their interaction with coastal processes operating in the study area (Gowda et al., 1995). Recently, Oliveira et al. (2008) used multi satellite data of Landsat –TM, Landsat ETM+ and CBERS-2 CCD data o observe the geomorphologic evolution of the coastal zone of the Restinga of Marambaia, on the South-East coast of Brazil. However, they found that there is a significant difference due to the poor resolution of the MSS data, nominally 79 m, against the 20 m of the CCD data and 30 m of the TM and ETM+ data. In this context, optical sensors such as Landsat-TM and Landsat ETM+ can cause thematic error for coastal geomorphology feature studies. In addition, the low resolution of the Landsat data (30 m) only justifies its use in coastal erosion studies with changes that are larger than this pixel size. As a matter of fact, the resolution of this sensor is unable to capture beach profiles at a width less than the pixel size (< 30 m). Further, moderate resolution data (SPOT) of 10 m and less than 1 m (IKNOS and QUICKBIRD) are sometimes difficult to use under a heavy cloud covers that exist in tropical area (Maged, 2001). Microwave satellite and airborne have advantages over the other types of remote sensing particularly in ocean applications (Singhroy, 1996). In fact, synthetic aperture radar (SAR) can be used to study hydrodynamic of coastal processes. SAR satellite data have been potential to model ocean wave climates and their impacts on sediment transport along the coastline. Coastal water hydrodynamics exchanges between an estuary and ocean may be responsible for sediment distributions, which formation accumulates along the estuary sides to build up spit (Maged, 2001; Maged and Mazlan, 2009; Maged et al., 2009). Maged (2002) implemented Canny algorithm for automatic identification of coastline to monitor coastline rate of change. Yu and Acton (2004) implemented new diffusion-based method for the delineation of coastlines from space-borne polarimetric SAR imagery. They reported that the performance of the proposed algorithm of two polarimetric SAR classification algorithms and two edge-based shoreline detection methods that are tailored to single polarization SAR images, demonstrating a good visual match between the detected coastline and the manually contoured coastline. Further, Wang and Allen (2008) used multi-SAR data of ALOS PALSAR HH and
1891
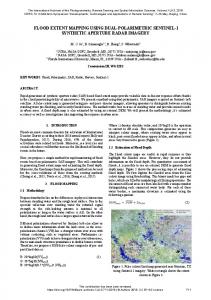
JERS-1 L-HH SAR to monitor the shoreline change along the mouth river. In doing so, they implemented the edge detection algorithm of Canny to identify the border of shoreline. They reported that active microwave data provide a great promising for monitoring coastal geomorphology. Recently Maged and Mazlan (2009) implementted DInSAR for three-dimensional (3-D) spit reconstruction using RADARSAT-1 SAR fine mode data. They reported that the integration between fuzzy B-spline and unwrapped phase inteferogram can produce highly accurate 3D reconstruction of coastal geomorphology features within accuracy rate of ± 0.1 m. Further, Shu et al. (2010) implemented narrow band level set segmentation approach for semi-automatic detection of coastline using RADARSAT-2 SAR fine mode data. The main objective of this study is to utilize multi – SAR satellite data to estimate the rate of spit change. RESEARCH METHODS Study area The study area is located in the South China Sea between 5°21’ N to 5°25’ N. This area has an equatorial region durational by monsoon seasons (Maged and Mazlan, 2009). The Southwest monsoon last from May to September whilst the Northeast monsoon last from October to March. The bathymetry near the area has gentle slopes with 40 m water depth (Figure 1). A clear feature of this area is the primary hydrologic communications between the estuary and the South China Sea. According to Maged et al. (2009) this estuary is the largest estuary one along the Terengganu coastline. The geological structure of Kuala Terengganu River is comprised of alluvium soil, and carbonate rock with decay living organism (Jamaluddin, 1989; Maged, 2001). Data acquisition SAR data are divided into airborne SAR data and space borne SAR which covered location area between 5°20’ N to 5°27’ N and 103°5’ E to 103°9’ E. The space borne SAR data acquired in the study were for the ERS-1 and RADARSAT-1 fine mode. Both data are Cband instrument ERS-1 data is CVV band while RADARSAT-1 SAR fine mode data have width range of incidence angle of 10 to degrees. ERS-1 data have range pixel spacing of 12.5 m which large the RADARSAT-1 SAR fine mode (6 m). Therefore, ground data from the field surveying of spit shoreline are conducted using the theodolite instrument (Figure 1). These data are collected on 14th August and 5th December, 2003 which used to compare with the output of multi temporal SAR data. The linear regression method is used to determine the level of correlation between ancillary data, and multi SAR data, which used to determine the accuracy assessment of this study. Spit change mapping Figure 2 shows the follow chart was used to determine the spit change rates from Multi-SAR data. The methods involved three procedures (i) spit automatic detection using adaptive algorithms such as Lee and enhance Lee algorithms, (ii) determine the rate changes by estimating the historical vector layer displacements; and (iii) find the accuracy assessment by implementing ground
1892
Int. J. Phys. Sci.
Figure 1. Bathymetry along the coastal waters of kuala terengganu.
Figure 2. Flow chart to estimate rate of spit changes.
data. Adaptive speckles algorithms are used to perform despeckle and also to be tested as automatic detection tool for coastal geomorphology feature such as spit. These algorithms are Lee and
Enhance Lee algorithms. Lee algorithm performs spatial filtering on each individual pixel in an image using the grey-level values in a square window surrounding each pixel. The dimensions of the filter must be odd, and can be from 3x3 to 11x11 pixels (Lee, 1981). The
Marghany et al.
Lee algorithm will smooth the image data without removing edges or sharp features in the images (Lee, 1981). In this study, a combination of additive and multiplicative noise (speckle) was used for noise reduction from the multi SAR images. According Lee (1981), the Lee algorithm can be given by following equation.
R = U grey +K (CP- U multiplicative (U filter − U additive ))
(1)
Where
( U multiplicative × µfilter )
K= ( µfilter × U
2 multiplicative
+U
2 filter
× µmultiplicative + µadditive )
µ filter is
σ2 2 µ filte r
(2)
(3)
µ multiplicative represents the µ additive is the additive noise variance,
the variance in filter window.
multiplicative noise variance,
Ufilter is the mean grey level in the filter window, U
( x2 − x1 ) dx = (m / year ) (t2 − t1 ) dt
(4)
x1 and x2 are the selected points on historical vector layers t1 and t2 are selected historical time (year). Erosion will take a
Where and
place with negative value of dy while accretion will take a place with positive value of dy (Maged, 2001).
RESULTS AND DISCUSSION
The multiplicative noise variance is calculated from local statistics in the filter window from a given Equation (2)
µ m u ltip lic a tive =
dy =
1893
multiplicative
is the
mean multiplicative noise U additive is the mean additive noise, CP is the central pixel in filter window and SD is the standard deviation of the noise in the filter window. The value of mean additive noise is usually 0. The value of mean multiplicative noise is usually 1. The application of the algorithm above assumption that the mean value of additive noise is usually 0 and mean value of multiplicative noise is usually 1.0 (Lee, 1981). Different filter sizes will greatly affect the quality of processed images. If the filter is small, the noise-filtering algorithm is not effective. If the filter is large, subtle details of the image will be lost in the filtering process. It is recommended that using 7x7 filter kernel, because it usually gives the best results (Lopes et al., 1993). Then, the Enhance Lee algorithm was applied. In fact, Enhanced Lee algorithm re-sampling option determines the gray level for each pixel by computing the weighted sum of the center pixel value, the mean value, and the variance calculated in a square kernel surrounding the pixel. In order to filter pixels located near the edges of the image, edge pixel values are replicated to produce sufficient data (Lee, 1981). In addition, Enhance Lee algorithm is used primarily to suppress speckle. It smoothes image data without removing edges or sharp features in the images while minimizing the loss of radiometric and textural information. In homogeneous areas, speckles are removed using a low-pass filter. In heterogeneous areas, speckles are reduced while preserving the texture. In areas containing isolated point targets, the filter preserves the observed value. Finally, digitizing technique was used to estimate the rate of spit changes. The data used to estimate rate of spit changes are: (i) topographic map and (ii) multi SAR data. The coastline is identified in multi SAR data and topographic map and then is digitized into vector layers. The multi SAR vectors are created and overlaid with the vectors are acquired from topographic maps. On each data set, the intersection locations are selected and the perpendicular line from the center of the root junction to the shoreline was drawn. Then, the distance from the center of the junctions to the point where the line and coastline intersect was determined. The differences of distance (dx) of two different were measured over the time (dt) to estimated the shoreline change rate (dy) (Maged, 2001).
Figure 3 shows the output results of Lee algorithm with different kernel window sizes which have performed to ERS-1 and RADARSAT-1 SAR data. Clearly RADARSAT-1 SAR data with Lee algorithm of kernel window size of 5x5 provides better detection compared to ERS-1 data and other window sizes of 3x3 and 7x7 applied to same RADARSAT-1 SAR data. This result is supported by lower standard division value of 20.5 for kernel window size of 5x5, which indicates the lowers magnitude noise (Table 1). However, Enhance Lee algorithm provides a better mapping of coastal spit than Lee algorithm (Figure 4). This is obvious with kernel window size of 5x5 which is clear in RADARSAT-1 SAR data as compared to ERS-1 data. In fact, Enhanced Lee algorithm re-sampling option determines the gray level for each pixel by computing the weighted sum of the center pixel value, the mean value, and the variance calculated in a square kernel surrounding the pixel. In order to filter pixels located near the edges of the image, edge pixel values are replicated to produce sufficient data (Lee, 1981). In addition, Enhance Lee algorithm is used primarily to suppress speckle. It smoothes image data without removing edges or sharp features in the images while minimizing the loss of radiometric and textural information. In homogeneous areas, speckles are removed using a low-pass filter. In heterogeneous areas, speckles are reduced while preserving the texture. In areas containing isolated point targets, the filter preserves the observed value (Lopes, 1993). Table 2 shows that standard division of RADARSAT-1 SAR with window size of 5x5 are lowers compared to ERS-1 data. This explains that fine mode CHH band is more suitable for detecting spit compared to ERS-1. In fact, that RADARSAR-1 SAR in its fine mode with higher resolution of 8.4 m, width range resolution 9.1 m, and the growth coverage reduced to nominal 15 km with assist help to keep the downlink signal within its allocated band width, the stepped incidence angle of 37 to 47° profile in fine mode data is useful for spit detection with incidence angle of 23°. This result agrees with study of Maged and Mazlan (2009). In general, speckle reduction can impact the accuracy of coastal geomorphology mapping. This can be forced by the window kernal size and sensor types. Surpass of kernal window size more than 11 x 11 pixels can produce
1894
Int. J. Phys. Sci.
Figure 4. Enhance Lee algorithm with different kernel window sizes.
Figure 3. Lee algorithm with different kernel window sizes.
Table 1. Statistical table of Lee algorithm for ERS-1 and RADARSAT-1 data.
Window size 3X3 5X5 7X7
Standard division ERS-1 RADARSAT-1 27.36 22.3 26.92 20.5 26.99 21.6
the blur images with less information while sensor type with its physical characteristics can impact the quality of information derived from despeckle images. In addition, the reduction noise algorithms have a great role for mapping coastal geomorphology features. According to Maged (2002) Lee algorithm provides accurate information on linear features such as a coastline while Gamma algorithms provide information regarding surrounding area such as lake or lagoon features. Figure 5 shows the rate changes of spit from 1993 to 2003. It is clear that the spit growth up within 7 months/year. Figure 6 shows that the rate changes estimated from Multi-SAR data are agreed with one 2 estimated from ground data. This is clear with R value of 0.76. The high rate of spit changes of 7 months/year during the period of 1993 to 2003 might be due to the accumulation of sediment along the mouth River of Kuala Terengganu. Clearly, Terengganu‘s spit was generated due to the deposition of sediment due to hydrodynamic changes between estuary and ocean. According to Maged
Table 2. Statistical table of enhance Lee algorithm for ERS-1 and RADARSAT-1 data.
Window kernel size
Standard division ERS-1 RADARSAT-1
3×3 5×5
26.80 26.29
19.76 18.21
7×7
26.29
20.55
(1994) Terengganu‘s mouth river is the largest hydrologic communication between an estuary and the South China Sea. This spit occurred when long shore drift reaches a section of Terengganu’s River where the turn is greater than 30 degrees. Therefore, it continued out into the sea until water pressure from a Terengganu‘s River becomes too much to allow the sand to deposit. The spit then be grown upon and become stable and often fertile. As spit grows, the water behind them is sheltered from wind and waves. This could be due the high sediment transport through the water outflow from the river mouth, or northerly net sediment transport due to Northeast monsoon wave effects (Maged, 2001). In general context, Long shore drift (also called littoral drift) occurs due to waves meeting the beach at an oblique angle, and backwashing perpendicular to the shore, moving sediment down the beach in a zigzag pattern. Long shore drifting is complemented by long shore currents, which transport sediment through the water alongside the beach. These currents are set in motion by the same oblique angle of entering waves that causes littoral drift and transport sediment in a similar process. The hydrody-namic interaction between long shore current and water inflow
Marghany et al.
1895
Figure 5. Spit rate changes from Multi-SAR satellite data.
multi-SAR data. The study shows that Enhance Lee algorithm has an excellent performance as compared to Lee algorithm. This was shown with kernel window size of 5 x 5 pixels and lines with standard division of 18.21. The study shows that the spit is dominated by high rate of accretion of 7 months/year. In conclusion, multi-SAR satellite data can be used to monitor coastal geomorphology changes. REFERENCES
Figure 6. Regression analysis of Rate Changes estimated from MultiSAR and in situ measurements.
from the Terengganu Mouth River is causing the changes in spit’s geomorphology characteristics. This finding confirms the study of Maged et al. (2009) and Maged and Mazlan (2009). Conclusion This study has utilized adaptive filter algorithms of Lee and Enhance Lee to automatic detection of spit from
Blodget HW, Taylor PT, Raork JH (1991). Shoreline Change along the Rosetta Nile Promontory-Monitoring with Satellite Observations. Marine Geol., 99: 3383-3397. Evans OF (1942). The origin of spits, bars and related structures: J. Geol., 50: 846-863. Gowda HH, Raj KG, Padmavathy AS, Manikiam B (1995). Multidate satellite data for study of dynamics of coastal landforms of Uttara Kannada, South India. Int. J. Remote Sens., 16(14): 2539-2553. Frihy OE, Dewidar KM, Nasr SM, El Raey MM (1998). Change Detection of the northeastern Nile Delta of Egypt: Shoreline Changes, Spit Evaluation, Margin Changes of Mazola Lagoon and its Islands. J. Remote Sens., 19(10): 1901-1912. Holman RA, Sallenger AH, Lippmann TC, Haines JW (1993). The application of Video Image Processing to the Study of Nearshore Processes. J. Oceangr., 6(3): 78-85. Jamaluddin MJ (1989). Pengantar Geomorfologi. Universiti Kebangsaan Malaysia, p. 404. Lee JS (1981). Speckle Analysis and Smoothing of Synthetic Aperture Radar Images. Comp. Graphics Image Proc., 17: 24-32. Lokman MHY, Rosnan, Saad S (1995). Beach Erosion Variability
1896
Int. J. Phys. Sci.
During a North – East Monsoon, The Kuala Setiu Coastline, Terengganu, Malaysia. J. Pertanika., 3(2): 337-348. Lopes A, Nezry E, Touzi R (1993). Adaptive Speckle Filters and Scene Heterogeity. IEEE Transact. Geosci. Remote Sens., 28(6): 992-1000. Maged M (1994). Coastal Water Circulation off Kuala Terengganu, Malaysia”. MSc. Thesis Universiti Pertanian Malaysia. Maged MM (2001). TOPSAR Wave Spectra Model and Coastal Erosion Detection. Int. J. Appl. Earth Observ. Geoinfarmation, 4(3): 147-160. 3: 257-365. Maged M (2002). Opertional of Canny Algorithm on SAR data for Modelling Shoreline Change. Photogram. Ferner. Geoinformation, 93: 93-102. Maged M, Hashim M, Cracknell A (2009). 3D reconstruction of coastal bathymetry from AIRSAR/POLSAR data. Chinese J. Oceanol. Limnol., 27(1): 117-123. Maged M, Hashim M (2009). Differential synthetic aperture radar interferometry (DInSAR) for 3D coastal geomorphology reconstruction. IJCSNS Int. J. Comput. Sci. Network Security, 9(5): 59-63. Oliveira FSC, Kampel M, Amaral S (2008). Multitemporal assessment of the geomorphologic evolution of the Restinga of Marambaia, Rio de Janeiro, Brazil. Int. J. Remote Sens., 29(19): 5585-5594.
Ruessink BG, Kroon A (1994). The behavior of a multiple bar system in the nearshore Zone of Terschelling, The Netherlands, Marine Geol., 12(3): 187-197. Singhroy V (2002). SAR Incidence Angles for Mapping Areas Affected by Geological Hazards, Tropical Case Studies. Asian J. Geoinformat., 2(3): 56-67. Shu Y, Li J, Gomes G (2010). Shoreline extraction from RADARSAT-2 intensity imagery using a narrow band level set segmentation approach. Marine Geodesy, 33: 187-203. Wang Y, Allen TR (2008). Estuarine shoreline change detection using Japanese ALOS PALSAR HH and JERS-1 L-HH SAR data in the Albemarle-Pamlico Sounds, North Carolina, USA. Int. J. Remote Sens., 29(15): 4429-4442. Yu Y, Acton ST (2004). Automated delineation of coastline from polarimetric SAR imagery. Int. J. Remote Sens., 17(25): 3423-3438. Zhu X (2001). Remote Sensing of Coastline Changes in Pearl River Estuary. Mar. Environ. Sci., 21: 19-22.