This article was downloaded by: [Florida Atlantic University] On: 19 June 2014, At: 07:00 Publisher: Taylor & Francis Informa Ltd Registered in England and Wales Registered Number: 1072954 Registered office: Mortimer House, 37-41 Mortimer Street, London W1T 3JH, UK
Remote Sensing Letters Publication details, including instructions for authors and subscription information: http://www.tandfonline.com/loi/trsl20
Mapping urban land cover types using object-based multiple endmember spectral mixture analysis a
a
a
b
Caiyun Zhang , Hannah Cooper , Donna Selch , Xuelian Meng , c
d
a
Fang Qiu , Soe W. Myint , Charles Roberts & Zhixiao Xie
a
a
Department of Geosciences, Florida Atlantic University, Boca Raton, FL, USA b
Department of Geography and Anthropology, Louisiana State University, Baton Rouge, LA, USA c
Geographic Information Sciences, University of Texas at Dallas, Richardson, TX, USA d
School of Geographical Sciences and Urban Planning, Arizona State University, Tempe, AZ, USA Published online: 16 Jun 2014.
To cite this article: Caiyun Zhang, Hannah Cooper, Donna Selch, Xuelian Meng, Fang Qiu, Soe W. Myint, Charles Roberts & Zhixiao Xie (2014) Mapping urban land cover types using object-based multiple endmember spectral mixture analysis, Remote Sensing Letters, 5:6, 521-529 To link to this article: http://dx.doi.org/10.1080/2150704X.2014.930197
PLEASE SCROLL DOWN FOR ARTICLE Taylor & Francis makes every effort to ensure the accuracy of all the information (the “Content”) contained in the publications on our platform. However, Taylor & Francis, our agents, and our licensors make no representations or warranties whatsoever as to the accuracy, completeness, or suitability for any purpose of the Content. Any opinions and views expressed in this publication are the opinions and views of the authors, and are not the views of or endorsed by Taylor & Francis. The accuracy of the Content should not be relied upon and should be independently verified with primary sources of information. Taylor and Francis shall not be liable for any losses, actions, claims, proceedings, demands, costs, expenses, damages, and other liabilities whatsoever or howsoever caused arising directly or indirectly in connection with, in relation to or arising out of the use of the Content. This article may be used for research, teaching, and private study purposes. Any substantial or systematic reproduction, redistribution, reselling, loan, sub-licensing,
Downloaded by [Florida Atlantic University] at 07:00 19 June 2014
systematic supply, or distribution in any form to anyone is expressly forbidden. Terms & Conditions of access and use can be found at http://www.tandfonline.com/page/termsand-conditions
Remote Sensing Letters, 2014 Vol. 5, No. 6, 521–529, http://dx.doi.org/10.1080/2150704X.2014.930197
Mapping urban land cover types using object-based multiple endmember spectral mixture analysis Caiyun Zhanga*, Hannah Coopera, Donna Selcha, Xuelian Mengb, Fang Qiuc, Soe W. Myintd, Charles Robertsa, and Zhixiao Xiea
Downloaded by [Florida Atlantic University] at 07:00 19 June 2014
a
Department of Geosciences, Florida Atlantic University, Boca Raton, FL, USA; bDepartment of Geography and Anthropology, Louisiana State University, Baton Rouge, LA, USA; cGeographic Information Sciences, University of Texas at Dallas, Richardson, TX, USA; dSchool of Geographical Sciences and Urban Planning, Arizona State University, Tempe, AZ, USA (Received 4 March 2014; accepted 23 May 2014) Spectral mixture analysis has been frequently applied in various fields to solve the mixed pixel problem in remote sensing. So far, all the research in mixture analysis has focused on the sub-pixel analysis, i.e., selecting endmembers and conducting mixture analysis at the pixel level. Research efforts in mixture analysis at the object level are very scarce, even though the object-based image analysis (OBIA) techniques have been well developed. In this study, we examined the applicability of object-based mixture analysis in an urban environment using a Landsat Thematic Mapper image. Informative and accurate object-based fraction maps (vegetation, impervious surface, and water) were produced by combining the OBIA and multiple endmember spectral mixture analysis (MESMA) techniques. A new approach to identifying the spectral representatives of a specific class for MESMA was developed. The accuracy of the object-based fraction maps were assessed using manual interpretation results of a 1-m digital aerial photograph. Object-based mixture analysis produced a higher accuracy than traditional pixel-based mixture analysis. This work illustrates the potential of object-based mixture analysis of moderate spatial resolution imagery in mapping heterogeneous urban environments.
1. Introduction The remote sensing spectral mixing problem, i.e., multiple surface materials appearing in one pixel, has received the research interest for many decades, as evidenced by a review in Somers et al. (2011). A number of methods have been developed to solve this problem with linear spectral mixture analysis (SMA) being the most commonly used. SMA models each pixel as a linear sum of spectrally ‘pure’ endmembers (Adams, Smith, and Johnson 1986). Fraction maps demonstrating the abundance of each surface material within a pixel can be produced. The value of SMA-derived sub-pixel fraction maps has been illustrated in various fields (Somers et al. 2011). However, SMA may fail to generate valuable results in heterogeneous areas with diverse endmembers when moderate spatial resolution multispectral images such as Landsat Thematic Mapper (TM) data are applied. SMA requires the number of endmembers not exceeding the number of spectral channels; thus, it only allows a small number of endmembers to be considered in the model. Large spectral variability within a specific class may cause major errors in SMA. In addition, SMA assumes that the set of endmembers present in a pixel is invariable, which again may *Corresponding author. Email:
[email protected] © 2014 Taylor & Francis
Downloaded by [Florida Atlantic University] at 07:00 19 June 2014
522
C. Zhang et al.
cause considerable errors given the fact that the type and number of surface materials are highly variable over heterogeneous landscapes such as urban areas. To address the problems in SMA, Roberts et al. (1998) introduced the multiple endmember spectral mixture analysis (MESMA), which allows the number and type of endmembers to vary for each pixel within an image. MESMA searches for the best-fit model for each input pixel based on a spectral library with many spectra to account for the spectral variability within a specific class. MESMA has proven valuable in mapping natural, extraterrestrial, and urban environments using multispectral, hyperspectral, and thermal imagery (Somers et al. 2011). It can significantly reduce the fraction estimation errors compared with the application of SMA in heterogeneous areas. Today, MESMA is the most widely used mixture analysis technique in remote sensing (Somers et al. 2011). Previous applications of SMA or MESMA have concentrated on sub-pixel analysis by selecting endmembers and conducting mixture analysis at the pixel level. An object-based mixture analysis (i.e., selecting endmembers and conducting mixture analysis at the object level) has never been reported in the literature. The object-based image analysis (OBIA) has been well developed and widely applied in many fields, as reviewed by Blaschke (2010). Townshend et al. (2000) have pointed out that a significant problem usually ignored with pixel-based analysis of land cover type is that a substantial proportion of the signal apparently coming from the land area represented by a pixel comes from the surrounding pixels. An alternative solution to this problem is to use contexture procedures in which observations from surrounding pixels are used to assist the analysis (Blaschke, Burnett, and Pekkarinen 2004). Object-based analysis that analyses or classifies objects instead of pixels is an effective approach to reduce this effect by integrating neighbourhood information. It is also known that pixel-based analysis may lead to the ‘salt-andpepper’ effect in mapping heterogeneous landscapes. This issue can be overcome by the OBIA technique. A combination of OBIA and MESMA techniques may have the potential to produce more accurate and informative fraction maps. However, research efforts in this perspective are very limited. Mapping complex urban environments using MESMA at the object level is even scarcer. To this end, the objective of this study is to examine the applicability of object-based mixture analysis in an urban environment using MESMA. The V-I-S model proposed by Ridd (1995) is commonly used to map an urban environment from Landsat TM data when MESMA is applied (e.g., Powell et al. 2007; Myint and Okin 2009; Weng and Pu 2013). The V-I-S model conceptualizes an urban environment in terms of three primary physical components: vegetation (V), impervious surfaces (I), and soil (S) (V-I-S components), in addition to water. Most studies masked out water from further analysis. Our study site is a city located in South Florida. In most urban areas of South Florida, bare soil is hardly seen while water is everywhere appearing as rivers, streams, canals, pools, lakes, and ponds. Many man-made freshwater lakes and ponds are parts of a storm water system to manage the run-off from rainfall and help prevent flooding. Thus, a revised V-I-S model, V (vegetation) – I (impervious surface) – W (water) (V-I-W) model was used to characterize our study area. 2. Study area and data The city of West Palm Beach located in South Florida was selected as our study area (Figure 1). The city is the oldest large municipality in the South Florida metropolitan area with a size of about 140 km2. The study site includes many typical urban land cover classes such as low-density residential areas, high-density residential areas, commercial
523
Downloaded by [Florida Atlantic University] at 07:00 19 June 2014
Remote Sensing Letters
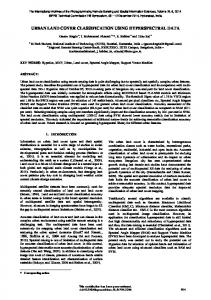
Figure 1. (a) Standard false colour composite of the TM imagery (bands 4, 3, 2 as red, green, and blue, respectively) collected on 25 January 2005 (path/row:15/41) for the study area (26º42′27.5˝N, 80º10′3.9˝W) and TM-derived object-based fraction maps for (b) vegetation, (c) impervious surface, and (d) water, respectively. (e) and (f) are pixel-based fraction maps for impervious surface and vegetation, respectively.
524
C. Zhang et al.
Downloaded by [Florida Atlantic University] at 07:00 19 June 2014
areas, parks, cement roads, and tar roads. Several golf courses and the Palm Beach International Airport are also within the study area. A cloud-free 30-m Landsat TM image collected on 25 January 2005 was downloaded from US Geological Survey (USGS) (http://earthexplorer.usgs.gov/). The original scene was subset to extract the study area. The thermal band (band 6) was excluded from further analysis. The remaining six bands (from blue to short-wave infrared) were used to map the study area and examine the applicability of object-based mixture analysis. A 1-m fine spatial resolution aerial photograph collected on 26 January 2005 by National Aerial Photography Program was used to validate the mapping results from TM data. The aerial photograph has been orthorectified by the USGS as Digital Orthophoto Quarter Quads (DOQQs) products. Both the TM data and the aerial photograph have been georeferenced into Universal Transverse Mercator projection North Zone 17 by USGS.
3. Methodology 3.1. Image segmentation to generate image objects To conduct object-based mixture analysis, image objects should be produced first. We used the multiresolution segmentation algorithm in eCognition Developer 8.64.1 (Trimble 2011) to generate image objects from TM data. The segmentation algorithm starts with one-pixel image segments and merges neighbouring segments together until a heterogeneity threshold is reached (Benz et al. 2004). The heterogeneity threshold is determined by a user-defined scale parameter as well as colour/shape and smoothness/compactness weights. The scale parameter decides the size of the objects with a small value generating more objects (small size) and a large value creating less objects (big size). Using a smaller value of this parameter can produce more homogeneous objects than a bigger value, which can help endmember determination in further steps. Mixture analysis can be applied to any objects generated from different scale parameters based on what level of detail users want the fraction maps to present. We carried out a series of segmentations with the scale parameter ranging from 2 to 8, at an interval of 1 to determine an optimal value that can create objects well representing patches of trees, grass, impervious surfaces, and water. A scale parameter of 3 was found to be optimal for endmember selection through visual examination. A bigger value of 10 was set for this parameter to create objects for mixture analysis. All six bands of the TM data were set to equal weights. Colour/shape weights were set to 0.9/1.0 so that spectral information would be considered most heavily for segmentation. Smoothness/compactness weights were set to 0.5/0.5 so as to not favour either compact or non-compact segments. Following the segmentations, the spectral mean of each object was extracted for endmember selection and mixture analysis.
3.2. Object-based endmember selection The image-based endmember selection method is frequently applied in mixture analysis because the selected endmembers have the same systematic errors and scale as the image to be unmixed. So far, all researchers conducted the pixel-based endmember selection with the Pixel Purity Index (PPI) method proposed by Boardman, Kruse, and Green (1995) as the most commonly used. For this study, we conducted an object-based endmember selection, i.e., selected endmembers at the object level using image objects instead of pixels. Three advantages can be found for the object-based endmember selection compared with the pixel-based one. (1) A ‘pure’ object is more representative for a
Downloaded by [Florida Atlantic University] at 07:00 19 June 2014
Remote Sensing Letters
525
land cover type than a pixel. As mentioned in Section 1, the signal recorded at the sensor for a single pixel is affected by the spectral properties of surrounding pixels. Using the average of the spectra of all pixels within an object can reduce this effect. (2) Shadow/ shade within an object can be spectrally ‘filtered out’ by using the spectrum of an object, which will reduce the complexity of endmember library construction and MESMA models. (3) Additional object-based spatial features (e.g., texture) can be extracted for each object, which may have the potential to improve endmember selection (Rogge et al. 2007) as well as decrease fraction estimation errors by including more endmembers in the mixture model. We applied the PPI algorithm to identify ‘pure’ objects by calculating the PPI score for each object first and then extracted all the potential endmember objects using a threshold to the PPI scores. To refine the endmember objects, the vector polygons of these objects were projected to the DOQQ imagery and wrong endmember objects were manually removed.
3.3. Determination of representatives for each physical component The final identified endmember objects were generalized into three physical components: vegetation, impervious surface, and water. Shadow/shade was not considered in this study because most Florida cities are relatively flat and the effects of shadow/shade are small. In addition, no pure shadow/shade object/pixel was identified in the imagery. In SMA, a simple average spectrum of all the endmembers of a component is considered as the representative of this component. This does not account for the spectral diversity of a component. In MESMA, the spectral diversity within a component can be considered, but spectral representatives of each component are commonly determined first to reduce the complexity in computation and interpretation. Several methods have been developed in identifying those representative spectra of a specific class, such as count-based endmember selection (Roberts et al., 2003), endmember average root mean square error (Dennison and Roberts 2003), and the minimum average spectral angle (Dennison, Halligan, and Roberts 2004). All these approaches require knowledge about the spectral characteristics to assign each spectrum to a particular class. In this study, an unsupervised neural network, i.e., Gaussian fuzzy self-organizing map (GFSOM) (Zhang and Qiu 2012a), combined with a statistical technique, the Student t-test, was used to identify the representative spectra of each component. The GFSOM was originally designed as an unsupervised classifier to produce a predetermined number of clusters (e.g., 5) for an input image. This algorithm determines the spectral representatives of the input image. A predefined number of spectral clusters of endmembers of a component (e.g., vegetation) can be created using GFSOM. Similarity may exist for the produced clusters; thus, the two-sample Student t-test was used to assess the similarity of the distribution of two adjacent clusters. This statistical technique can test the similarity of two clusters by calculating a p value. If the p value is greater than 0.05, indicating the two clusters are basically from the same distribution, then the two adjacent clusters are merged; otherwise, they are kept separated. The merging of the clusters can be conducted iteratively until no more merging is needed. In this way, the number of representatives as well as their spectra for each component can be finally determined (Zhang and Qiu 2012b). For our study area, we found two representatives for vegetation, five representatives for impervious surfaces, and one representative for water. These representatives were built as a spectral library to be used in MESMA.
526
C. Zhang et al.
Downloaded by [Florida Atlantic University] at 07:00 19 June 2014
3.4. Object-based mixture analysis MESMA was applied to unmix each input image object. Researchers commonly started MESMA with the two-endmember model, i.e., assuming at least two endmembers present in each pixel (e.g., Powell et al. 2007). Large errors may occur for an input pixel or object with only one endmember presented. Thus, here, we tested one-, two-, three-, four, five-, and six-endmember models for each input object and calculated the root mean square error (RMSE) of each model. Note that for this study, only six spectra representing six bands of TM data were used. The largest number of endmembers in MESMA cannot exceed the number of spectral bands in the input. The best model was identified as the one with the lowest RMSE. The fractions of input endmembers from the best model were generalized into three physical components and a final object-based fraction map of each component was produced. We developed a mixture analysis tool using Visual Basic.net in Microsoft Visual Studio 2010 to implement MESMA.
3.5. Pixel-based mixture analysis The pixel-based mixture analysis was also carried out for comparison purpose. We first selected the centre pixels within the identified endmember objects as the endmember pixels and then applied the same approach as described in Section 3.3 to determine the representative spectra of each component based on the selected endmember pixels. MESMA was finally applied to unmix each pixel in terms of the determined representative spectra, resulting in the fraction estimations for each pixel.
3.6. Accuracy assessment To assess the accuracy of the produced object-based fraction maps, a total of 150 objects were randomly selected by following a spatially stratified data sampling strategy, in which a fixed percentage of object samples were selected over the entire image. The pixelderived fractions were aggregated for the selected validation objects. This makes the pixel-based analysis comparable with the object-based analysis results. The TM-derived fractions of the selected samples were assessed using the manual interpretation results from the digital aerial photograph. Statistical correlation of the TM-derived fractions and reference fractions were calculated. The ‘goodness’ of the correlation was assessed by the slope, intercept, and R2 (coefficient of determination) of the relation. In an ideal case, the slope of the straight line describing the relationship between two data-sets would be equal to 1, and the value of the intercept would be equal to 0, and the R2 would be equal to 1.
4. Results and discussion The produced object-based fraction maps for vegetation, impervious surface, and water are shown in Figure 1(b)–(d). For comparison purpose, a standard false colour composite of the TM imagery (bands 4, 3, 2 as red, green, and blue, respectively) and the pixel-based fraction maps for impervious surface and vegetation are also displayed in Figure 1(a), (e), and (f), respectively. In the fraction maps, red represents the higher fraction, while blue represents the lower fraction. In general, the fraction maps present the spatial patterns of the distribution of three components well. Forests, parks, and golf courses have higher vegetation fractions, while man-made roads, commercial areas, and the airport (the upper right corner) have higher impervious fractions. High water fractions are identified in
527
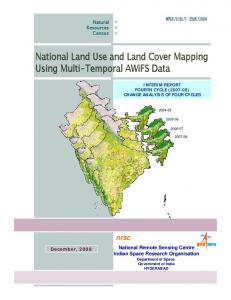
canals, lakes, and ponds in the residential areas. The vegetation fraction map also shows an inverse of the impervious surface map, which is expected for most well-developed cities. Compared with pixel-based fraction maps (Figure 1(e) and (f)) as well as the published Landsat-derived pixel-based fraction maps in urban areas (e.g., Powell et al. 2007; Myint and Okin 2009; Weng and Pu 2013), the object-based fraction maps are more informative by effectively removing the salt-and-pepper effect in pixel-based analysis. The correlation between the TM-derived and reference fractions is shown in Figure 2. For the object-based fraction estimations (Figure 2(a)–(c)), the regression of two data-sets for all fractions gave slopes of near 1 and intercept of near 0. The R2 values of all fractions exceeded 0.85, suggesting the object-based mixture analysis is an accurate procedure in mapping urban areas. Note that the best result is achieved in mapping impervious areas (R2 = 0.95). This is encouraging given the fact that the accurate knowledge of impervious surfaces (e.g., magnitude, location, geometry, spatial pattern, and perviousness–impervious ratio) is significant to a range of issues and themes in urban environment such as human–environment interactions. Impervious surface data are also important in urban planning and resource management (Weng 2012). Similarly, the correlation between the pixel-derived and reference fractions is displayed in Figure 2(d)–(f). Relatively poor relations of two data-sets were illustrated compared with the object-based mixture analysis in terms of all derived values for slope, intercept, and R2. This indicates that object-based mixture analysis is more effective than the commonly used pixel-based mixture analysis for the study area. (b)
(a) 1.0
0.8
0.6
0.4
0.2
0.0
0.0
0.2
0.4
0.6
0.8
0.8
0.6
0.4
0.2
0.0
1.0
0.0
0.2
Reference vegetation fraction
0.4
0.6
0.8
0.6
0.4
0.2
0.6
0.4
0.2
0.0
0.8
0.6
0.4
0.2
0.0 0.2
0.4
0.6
0.8
0.2
1.0
0.4
0.6
0.8
1.0
(f) 1.0
y = 0.697x – 0.036 R2 = 0.76 Pixel-derived water fraction
Pixel-derived impervious fraction
0.8
Reference vegetation fraction
0.0
Reference water fraction
(e) 1.0
y = 0.850x + 0.161 R2 = 0.79
0.0
0.8
0.0
1.0
y = 0.924x – 0.020 R2 = 0.90
Reference impervious fraction
(d) 1.0
(c) 1.0
y = 1.038x – 0.014 R2 = 0.95 Object-derived water fraction
y = 0.996x + 0.056 R2 = 0.87
Object-derived impervious fraction
Object-derived vegetation fraction
1.0
Pixel-derived vegetation fraction
Downloaded by [Florida Atlantic University] at 07:00 19 June 2014
Remote Sensing Letters
y = 0.767x + 0.117 R2 = 0.73
0.8
0.6
0.4
0.2
0.0 0.0
0.2
0.4
0.6
0.8
Reference impervious fraction
1.0
0.0
0.2
0.4
0.6
0.8
1.0
Reference water fraction
Figure 2. Comparisons between TM-derived and reference fractions based on 150 randomly selected objects. (a)–(c) are validations of the object-based mixture analysis, and (d)–(f) are validations of pixel-based mixture analysis for vegetation, impervious surface, and water, respectively.
Downloaded by [Florida Atlantic University] at 07:00 19 June 2014
528
C. Zhang et al.
Powell et al. (2007) and Myint and Okin (2009) applied MESMA at the pixel level in City of Manaus (Brazil) and City of Phoenix (the United States), respectively. These two studies reported lower R2 values for both estimated fractions of vegetation and impervious surface than this study. They conclude the estimation accuracy may depend on the size of a square window applied in the accuracy assessment procedure. Powell et al. (2007) used a 270 × 270-m window, while Myint and Okin (2009) used a 60 × 60-m window. In the pixel-based mixture analysis, researchers commonly define a square window that will be utilized for the entire image to select samples for accuracy assessment. Determination of an optimal window size is difficult and variable results can be produced using different window sizes. In contrast, in the object-based mixture analysis, defining a subjective window size for accuracy assessment is not necessary. The object-based mixture analysis applies the OBIA technique that offers the capability for identifying regions of varying shapes and sizes in an image. The randomly selected image objects for accuracy assessment have different shapes and sizes; thus, the results are more robust than using an invariant square window over the entire image in pixel-based mixture analysis.
5. Conclusions This article is the first effort in object-based mixture analysis for mapping urban land cover types by combining the OBIA and MESMA techniques. A new approach was developed to identify the spectral representatives of a specific class by integrating an unsupervised neural network with a statistical method. The present techniques produced more accurate and informative land cover type maps than the pixel-based mixture analysis for a city in South Florida by characterizing the diversity of this city through three physical components (vegetation, impervious surface, and water). Note that this work is a pilot study of the object-based mixture analysis and its application in an urban environment. Considerable applications of the techniques developed here in other fields are necessary to test its robustness and extensibility. It is also interesting to understand the effects of the scale parameter in image segmentation on the analysis results. These will be the major dedications in our future work. It is anticipated that this study can bridge the gap between OBIA and MESMA techniques and stimulate further object-based mixture analysis in various applications.
Acknowledgement The authors appreciate the valuable suggestions from the editor Dr Timothy Warner and anonymous reviewers for improving this study.
References Adams, J. B., M. O. Smith, and P. E. Johnson. 1986. “Spectral Mixture Modeling: A New Analysis of Rock and Soil Types at the Viking Lander 1 Site.” Journal of Geophysical Research-Solid Earth and Planets 91: 8098–8112. doi:10.1029/JB091iB08p08098. Benz, U., P. Hofmann, G. Willhauck, I. Lingenfelder, and M. Heynen. 2004. “Multiresolution, Object-Oriented Fuzzy Analysis of Remote Sensing Data for GIS-Ready Information.” ISPRS Journal of Photogrammetry and Remote Sensing 58: 239–258. doi:10.1016/j. isprsjprs.2003.10.002. Blaschke, T. 2010. “Object Based Image Analysis for Remote Sensing.” ISPRS Journal of Photogrammetry and Remote Sensing 65: 2–16. doi:10.1016/j.isprsjprs.2009.06.004. Blaschke, T., C. Burnett, and A. Pekkarinen. 2004. “New Contextual Approaches Using Image Segmentation for Object-Based Classification.” In Remote Sensing Image Analysis: Including
Downloaded by [Florida Atlantic University] at 07:00 19 June 2014
Remote Sensing Letters
529
the Spatial Domain, edited by F. De Meer and S. de Jong, 211–236. Dordrecht: Kluwer Academic Publishers. Boardman, J. W., F. A. Kruse, and R. O. Green. 1995. “Mapping Target Signatures via Partial Unmixing of AVIRIS Data.” In Summaries of the Fifth Annual JPL Airborne Geoscience Workshop, 23–26. Pasadena, CA: Jet Propulsion Laboratory Publications. Dennison, P. E., K. Halligan, and D. A. Roberts. 2004. “A Comparison of Error Metrics and Constraints for Multiple Endmember Spectral Mixture Analysis and Spectral Angle Mapper.” Remote Sensing of Environment 93: 359–367. doi:10.1016/j.rse.2004.07.013. Dennison, P. E., and D. A. Roberts. 2003. “Endmember Selection for Multiple Endmember Spectral Mixture Analysis Using Endmember Average RMSE.” Remote Sensing of Environment 87: 123–135. doi:10.1016/S0034-4257(03)00135-4. Myint, S. W., and G. S. Okin. 2009. “Modelling Land‐Cover Types Using Multiple Endmember Spectral Mixture Analysis in a Desert City.” International Journal of Remote Sensing 30: 2237– 2257. doi:10.1080/01431160802549328. Powell, R. L., D. A. Roberts, P. E. Dennison, and L. L. Hess. 2007. “Sub-Pixel Mapping of Urban Land Cover Using Multiple Endmember Spectral Mixture Analysis: Manaus, Brazil.” Remote Sensing of Environment 106: 253–267. doi:10.1016/j.rse.2006.09.005. Ridd, M. K. 1995. “Exploring a V-I-S (Vegetation-Impervious Surface-Soil) Model for Urban Ecosystem Analysis through Remote Sensing: Comparative Anatomy for Cities.” International Journal of Remote Sensing 16: 2165–2185. doi:10.1080/01431169508954549. Roberts, D. A., P. E. Dennison, M. Gardner, Y. Hetzel, S. L. Ustin, and C. Lee. 2003. “Evaluation of the Potential of Hyperion for Fire Danger Assessment by Comparison to the Airborne Visible/ Infrared Imaging Spectrometer.” IEEE Transactions on Geoscience and Remote Sensing 41: 1297–1310. doi:10.1109/TGRS.2003.812904. Roberts, D. A., M. Gardner, R. Church, S. Ustin, G. Scheer, and R. O. Green. 1998. “Mapping Chaparral in the Santa Monica Mountains Using Multiple Endmember Spectral Mixture Models.” Remote Sensing of Environment 65: 267–279. doi:10.1016/S0034-4257(98)00037-6. Rogge, D. M., B. Rivard, J. Zhang, A. Sanchez, J. Harris, and J. Feng. 2007. “Integration of SpatialSpectral Information for the Improved Extraction of Endmembers.” Remote Sensing of Environment 110: 287–303. doi:10.1016/j.rse.2007.02.019. Somers, B., G. P. Asner, L. Tits, and P. Coppin. 2011. “Endmember Variability in Spectral Mixture Analysis: A Review.” Remote Sensing of Environment 115: 1603–1616. doi:10.1016/j. rse.2011.03.003. Townshend, J., C. Huang, S. Kalluri, R. Defries, S. Liang, and K. Yang. 2000. “Beware of Per-Pixel Characterization of Land Cover.” International Journal of Remote Sensing 21: 839–843. doi:10.1080/014311600210641. Trimble. 2011. eCognition Developer 8.64.1 Reference Book. Westminster, CO: Trimble Geospatial Imaging. Weng, F., and R. Pu. 2013. “Mapping and Assessing of Urban Impervious Areas Using Multiple Endmember Spectral Mixture Analysis: A Case Study in the City of Tampa, Florida.” Geocarto International. doi:10.1080/10106049.2013.764355. Weng, Q. 2012. “Remote Sensing of Impervious Surfaces in the Urban Areas: Requirements, Methods, and Trends.” Remote Sensing of Environment 117: 34–49. doi:10.1016/j. rse.2011.02.030. Zhang, C., and F. Qiu. 2012a. “Hyperspectral Image Classification Using an Unsupervised NeuroFuzzy System.” Journal of Applied Remote Sensing 6: 063515. doi:10.1117/1.JRS.6.063515. Zhang, C., and F. Qiu. 2012b. “Mapping Individual Tree Species in an Urban Forest Using Airborne Lidar Data and Hyperspectral Imagery.” Photogrammetric Engineering and Remote Sensing 78: 1079–1087. doi:10.14358/PERS.78.10.1079.