Hindawi Publishing Corporation Computational Intelligence and Neuroscience Volume 2015, Article ID 217216, 13 pages http://dx.doi.org/10.1155/2015/217216
Research Article MapReduce Based Personalized Locality Sensitive Hashing for Similarity Joins on Large Scale Data Jingjing Wang1,2 and Chen Lin1,2 1
School of Information Science and Technology, Xiamen University, Xiamen 361005, China Shenzhen Research Institute of Xiamen University, Shenzhen 518058, China
2
Correspondence should be addressed to Chen Lin;
[email protected] Received 28 September 2014; Revised 24 February 2015; Accepted 2 March 2015 Academic Editor: J. Alfredo Hernandez Copyright © 2015 J. Wang and C. Lin. This is an open access article distributed under the Creative Commons Attribution License, which permits unrestricted use, distribution, and reproduction in any medium, provided the original work is properly cited. Locality Sensitive Hashing (LSH) has been proposed as an efficient technique for similarity joins for high dimensional data. The efficiency and approximation rate of LSH depend on the number of generated false positive instances and false negative instances. In many domains, reducing the number of false positives is crucial. Furthermore, in some application scenarios, balancing false positives and false negatives is favored. To address these problems, in this paper we propose Personalized Locality Sensitive Hashing (PLSH), where a new banding scheme is embedded to tailor the number of false positives, false negatives, and the sum of both. PLSH is implemented in parallel using MapReduce framework to deal with similarity joins on large scale data. Experimental studies on real and simulated data verify the efficiency and effectiveness of our proposed PLSH technique, compared with state-of-the-art methods.
1. Introduction A fundamental problem in data mining is to detect similar items. Finding similar pairs of instances is an essential component in mining numerous types of data, including document clustering [1, 2], plagiarism detection [3], image search [4], and recommender system [5]. Identifying pairs of similar instances is also called similarity joins [6]. Given a set of data instances, a similarity threshold 𝐽, and a join attribute 𝑎, the goal of similarity joins is to find all pairs of instances ⟨𝐴, 𝐵⟩ where their similarity on the join attribute is larger than the threshold 𝐽 (i.e., sim(𝐴.𝑎, 𝐵.𝑎) ≥ 𝐽). There are various similarity measurements, including cosine similarity [7], edit distance [6, 8, 9], hamming distance [7, 10], dimension root similarity [2], and EDU-based similarity for elementary discourse units [11]. In this work we focus on Jaccard similarity, which is proven to be successful for high dimensional, sparse feature sets [6]. Jaccard similarity for two feature vectors 𝑆1 and 𝑆2 is defined as sim(𝑆1 , 𝑆2 ) = |𝑆1 ∩ 𝑆2 |/|𝑆1 ∪ 𝑆2 |. As an example, we illustrate naive computation for similarity joins
based on Jaccard similarity in Table 1. Suppose there are 5 instances, namely, 𝐴, 𝐵, 𝐶, 𝐷, and 𝐸, the join attribute consists of features 𝑎, 𝑏, 𝑐, 𝑑, 𝑒, 𝑓, the Jaccard similarity of ⟨𝐴, 𝐵⟩ is 1/4, ⟨𝐴, 𝐶⟩ is 2/3, ⟨𝐵, 𝐶⟩ is 1/5, ⟨𝐵, 𝐸⟩, ⟨𝐶, 𝐷⟩, and ⟨𝐶, 𝐸⟩ is 1/4, ⟨𝐷, 𝐸⟩ is 1/3, and the similarities for remaining pairs ⟨𝐴, 𝐷⟩, ⟨𝐴, 𝐸⟩, ⟨𝐵, 𝐷⟩ are all 0. Given the similarity threshold 𝐽 = 0.5, it is directly concluded that instances 𝐴 and 𝐶 are similar. A naive algorithm, which finds similar pairs by computing similarities for all instance pairs, is clearly impracticable on a large collection of instances with high dimensional features. To improve efficiency and scalability of similarity joins, previous research efforts generally fall into two categories. On one hand, parallel algorithms are adopted on clusters of machines. Most of them are implemented using MapReduce framework, including a 3-stage MapReduce approach for end-to-end set-similarity join algorithm [12], fast computation of inner products for large scale news articles [13], and a new ant colony optimization algorithm parallelized using MapReduce [14] to select features in a high dimension space. Others exploit the parallelism and high data
2 throughput of GPU, that is, the LSS algorithm [15]. On the other hand, algorithmic design can be improved to reduce time and storage cost of similarity computation for high dimensional feature space. One type of such approaches uses dimension reduction technologies, including Principle Components Analysis and neural networks [16]. Another type is to hash and filter, so that high dimensional feature space can be replaced by smaller representative signatures. Most popular hashing methods include minhashing [17], minwise hashing [18], and Locality Sensitive Hashing (LSH) [10]. The core idea of hashing is to map similar pairs to similar signatures with several hundred dimensions, each element of which is the result of hashing and hence sheds insights to the solution of high dimensionality. Hashing can also be a means for data clustering because it enables similar features with vast dimensions to be hashed into the same buckets and thus partitions features into groups [19]. Filtering methods, including length filter [7], prefix filter [20], and suffix filter [21], are frequently utilized consequently to eliminate dissimilar pairs while possible similar pairs remain. As a result, fewer similarity computations are needed. In particular, banding technique [22], a specified form of Locality Sensitive Hashing, which maps every band of signatures to an array of buckets so the probability of collision is much higher for instances close to each other, is the most efficient filtering method. Although previous works have demonstrated the importance and feasibility of hashing and filtering approaches, one critical issue remains underestimated. Hashing and filtering approaches produce approximate results. The similarities of selected pairs are not guaranteed to be larger than the predefined threshold. In the meanwhile, obsoleted pairs are not indeed dissimilar, with similarities less than the predefined threshold. The former case is called false positive, while the latter one is called false negative. An appropriate number of false positives and false negatives are acceptable in many applications. However, the tolerance to false positive and false negative may differ. In most application scenarios such as clustering and information retrieval, a small amount of false positives is emphasized to increase efficiency and precision. In applications such as recommendation and bioinformatics systems [23–25], a small number of false negatives are more important. In this paper, we address the problem of tailoring the number of false positives and false negatives for different applications. To the best of our knowledge, this is the first time in literature to present such detailed analysis. False positives and false negatives are caused by the scheme of pruning candidate pairs whose signatures map into disjoint bucket arrays. Intuitively, similar signatures are likely to have highly analogous bands. And analogous bands will be mapped into identical bucket arrays. Inspired by this intuition, we propose the new banding technique called Personalized Locality Sensitive Hashing (PLSH), in which bands of signatures mapped to at least 𝑘 identical buckets are selected as candidates. We also explore the probability guarantee of the new banding techniques provided for three cases, namely, false negatives, false positives, and the sum of both. According to these probabilities, we propose the
Computational Intelligence and Neuroscience Table 1: An illustrative example of similarity joins based on Jaccard similarity. 0/1 indicates absence/presence of features in each instance. Instance A B C D E
𝑎 0 1 0 0 0
𝑏 1 0 1 0 0
𝑐 0 0 0 1 0
Feature 𝑑 0 0 1 1 1
𝑒 1 1 1 0 0
𝑓 0 1 0 0 1
upper bounds and lower bounds of false positives and false negatives and accordingly present to personalize the parameters involved in banding and hashing algorithms to fulfill different application demands. The contributions of this paper are threefold: (i) We improve the traditional banding technique by a new banding technique with flexible threshold to reduce the number of false positives and improve efficiency. (ii) We derive the number and lower/upper bound of false negatives and false positives and balancing between them for our new banding technique. (iii) We implement the new banding technique using parallel framework MapReduce. The rest of the paper is structured as follows. In Section 2, the backgrounds of minhashing and banding technique are presented. In Section 3, we introduce Personalized Locality Sensitive Hashing (PLSH). The implementation of PLSH using MapReduce is shown in Section 4. In Section 5, we present and analyze the experimental results. We survey the related works in Section 6. Finally, the conclusion is given in Section 7.
2. Background In this section, we briefly introduce the minhashing algorithm and the consequent banding algorithm, which are the fundamental blocks of Locality Sensitive Hashing (LSH). The intuition of minhashing is to generate low dimensional signatures to represent high dimensional features. The intuition of banding is to filter candidates which are not likely to be similar pairs. 2.1. MinHashing. For large scale data sets, feature space is usually high dimensional and very sparse; that is, only a tiny portion of features appear in a single instance. In order to reduce the memory used to store sparse vector, we use a signature, an integer vector consisting of up to several hundred elements to represent an instance. To generate a signature, we first randomly change the order of features. In other words, the permutation defines a hash function ℎ𝑖 that shuffles the features. Each element of signature is a minhash value [17], which is the position of the first nonzero feature in the permuted feature vector. For example, the original
Computational Intelligence and Neuroscience
3
Table 2: An illustrative example of permutation of feature vectors. 0/1 indicates absence/presence of features in each instance. Instance A B C D E
Feature b 1 0 1 0 0
a 0 1 0 0 0
c 0 0 0 1 0
d 0 0 1 1 1
f 0 1 0 0 1
e 1 1 1 0 0
feature vector in Table 1 is 𝑎𝑏𝑐𝑑𝑒𝑓; suppose the permuted feature vector is 𝑏𝑎𝑐𝑑𝑓𝑒; then feature vectors for 𝐴, 𝐵, 𝐶, 𝐷, and 𝐸 become (100001), (010011), (100101), (001100), and (000110) as illustrated in Table 2. Thus the minhash value for 𝐴, 𝐵, 𝐶, 𝐷, and 𝐸 is 1, 2, 1, 3, and 4, respectively. We can choose 𝑛 independent permutations ℎ1 , ℎ2 , . . . , ℎ𝑛 . Suppose the minhash value of an instance 𝑆𝑖 for a certain permutation ℎ𝑗 is denoted by min ℎ𝑗 (𝑆𝑖 ); then the signature denoted by Sig(𝑆𝑖 ) is Sig (𝑆𝑖 ) = (min ℎ1 (𝑆𝑖 ) , min ℎ2 (𝑆𝑖 ) , . . . , min ℎ𝑛 (𝑆𝑖 )) . (1) The approximate similarity between two instances based on their signatures is defined as the percentage of identical values at the same position in the corresponding signatures. For example, given 𝑛 = 6, Sig(𝑆1 ) = (2, 1, 5, 0, 3, 2), and Sig(𝑆2 ) = (2, 1, 3, 2, 8, 0), the approximate Jaccard similarity is sim(𝑆1 , 𝑆2 ) ≈ 2/6 = 0.33. 2.2. Banding. Given a large set of signatures generated in Section 2.1, it is still too costly to compare similarities for all signature pairs. Therefore, a banding technique is presented consequently to filter dissimilar pairs. The banding technique divides each signature into 𝑏 bands, where each band consists of 𝑟 elements. For each band of every signature, the banding technique maps the vector of 𝑟 elements to a bucket array. As shown in Figure 1, the 𝑖th band of each signature maps to bucket array 𝑖. Intuitively, if for a pair of signatures, the corresponding bucket arrays have at least one bucket array in common, then the pair is likely to be similar. For example, signature 1 and signature 2 and signature 2 and signature 𝑚 in Figure 1 are similar. Such a pair with common bucket array is considered to be a candidate pair and needs to be verified in the banding technique.
3. Personalized LSH 3.1. New Banding Technique. The candidates generated by LSH are not guaranteed to be similar pairs. Chances are that a pair of signatures are projected to identical bucket arrays even if the Jaccard similarity between the pair of instances is not larger than the given threshold. In the meantime, a pair of instances can be filtered out from candidates since their corresponding signatures are projected into disjoint bucket arrays even if the Jaccard similarity is smaller than the given threshold. The former case is called false positive, while
the latter one is called false negative. Massive false positives will lead to inaccurate results, while a large amount of false negatives will deteriorate computational efficiency of LSH. To enhance the algorithm precision and efficiency, we present here a new banding scheme to filter more dissimilar instance pairs. Intuitively, if two instances are highly alike, it is possible that many bands of the two corresponding signatures are mapped to identical buckets. For example, in Figure 1, there are at least 3 bands (i.e., the 1st, the 5th, and the 𝑏th bands) of signature 1 and signature 2 which map to the same buckets (i.e., in the corresponding bucket array 1, 5, 𝑏). Therefore, we change the banding scheme as follows. For any pair of instances, if the two corresponding signatures do not map into at least 𝑘 (𝑘 ∈ [1, 𝑏]) identical buckets, it will be filtered out. Otherwise, it is considered to be a candidate pair and the exact Jaccard similarity is computed and verified. For the signatures shown in Figure 1, given 𝑘 = 3, signature 1 and signature 𝑚 and signature 2 and signature 𝑚 are filtered. 3.2. Number of False Positives. A candidate pair ⟨𝑆1 , 𝑆2 ⟩ is false positive, if sim(⟨𝑆1 , 𝑆2 ⟩) < 𝐽 and 𝑆1 , 𝑆2 share at least 𝑘 common bucket arrays. Since the efficiency of LSH is mainly dependent on the number of false positives, and most real applications demand a high precision, we first derive the possible number of false positives generated by the new banding technique. Lemma 1. The upper bound of false positives generated by the new banding technique is equal to the original LSH and the lower bound is approximate to 0. Proof. According to the law of large numbers, the probability that the minhash values of two feature vectors (e.g., 𝑆1 , 𝑆2 ) are equal under any random permutation ℎ, is very close to the frequency percentage of observing identical value in the same position at two long signatures of the corresponding feature vectors. That is, 𝑃? (min ℎ (𝑆1 ) = min ℎ (𝑆2 )) (2) ? Sig (𝑆1 )𝑟 = Sig (𝑆2 )𝑟 , 𝑛 → +∞ Sig (𝑆1 ) where 𝑛 is the length of signatures Sig(𝑆1 ) and Sig(𝑆2 ); 𝑟 is the position in signatures, 𝑟 ∈ [1, 𝑛]. Also, the probability that a random permutation of two feature vectors produces the same minhash value equals the Jaccard similarity of those instances [17]. That is, 𝑆 ∩ 𝑆2 𝑃? (min ℎ (𝑆1 ) = min ℎ (𝑆2 )) = 1 = sim (𝑆1 , 𝑆2 ) . 𝑆1 ∪ 𝑆2 (3) = lim
Based on the above two equations, the probability of two instances with Jaccard similarity 𝑠 is considered to be a candidate pair by the new banding technique denoted by 𝑃new as 𝑘−1 𝑖 𝑖 𝑏−𝑖 𝑃new (𝑠) = 1 − ∑ ( ) (𝑠𝑟 ) (1 − 𝑠𝑟 ) , 𝑖=0 𝑏
(4)
4
Computational Intelligence and Neuroscience Bucket array 1
Bucket array 3
Bucket array 5
···
···
···
Bucket array b
··· ···
Signature 1 Signature 2 ···
Signature m r columns b bands
Figure 1: An illustrative example of banding technique.
where 𝑠 is the Jaccard similarity of the two instances, 𝑟 is the length of each band, and 𝑏 is the number of bands. We can prove the derivative of 𝑃new (𝑠) is greater than 0, which represents 𝑃new (𝑠) a monotonically increasing function of 𝑠. The number of false positive, denoted by FPmax (𝑘), is 𝐽
FPmax (𝑘) = ∫ 𝑁𝑠 𝑃new (𝑠) 𝑑𝑠, 0
1
1
0.8 0.6 0.5155
(5)
0.4 0.2
where 𝑁𝑠 denotes the total number of similar pairs whose Jaccard similarity is 𝑠 in the instances set. Given an instance set, 𝑁𝑠 is a constant. 𝐽 is the given similarity threshold. The value of FPmax (𝑘) depends on the similarity distribution of a given instance set. The upper bound of FPmax (𝑘) equals the original LSH FPmax (1). Without the knowledge of the similarity distribution of the data set, the lower bound of false positives cannot be directly derived. Hence, we introduce a threshold 𝜖 to ensure FPmax (𝑘) ≤ 𝜖, FPmax (1)
1.2
(6)
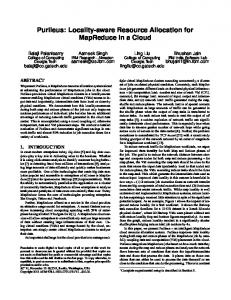
where 𝜖 is close to zero with increasing 𝑘. If 𝑘 is ⌊𝐽𝑛/𝑟⌋, the lower bound of false positives approximates to 0, which indicates that the candidates generated by the proposed new banding technique are almost all truly similar pairs. To understand the zero lower bound with 𝑘 = ⌊𝐽𝑛/𝑟⌋, suppose there are two signatures with 𝑛 elements each, ⌊𝐽𝑛/𝑟⌋ bands of which are mapped to the same bucket. At least 𝑟⌊𝐽𝑛/𝑟⌋ ≈ 𝐽𝑛 elements in the two signatures are identical because a band includes 𝑟 elements. According to (2) and (3), the approximate similarity between the two corresponding instances is then greater than 𝐽𝑛/𝑛 = 𝐽. Hence, similarity for each pair of signatures is greater than the threshold 𝐽 and no false positives exist. The introduction of 𝜖 also enables us to personalize the number of false positives, that is, to vary the range of 𝑘 for different 𝜖. The range of 𝑘 for a desired 𝜖 is a function of 𝐽, 𝑏, 𝑟 that can be numerically solved. For
0
0.2609 0.1195 0.048
0.0001
1 2 3 4 5 6 7 8 9 10 11 12 13 14 15 16 17 18 19 20 k
Figure 2: An illustrative example of number of false positives for various 𝑘.
example, given 𝐽 = 0.7, 𝑏 = 20, 𝑟 = 5; Figure 2 shows the trend of FPmax (𝑘)/FPmax (1) for 𝑘. The minimum of FPmax (𝑘)/FPmax (1) is achieved when 𝑘 = 𝑏. If the desired 𝜖 = 0.4, we can find a satisfying range of 𝑘 ∈ [3, 20] since FPmax (2)/FPmax (1) ≥ 𝜖 and FPmax (3)/FPmax (1) ≤ 𝜖. 3.3. Number of False Negatives. False negatives are truly similar pairs mapped to disjoint bucket arrays. We also derive the upper and lower bound of false negatives generated by the proposed new banding technique. Lemma 2. The upper bound of false negatives generated by the 𝑟 𝑖 𝑟 𝑏−𝑖 𝑖 new banding technique is ∑𝑏−1 𝑖=0 (( 𝑏 ) (𝑠 ) (1 − 𝑠 ) )𝑁𝑠≥𝐽 . The lower bound is close to the original LSH. Proof. Similar to Section 3.2, the number of false negatives, denoted by FNmax (𝑘), is 1
FNmax (𝑘) = ∫ 𝑁𝑠 (1 − 𝑃new (𝑠)) 𝑑𝑠. 𝐽
(7)
FNmax (𝑘) is a monotonic increasing function of 𝑘. The lower bound of it is achieved when 𝑘 = 1. The upper bound of
Computational Intelligence and Neuroscience
5
FNmax (𝑘) is obtained when 𝑘 is the total number of bands. Hence, the upper bound of FNmax (𝑘) is proportional to the number of similar instances 𝑁𝑠≥𝐽 : 𝑖 𝑖 𝑏−𝑖 lim FNmax (𝑘) = ( ∑ ( ) (𝑠𝑟 ) (1 − 𝑠𝑟 ) ) 𝑁𝑠≥𝐽 . 𝑘→𝑏 𝑏 𝑖=0
450 400 350
340.9962
300
𝑏−1
(8)
265.7423
250 200
193.9112
150 102.9641
100 50
For a desired the number of false negatives, we do a division between FNmax (𝑘) and FNmax (1) in terms of FNmax (𝑘) ≤ 𝜖, FNmax (1)
(9)
where 𝜖 is a threshold which is always greater than 1. By deriv1 𝑟 𝑖 𝑖 ing the numerical solution for ∫𝐽 𝑁𝑠 (1 − (∑𝑏−1 𝑖=0 ( 𝑏 ) (𝑠 ) (1 −
𝑠𝑟 )𝑏−𝑖 ))𝑑𝑠, the range of 𝑘 for a desired 𝜖 is obtained. For example, given the arguments 𝐽 = 0.7, 𝑏 = 20, 𝑟 = 5, Figure 3 shows us the trend of FNmax (𝑘)/FNmax (1). If the desired 𝜖 = 100, from Figure 3, we can find that FNmax (5)/FNmax (1) ≈ 70 and FNmax (6)/FNmax (1) ≈ 100, so the satisfying range is 𝑘 ∈ [1, 5].
1 2 3 4 5 6 7 8 9 10 11 12 13 14 15 16 17 18 19 20 k
Figure 3: An illustrative example of number of false negatives for various 𝑘. 1.6 1.4 1.2
FNPmax (𝑘) = FPmax (𝑘) + FNmax (𝑘) .
1.0323
1 0.8 0.6
0.6989 0.5356
0.4 0.2
3.4. Balance False Positives and False Negatives. In some application scenarios, we want to have a balance between false positives and false negatives. Here we analyse a special case where we want a desired aggregated number of false positives and false negatives. We use FNPmax to denote the sum of false positives and false negatives, which is defined as follows:
70.4462
0
0.4929
0.2674
0 1 2 3 4 5 6 7 8 9 10 11 12 13 14 15 16 17 18 19 20 k
Figure 4: An illustrative example of balancing false positives and false negatives.
(10)
The lower bound of FNPmax (𝑘) is dependent on the similarity distribution of the given data set. However, since in most cases 𝑁𝑠