bile robot, Sojourner, a 12 kg six-wheeled mobile robot .... be used instead of the PSD, and image processing used to ... However, the PSD based sensor.
Mars Rover Navigation Results Using Sun Sensor Heading Determination Richard Volpe Jet Propulsion Laboratory California Institute of Technology Pasadena, California 91109
Abstract Upcoming missions to the surface of Mars will use mobile robots to traverse long distances from the landing site. To prepare for these missions, the prototype rover, Rocky 7, has been tested in desert eld trials conducted with a team of planetary scientists. While several new capabilities have been demonstrated, foremost among these was sun-sensor based traversal of natural terrain totaling a distance of one kilometer. This paper describes navigation results obtained in the eld tests, where cross-track error was only 6% of distance traveled. Comparison with previous results of other planetary rover systems shows this to be a signi cant improvement.
1 Introduction In 1997, NASA revisited the planet Mars for the rst time in twenty years. The Path nder1 lander contained the mobile robot, Sojourner, a 12 kg six-wheeled mobile robot which ventured out from the lander, taking pictures and positioning a science instrument against designated soil and rocks [13, 12]. Based on previous rover prototypes [11], Sojourner was designed to demonstrate the viability of mobile robot exploration of Mars. Current plans are to build upon this successful test of a planetary rover with longer range traversals across Mars beginning in 2003. Therefore, we have been investigating next generation prototype rovers with more manipulation, mobility, autonomy, and general functionality [19]. This paper describes our next generation prototype rover, Rocky 7, and its successful desert eld trials of the long range mission scenario2 . Speci c details are provided on the performance of navigation using the sun's position in the sky, the local vertical, and the time of day to calculate heading and control the rover's direction of travel. Section 2 describes many of the features of our test vehicle, Rocky 7, and is followed by a description of its navigation command and control strategies in Section 3. Section 4 provides an overview of the desert eld test objectives and implementation. Experimental results are presented and analyzed in Section 5, and the indicated areas and methods for improving performance are discussed in Section 6. 1 2
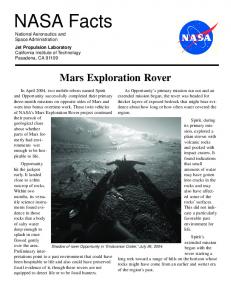
Figure 1: The Rocky 7 rover with its mast deployed, and a close-up view of the sun sensor.
2 Rocky 7 Overview
Figure 1 shows the Rocky 7 Mars rover research prototype. Whereas Sojourner employed technology demonstrated in previous prototypes (e.g. Rocky 3 and 4), Rocky 7 was designed to advance rover technology for future missions, such as the upcoming Mars Surveyor Rover Mission3 . Among these rover technologies are: reduced-actuator mobility, appendages and algorithms for sampling and periscopic viewing, improved actuation and sensing, computationally intensive sensor processing, and a contemporary computing environment [20, 21, 22]. Rocky 7 is slightly larger and heavier than Sojourner, being 60 x 40 x 35 cm3 and 15.5 kg. Like Sojourner, Rocky 7 employs a rocker-bogie six wheel con guration [5]. However, unlike its predecessors with four corner steering, Rocky 7 only has steering capability on two corners, driving like a car or fork-lift. Also, the wheels on each bogey have been moved close together. While not greatly reducing its step climbing capability of greater than 1.2 wheel diameters, this con guration change creates an inability to turn in place about the center of the vehicle as with four corner steering. Instead, the nominal rotation axis for Rocky 7 is located
http://mpfwww.jpl.nasa.gov/ http://robotics.jpl.nasa.gov/tasks/lrsr/
3
1
http://mars.jpl.nasa.gov/
mid-way between the double wheel pairs. (Tank steering can be used to approximate turn in place operations, but the extensive wheel slippage corrupts odometer information, and will cause the vehicle to sink into soft Martian soil.) To provide views of the surrounding terrain, a 3 DOF manipulator deploys through a slot in the solar panel and acts as a camera mast, as shown in Figure 1. It carries an integrated sensor package which has stereo cameras with counter rotating lter wheels, and an interchangeable instrument canister. The primary function of the mast is to extend to a height of 1.4 meters from ground level and rotate 360 degrees to provide panoramic imagery. It can also look down at the surrounding terrain or the rover itself, enabling visual self-inspection from all directions. Rocky 7 has a full suite of navigation sensors. The con guration of the rocker-bogey suspension is measured with potentiometers, and the tilt of the chassis is obtained with three accelerometers. A quartz rate sensor can measure the rate of rotation of the vehicle about its vertical axis, but this measurement must be integrated to provide heading, making it subject to drift as noise and bias error are integrated with the rate signal. The amount of drift is proportional to the total time of integration, and therefore the distance traveled divided by the speed. Faster speeds can reduce the error, but they may also increase vehicle vibration on rough terrain, another source of noise and drift. Optimal speeds are not known at this time. For all of these reasons, absolute heading sensors are a better solution. On Earth, the magnetic compass is the most common absolute heading device. However, use of a compass is not legitimate for our tests since Mars has a negligible magnetic eld. Star tracking is not an option since it will not provide heading during the daytime, and typically requires narrow eld of view imaging made di�cult by rover motion over rough terrain [8]. Horizon feature tracking is computational intensive, and will not work in featureless terrains such as the Viking Lander II site on Mars [7]. Therefore, to provide a reliable measurement of the vehicle heading we have employed a wide eld of view sun sensor, as shown in Figure 1. This sensor is rigidly attached to the rover facing upward. It projects an image of the sky on to a two dimensional analog position-sensing-device (PSD), which puts out analog signals proportional to the centroid of the intensity image [10]. Used in conjunction with accelerometer readings to determine sensor tilt, and local time from an on-board clock, it enables the absolute vehicle heading to be calculated [23]. Since the sun sensor is essentially a camera, a CCD could be used instead of the PSD, and image processing used to extract the sun position. However, the PSD based sensor employed on Rocky 7 is attractive for its fast rate of update and minimal computational overhead [17]. This simplicity and speed come at the cost of increased complexity of calibration, and slight miscalibration did lead to test errors discussed later in Section 5.1. (Subsequent recalibration has been performed, and the sensor is being used in on-going improvements in rover position estimation lters, which rely on the the fast update rate provided by its analog design.) Although not employed for sun sensing, black and white
CCD cameras are used extensively on Rocky 7, for hazard avoidance, navigation telemetry, and science data. Images from pairs of these cameras are captured simultaneously as stereo pairs. Mast imagery is typically returned to the rover operators as panoramic mosaics for use in specifying rover traversals. Body mounted hazard avoidance imagery are typically processed on-board to provide depth maps of the environment, and then automatically analyzed for abrupt changes in height or high-centering hazards [15, 21]. Impassable regions are speci ed to the navigation algorithm through a fuzzy classi cation of the region position: left, right, or center. The central region is de ned as the width of the vehicle extending out to 50 cm. The left and right regions are from either side of the central region to the edge of the eld of view. Navigation based on this classi cation is reviewed next.
3 Rocky 7 Navigation After the completion of Rocky 7's construction and baseline programming, a series of increasingly lengthy demonstrations were conducted in the JPL MarsYard and the Mojave desert. Contained, herein, are the results of the last of these tests, a simulated mission performed at Lavic Lake lava ow and dry lake-bed on the Twenty Nine Palms Marine Corps Base [2]. During this simulation, Rocky 7 traversed more than one kilometer across four distinct terrains, while commanded remotely by a team of scientists and engineers. The strategy for a simulated exploration of Mars, as with a real mission, requires the rover to simply go where commanded, within the limits allowed by the on-board safety system [24]. This ability depends on reliable techniques for operator interfacing, mobility, hazard detection, piloting, and position estimation of the rover. Rocky 7's operator interface is the Web Interface for Telescience (WITS)[4]. Through it, an operator is provided with panoramic stereo images taken from Rocky 7's deployable mast, or with aerial images obtained during an emulation of the lander descent (obtain by helicopter). From this imagery, samples of which are shown in Figures 2 and 3, waypoints and science targets are selected and incorporated in a sequential list sent to the rover. The rover interprets each waypoint as a goal to which it must navigate while avoiding obstacles. Stereo images of the terrain are processed on-board the rover, and some terrain features are interpreted as obstacles [15]. Based on the location of obstacles and the goal with respect to the rover, very simple reactive rules are used to decide its piecewise motion [19, 11, 6]. That is, the rover either turns in place by one half radian, or moves forward in one quarter meter path segments that are straight or in an arc toward the goal. Then the entire procedure is repeated. The performance of this sequence of activities depends heavily on the accuracy of the position estimate of the rover | globally, locally, and incrementally. Position estimation of the rover is comprised of down-track and cross-track estimation of position as the rover traverses. First order estimates of the down-track position are obtained directly from
Figure 3: Panoramic mosaic taken by the mast cameras of Rocky 7 from the beginning of the traverse from point A in Figure 2. The center of the mosaic is facing north. The large white patch, visible in both views, is a ground target used for guiding the aerial imaging. D
C
B
A
Figure 2: Imagery of Lavic Lake site at 862 m above ground
level, taken by helicopter during an emulated lander descent. Letters indicate the location of pre-positioned ground targets. Solid lines indicated the rover traverses discussed in detail. Dashed lines indicate other rover traverses. The direct distance from A to D is approximately 1 km. wheel odometry. But the accuracy of the position estimate is largely dependent on knowledge of heading, because small heading errors can develop into large cross-track position errors during extended traversals. As described above, sun sensing has been employed on Rocky 7 to provide a very useful heading estimate [18].
4 Field Tests Description The selected site for the eld tests was Lavic Lake, a dry lake-bed bordered by a lava ow and geologic fault line, and pock-marked by Marine bombing practice. Figure 2 is an aerial view of the test site on the southwestern edge of the lake-bed. In preparation for the tests, four geologically distinct science sites were chosen within the Lavic Lake area: a
lava ow with desert pavement, undisturbed playa, cratered playa, and an alluvial fan. Each of these sites were imaged by helicopter in a nested sequence that emulated planned lander descent images for upcoming Mars missions. Figure 2 shows one image from these sequences which captures all four regions. The operations center for the tests was located in a trailer parked close to point B. In addition to the emulated descent imagery, the rover operator and scientists made all mission decisions based on information sent back from Rocky 7 in the form of images and other telemetry. A complete log of this information is available over the Internet 4 . In addition to the telemetry used for mission planning, two other forms of data were collected. First, a complete log of the rover's on-board command sequencing was captured, as well as rover position estimates at each navigation step. Second, approximately every three meters of traverse the rover position was marked and the time noted. The marked locations were later measured with surveying equipment. The results of these measurements are presented in the next section.
5 Experimental Results This section presents the rover traverse results during the three segments shown by solid lines in Figure 2. The rst segment is closest to the bottom of the aerial view and point A, and is referred to as the `Sunshine Flow Traverse'. The second segment is just north of this and is referred to as the `Flow Margin Traverse'. The third segment is between points C and D, and is referred to as the `Cratered Playa Traverse'. Figures 4 show Rocky 7 and the terrain from ground level during each of these segments. Figures 5(a), (e), and (i) show plan views of measured positions of the rover during the three traverses. All coordinates are in a frame with east as positive x, north as positive y, and the origin located at the base-station near point B in Figure 2. The dark line in each plot is the onboard estimate of the rover position. The label `SPICE' is an acronym of the database in which all of the telemetry was stored (Spacecraft, Planet, and Instrument Con guration matrix and Events [1]). The squares on each plot are the position of the rover measured by the Ground Truth Station surveying equipment. The accuracy of these measurement is 4
http://wundow.wustl.edu/rocky7/
(a) Sunshine Flow: roughest terrain, (b) Flow Margin: ow edge at begin- (c) Cratered Playa: in shallow crater near beginning of rst traverse and A, ning of second traverse, looking north. along third traverse, near C looking looking west. northwest. Figure 4: Views from ground level of traverse terrain for three segments. data is also shown in Figure 6(a), indicating an average relative error of 6%.
approximately 20 cm, well below the resolution of the plots. Also shown by solid diamonds are the commanded goal positions, which are generically called waypoints (whether they are intermediate or terminal goal points). Note that the on-board rover position estimate will typically move directly to a waypoint since the rover always `thinks' it is headed the right way. In those cases where the rover does not reach a waypoint, there has been an error condition which prompted communication with the base station, resulting in a new waypoint being provided. Error conditions during the eld test had several sources, and were as simple as inadvertent loss of power due to battery depletion. Also problematic were data drop-outs due to lost radio communication during the traverse. These are indicated by missing portions of the dark lines on the plots. Below each plan view in Figure 5 is the same data plotted explicitly against time from the beginning of the traverse. Time passage due to temporal breaks at meals or end-of-day has been ignored, but other time passage when the rover was not moving has been included. Typically the latter was during periods when panoramic images were being taken by the rover, or commands were being generated at the base station. These periods appear as at portions of the plots and often correspond directly to the positions of the waypoints. A typical cycle of operation involved the rover reaching a commanded position tens of meters away, taking a panorama, and then receiving a new goal based on the new imagery. In a real mission on Mars, each of these cycles would require at least one day, due to limited communication opportunities with the spacecraft.
where the approximation is true for small values of e� . It is important to note this result shows that with an absolute heading device like the sun sensor, the relative position error is a constant. From the previous section, ep =d = 0:06 or 3:4� .
5.1 Position Error
5.2.2 Individual Traversal Results
Figure 6(a) shows the absolute position errors for the three traverses. From this plot it is apparent that the error grows linearly with distance traveled. A least-squares t of the
5.2 Heading Error
5.2.1 Obstacle Free Analysis
If the rover is considered to be simply trying to stay in a straight line, the measured position error may be used to determine the heading error. For the sun sensor, a simple sensor model assumes an accurate heading angle plus bias: �
= � 0 + e�
(1)
For simplicity, we can let �0 = 0. Therefore, if the rover speed is v, its (x; y) position will be: x = vt cos e�
y
= vt sin e�
(2)
In the absence of bias the rover would drive straight; that is, with e� = 0, x = vt = d. Therefore, the position error is: ep
p
= (vt cos e� ? vt)2 + (vt sin e� )2 = 2d sin e2�
�
e� d
(3) (4) (5)
For the experimental traversals performed, two issues complicated the situation beyond simply staying in a straight line. First, terrain considerations required that traversals
-295
-190
760
-200
740
-305 -210 -315
720
-220
700
Y Distance (m)
Y Distance (m)
-335
Y Distance (m)
-230 -325
-240 -250 -260
680
660
-345 640
-270 -355
-365
-375 135
-280 SPICE Position Values GTS Position Values Waypoints
620 SPICE Position Values GTS Position Values Waypoints
-290 -300
580 -150
-310 145
155
165
175
185
195
205
215
40
(a) Sunshine Flow
50
60
70
80
90
(e) Flow Margin
X Distance (m)
195
100 110 120 130 140 150 160
-130
-110
-90
-70
-50
-30
-10
10
30
(i) Cratered Playa
X Distance (m)
X Distance (m)
140
30
130
10
-10
120
185
SPICE Position Values GTS Position Values Waypoints
600
-30
175
Distance (m)
Distance (m)
Distance (m)
110
100
-50
-70
90 -90 80
165 SPICE X Values GTS X Values 155 0:00
1:00
2:00
70
3:00
4:00
5:00
6:00
7:00
60 0:00
8:00
(b) Sunshine Flow
SPICE X Values GTS X Values
1:00
-130
2:00
(f) Flow Margin
Elapsed Time (hr)
-290
-300
-110
3:00
4:00
5:00
-150 0:00
6:00
SPICE X Values GTS X Values
1:00
2:00
3:00
4:00
5:00
6:00
7:00
5:00
6:00
7:00
(j) Cratered Playa
Elapsed Time (hr)
Elapsed Time (hr)
680
-190 -200
SPICE Y Values GTS Y Values
-210 -310
-220
-330
-340
-240
Distance (m)
Distance (m)
Distance (m)
675
-230
-320
-250 -260
670
-270
-350
-280
665
-360 -290 -370
-380 0:00
SPICE Y Values
1:00
2:00
3:00
(c) Sunshine Flow
4:00
5:00
6:00
7:00
-310 0:00
8:00
SPICE Y Values GTS Y Values
GTS Y Values
-300
1:00
2:00
3:00
4:00
5:00
660 0:00
6:00
(g) Flow Margin
2:00
3:00
180 SPICE Heading Values GTS Heading Values
SPICE Heading Values GTS Heading Values
90
0
90
Heading (deg)
Heading (deg)
Heading (deg)
90
0
-90
-90
4:00
Elapsed Time (hr)
180
180
1:00
(k) Cratered Playa
Elapsed Time (hr)
Elapsed Time (hr)
0
-90
SPICE Heading Values GTS Heading Values
-180 0:00
1:00
2:00
3:00
(d) Sunshine Flow
4:00
5:00
Elapsed Time (hr)
6:00
7:00
8:00
-180 0:00
1:00
2:00
3:00
(h) Flow Margin
4:00
Elapsed Time (hr)
5:00
6:00
-180 0:00
1:00
2:00
3:00
4:00
5:00
6:00
7:00
(l) Cratered Playa
Elapsed Time (hr)
Figure 5: Plan view of the three rover traverses, and position/heading values over time. Solid lines and dots are estimated values, squares are measured values, and diamonds are commanded waypoint positions.
3.0
14 Flow Flow Margin Cratered Playa Linear (All)
12
Sojourner
2nd Order fit (Rocky3)
2nd Order fit (Sojourner)
10
2.5
1.5
8
6
4
2.0 Position Error (m)
Position Error (m)
Position Error (m)
Rocky 3
2.0
1.0
1.5
1.0
0.5 0.5
2 0.0
0.0 0
0 0
20
40
60
80
100
120
140
160
1
2
3
4
5
6
7
0
8
2
4
6
8
10
12
14
16
18
20
Distance Traveled (m)
Distance Traveled (m)
180
Distance Traveled (m)
(a) Rocky 7 in Desert
(b) Sojourner On Mars
(c) Rocky 3 in Lab
Figure 6: Plot of all absolute position errors versus respective distance traveled for three rovers. The least square t indicates is shown as a solid line. For Rocky 7 the error is linear, providing a relative error of 6%. 40
on
20
=8
12:00
eg
0d
Azimuth Error (deg)
13:30
ati
Samples Std Dev Mean
Sunshine Flow 374 39:5� ?16:7� Margin Before Turn 281 6:1� ?7:4� Margin After Turn 188 9:4� ?63:0� Cratered Playa 500 31:6� ?87:2� Table 1: Statistical description of heading measurements during traversals.
30
ev
Traverse
El
be composed of intermediate waypoints, which sometimes deviated from exactly straight lines. Second, the rover was actively performing hazard avoidance during the traverses, which added to position error and forced time to be spent at headings other than those to the goal. For these reasons, it is illustrative to look in detail at the heading of the rover during the individual traversals, shown in Figures 5(d), (h), and (l). Note that the externally measured heading values, indicated by squares, are very sporadic. This was due to the limited opportunities to measure the orientation of the rover, since it was moving and care was needed to not enter the eld of view of the sun sensor or hazard detection cameras. The heading values represented in the gures may be quanti ed by looking at the statistics of the measurements, shown in Table 1. Greater deviation in the heading is due to more frequent turning of the rover to avoid obstacles or reach intermediate waypoints. This action is typically marked by large changes, as seen in Figure 5(d) and is consistent with the rough terrain and numerous waypoints of this traverse. Smaller uctuations in the heading, as shown in Figure 5(h), are often due to other sources such as sun sensor noise, accelerometer noise, or sun sensor calibration error [18]. Experimentation subsequent to these desert eld trials has indicated that the sun sensor was slightly out of calibration during these traverses. This miscalibration added an orientation and time dependent bias to the heading of the vehicle, and can account for much of the heading bias error
10 Elevation =
0
20 deg
-10 -20
9:30
-30
11:00
-40 0
45
90
135 180 225 Azimuth (deg)
270
315
360
Figure 7: Plot of sun sensor azimuth error versus azimuth with di�erent values of elevation shown by contours. This error is due to slight miscalibration of the sun sensor, but can lead to signi cant errors. See text for details. which led directly to cross-track error. Figure 7 shows the miscalibrated sun sensor operation range during the traverse shown in Figure 5(e). During the morning (9:30 - 11:00) the operational area of the sun sensor, due to sun position and rover orientation, caused an error opposite in sign to that of the afternoon (12:00 - 1:30). Therefore, in the morning, before the turn, the rover drifted to the right | and in the afternoon, after the turn, drifted to the left. Recalibration of the sensor after the eld tests removed this problem.
5.3 Performance Comparison Even with the calibration error of the sun sensor, the eld tests demonstrated an intrinsic performance improvement when compared to other techniques, primarily angular rate sensing. Odometry alone can be shown to provide no useful heading information during these tests.
5.3.1 Angular Rate Sensor
When used in conjunction with odometry, angular rate sensing provides a moderately useful position estimate, but much poorer than that obtained with sun sensing. This can best be seen by developing a sensor model similar to that provided in Section 5.2.1. In the case of the rate sensor, a bias will typically exist in the rate signal: =
�
�0
+
Z
t?
0
�
�_0 + e! d�
=
+ �_0 t + e! t
�0
(6)
Again, for simplicity let �0 = �_0 = 0. Therefore, if the rover speed is v, its (x; y) position will be: x= x=
Z
t
0
v e!
Z
t
v cos e! � d�
y
=
sin e! t
y
= ev (1 ? cos e! t) (8)
0
v sin e! � d�
(7)
!
The straight traverse value of x = vt = d is again used to determine the position error: ep
= ev
!
q
(e! t ? sin e! t)2 + (1 ? cos e! t)2
(9)
In the extremes of large and small values for time, this result may be approximated as:
!0 : t!1: t
2
� ev! d2 ep � d ep
(10) (11)
where the Taylor series expansion has been used for the rst result. For small distances, the error grows as square of the distance traversed. For intermediate distances, the rate error causes the rover to drift in a circle, and its position error grows precipitously after nt = �=2. For large desired distances, the rover will essentially drive in a circle, not making any signi cant forward progress, and the error becomes equal to the traversal distance. Despite these obvious problems, angular rate sensors have been used successfully for short traverses with the JPL microrovers Rocky 3, in the laboratory, and Sojourner, on Mars5 . To better appreciate Rocky 7 desert test performance, it can be directly compared with data obtained previously in experiments with Rocky 3, and new data from Sojourner on Mars [14, 3]. Table 2 shows the results for traverses performed by all three rovers. Not only did Sojourner have very short average traverse lengths, but its commanded traversals varied greatly from one day of the mission to the next. In contrast, Rocky 3 was consistently commanded to go a xed distance in a laboratory setting. Both rovers drove in terrain that was mostly \Mars nominal" (i.e. terrain with a rock density average for the Martian surface) [16]. The relative heading error for Sojourner is much larger than Rocky 3, as expected by its slow speed. However, it is interesting to note that when vehicle speed is taken 5
Both used the same sensor: model QRS-11 from Systron Donner.
Heading Sensor Total Odometry (d) Average Traverse Number of Traverses Speed of Moves (v) Rel Heading Error (e! =v) Rate Heading Error (e! ) Abs Heading Error (e� ) Rel Position Error (ep =d)
Units
R7 sun m 395 m 132 3 m/s 0.12 mrad/m (0.4) mrad/s | mrad 60 % 6
Soj rate 98 2.1 46 0.01 16 0.16 (105) |
R3 rate 335 8.4 38 0.15 5 0.75 (83) |
Table 2: Comparison of traverse performance numbers for
Rocky 7 using a a sun sensor, and Sojourner and Rocky 3 which use a angular rate sensor. into consideration, the rate of heading error is much less for Sojourner. This improvement is either due to its ight approved electronics, or the reduced vibration noise of low speed travel under low gravity. The parameter values for heading error of Sojourner and Rocky 3 have been extracted from the position errors shown in Figures 6(b) and (c). The large variance in the data indicates the noisy quality of rate sensing. Both plots may be compared with Rocky 7's performance shown in Figure 6(a). Rocky 7 and 3 results include intermediate position errors, whereas only end of traverse error is provided for Sojourner. To verify that Rocky 7 error is linear with distance, a quadratic t was made to the data shown in Figure 6(a). The linearity of the data is con rmed by the small Relative Heading Error, provided in parenthesis in Table 2, which is an order of magnitude less than that for Rocky 3 and Sojourner. Without an obvious connection to vehicle speed, this term has not been normalized as a Rate of Heading Error. The use of a quadratic t actually reduces the size of the Absolute Heading Error to 42 mrad. Conversely, the quadratic t to the Sojourner and Rocky 3 data has a substantial linear term, which is provided in Table 2 with parentheses, under Absolute Heading Error. The cause of this term is unknown, but is probably be due to slippage. This linear term for the rate sensor is alone as large as the sun sensor error. The addition of the the quadratic term makes it very clear that use of the angular rate sensor is unsuitable for long range traversing.
6 Improvements Even with the improvements provided by sun sensing, plans for ten kilometer traverse missions across Mars indicate the need to provide even better position estimation. Such information is valuable for scienti c understanding of surface features, correlation of ground images with orbital or descent images, and precision-landing rendezvous with the rover for sample return. Several e�orts are underway to improve position estimation of the rover. First, improved calibration of the sun sensor will be accomplished along with the use of a more precise optics model. Second, terrain features and topology will be tracked at multiple resolutions to visually estimate changes in rover position and orientation. Third, improved
odometry estimation will result from improved path planning that reduces the total distance traveled and restricts it to the best terrain for driving. Fourth, local terrain will be monitored with the attitude and rocker bogey sensors to compensate for topological e�ects. Finally, the results of all techniques will be statistically combined on-board the rover [9].
7 Summary This paper has presented the results of development and testing of the next-generation rover prototype, Rocky 7. This rover has been created speci cally to validate the mission concept of long range navigation across Mars. To this end the rover was given the ability to provide panoramic images to remote operators, from which navigation targets are selected and provided back to the rover. Key to Rocky 7's ability to successfully navigate to these sites, is precise on-board position estimation (6% relative error) based on sun sensing for heading measurement. Desert eld trials of the rover have validated this operational technique and shown signi cant improvements over previous direction sensing schemes.
8 Acknowledgments The research described in this paper was carried out by the Jet Propulsion Laboratory, California Institute of Technology, under a contract with the National Aeronautics and Space Administration. Reference herein to any speci c commercial product, process, or service by trade name, trademark, manufacturer, or otherwise, does not constitute or imply its endorsement by the United States Government or the Jet Propulsion Laboratory, California Institute of Technology. In the large experimental systems discussed in this paper there are many individuals contributing. Ground truth data was collected by Curt Niebur and Judd Bowman of Washington University. Data processing within the SPICE system was performed by Boris Semenov. Rocky 7 telemetry data was captured by Steve Peters. All operations and path speci cation was performed by Greg Tharp and Ray Arvidson. In addition, the rest of the Rocky 7 development and eld test team include: Tim Ohm, J. (Bob) Balaram, Robert Ivlev, Samad Hayati, Paul Backes, Richard Petras, Sharon Laubach, and Alejandro Martin-Alvarez. Sojourner performance data was obtained by the Mars Path nder ight team, and compiled by Tam Nguyen. Rocky 3 test data was obtained by Reid Harrison and provided by Larry Matthies.
References
[1] C. Acton. Ancillary Data Services of NASA's Navigation and Ancillary Information Facility. Planetary and Space Science, 44(1):65{70, 1996. [2] R. Arvidson et al. Rocky 7 Prototype Mars Rover Field Geology Experiments: 1. Lavic Lake and Sunshine Flow Volcanic Field, California. Journal of Geophysical Research { Planets, 103(E10):22671{22688, 1998.
[3] Wilcox B. and T. Nguyen. Sojourner on Mars and Lessons Learned for Future Planetary Rovers. In Proceedings of the Society of Automotive Engineers, 28th International Conference on Environmental Systems (ICES), Danvers Massachusetts, July 13-16 1998. [4] P. Backes, K. Tso, and G. Tharp. Mars Path nder Mission Internet-Based Operation Using WITS. In IEEE International Conference on Robotics and Automation, Leuven, Belgium, May 1998. [5] D. Bickler. A New Family of JPL Planetary Surface Vehicles. In Missions, Technologies, and Design of Planetary Mobile Vehicles, pages 301{306, Toulouse, France, September 28-30 1992. [6] R. Brooks. A Robust Layered Control System for a Mobile Robot. IEEE Journal on Robotics and Automation, 2(1), March 1986. [7] F. Cozman and E. Krotkov. Robot Localization Using a Computer Vision Sextant. In IEEE International Conference on Robotics and Automation, Nice, France, May 1995. [8] F. Cozman and E. Krotkov. Automatic Mountain Detection and Pose Estimation for Teleoperation of Lunar Rovers. In IEEE International Conference on Robotics and Automation, Albuquerque, NM, April 1997. [9] H. F. Durrant-Whyte. Consistent Integration and Propagation of Disparate Sensor Observations. In IEEE International Conference on Robotics and Automation, pages 1464{1469, April 1986. [10] J. Fraden. AIP Handbook of Modern Sensors: Physics, Designs, and Applications. American Institue of Physics, New York, 1993. [11] E. Gat et al. Behavior Control for Robotic Exploration of Planetary Surfaces. IEEE Transactions on Robotics and Automation, 10(4):490{503, 1994. [12] J. Matijevic et al. Characterization of the Martian Surface Deposits by the Mars Path nder Rover, Sojourner. Science, 278:1765{1768, December 5 1997. [13] J. Matijevic et al. The Path nder Microrover. Journal of Geophysical Research, 102(E2):3989{4001, 1997. [14] L. Matthies, E. Gat, R. Harrison, B. Wilcox, R. Volpe, and T. Litwin. Mars Microrover Navigation: Performance Evaluation and Enhancement. Autonomous Robots Journal, Special Issue on Autonomous Vehicle for Planetary Exploration, 2(4), 1995. [15] L. Matthies and P. Grandjean. Stochastic Performance Modeling and Evaluation of Obstacle Detectability with Imaging Range Sensors. IEEE Transactions on Robotics and Automation, 10(6):783{791, December 1994. [16] H. Moore and B. Jakosky. Viking landing sites, remote-sensing observations, and physical properties of Martian surface materials. Icarus, 81:164{184, 1989. [17] S. Price et al. Microrover Sensor Suite Design. Phase II Final Report 959855, Lockheed Martin Astronautics, Denver, CO, June 27 1996. [18] R. Volpe. Sun Sensor Heading Estimation for Mars Rover Navigation. JPL Internal Memorandum, June 1998. [19] R. Volpe, J. Balaram, T. Ohm, and R. Ivlev. The Rocky 7 Mars Rover Prototype. In IEEE/RSJ International Conference on Robots and Systems (IROS), Osaka, Japan, November 4-8 1996. [20] R. Volpe et al. A Prototype Manipulation System for Mars Rover Science Operations. In IEEE/RSJ International Conference on Robots and Systems (IROS), Grenoble, France, September 7-11 1997. [21] R. Volpe et al. Rocky 7: A Next Generation Mars Rover Prototype. Journal of Advanced Robotics, 11(4):341{358, 1997. [22] R. Volpe et al. Mobile Robot Manipulators for Mars Science. Space Technlogy Journal, 17(3/4):219{229, 1998. [23] J. Wertz (editor). Spacecraft Attitude Determination and Control. Reidel Publishing, 1980. [24] W. Whittaker, D. Bapna, M. Maimone, and E. Rollins. Atacama Desert Trek: A Planetary Analog Field Experiment. In Proceedings of i-SAIRAS Conference, Tokyo Japan, July 1997.