MATERIAL CHARACTERIZATION USING HERTZIAN POINT CONTACT. TRANSDUCERS. Sample. F. Levent Degertekin, Jun Pei and B. T. Khuri-Yakub.
MATERIAL CHARACTERIZATION USING HERTZIAN POINT CONTACT TRANSDUCERS
F. Levent Degertekin, Jun Pei and B. T. Khuri-Yakub E. L. Ginzton Laboratory Stanford University Stanford, CA 94305,
ABSTRACT Non-destructive Hertzian contacts are used to couple ultrasonic waves for characterization and defect detection in anisotropic solid pates. Spring loaded quartz rods bonded to PZT-5H transducers are used to form a point source - point receiver pair and ultrasonic plate modes are excited and detected around 200 KHz with 50 dB signal to ratio at the receiving end. Measurements are performed on silicon wafers and various graphite-epoxy composite plates. The direction dependence and dispersion curves of the zeroth order antisymmetric Lamb wave are measured and excellent agreement with theoretical calculations is observed.
Transducer housing
INTRODUCTION Point source - point receiver techniques are widely used in ultrasonic bulk material characterization [I, 21. Laser pulses or pencil lead fracture are used for short acoustic pulse generation in a sample. Signals are received using capacitive or piezoelectric transducers with very small dimensions as compared to the wavelength of the generated acoustic wave. Ultrasonic plate modes are most often excited by mode conversion of an incident longitudinal wave in water [ 3 ] . Acoustic waves can also be coupled to a solid medium through an elastic solid-solid contact, which is called the Hertzian contact. Knowing the elastic properties and the radii of curvature of the two media, the shape and dimensions of the contact can be determined [4]. By designing the geometry of the active solid properly, acoustic energy can be efficiently coupled to another medium through the contact acting as a point source. This technique is not destructive, as may be in case of laser ultrasound generation, since the contact is elastic and temporary. It does not require any coupling medium and can operate in vacuum and clean environments. It requires no modification on the sample for detection in contrast to the case of direct piezoelectric transducer bonding. Also the efficiency of coupling is very high. In this paper, we report the use of Hertzian contact transducers in characterizing the elastic properties of anisotropic crystal and composite plates. We present experimental results for Lamb wave anisotropy and dispersion along with theoretical calculations. Experimental results related to defect detection in composite plates are also reported. TRANSDUCERS AND EXPERIMENTAL PROCEDURE A quartz rod is used as the solid acoustic energy coupling medium. A PZT-5H transducer with 3 mm diameter and 5 mm thickness is bonded to a quartz rod with
1051-0117/93/0000-0297 $4.00 0 1993 IEEE
Sample
I
Tilt & Rotation Stage
I
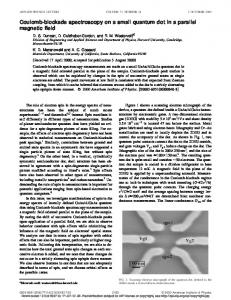
Figure 1 . The experimental setup used for measurements. same diameter and 14.7 cm length. The transducer has a 40 % fractional bandwidth around 200 KHz. The acoustic signal generated by the PZT transducer excites an extentional wave mode in the quartz rod. Acoustic energy in this mode is coupled to the sample through the Hertzian contact formed at the other end of the quartz rod, which is conically shaped and has a tip rounded with a radius of 100 pm. This geometry insures a repeatable shape for the Hertzian contact formed at the quartz tip - sample interface. With the assumption that the local radius of curvature of the sample is large, the contact shape can be estimated as a circle with radius of 15 pm for a silicon sample and 1 N pressing force. Two identical transducers are brought in contact with the same face of the samples to be used as transmitter and receiver. Since the contact area is very small as compared to the wavelength of the acoustic waves, which is larger than 4 mm in the bandwidth of the system, the contacts can safely be considered as point source - point receiver pair. The experimental setup used for the measurements is shown in Fig. 1 . The PZT transducer is placed in an aluminum housing filled with RTV for easy handling. The quartz rods are pressed against the samples by the springs placed on the side the housing. The force on the quartz rods is controlled by the micrometer to have a repeatable Hertzian contact. One of the transducers is attached to another micrometer which enables accurate motion in the lateral direction. The samples are placed on a holder which sits on a tilt and rotation stage.
1993 ULTRASONICS SYMPOSIUM
- 297
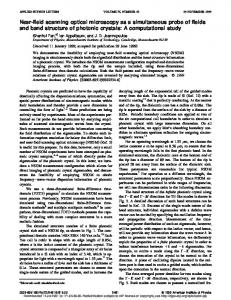
With this configuration, only the zeroth order antisymmetric Lamb wave is excited in the samples examined, since the frequency was lower than the cut-off frequency of the higher order Lamb wave modes. Only the zeroth order symmetric has a zero cut-off frequency, yet it is not excited due to the antisymmetric nature of acoustic wave excitation. Two methods are used to obtain the direction dependent phase velocity of the acoustic waves. To get both the dispersion curve and phase velocity in a propagation direction, the transmitter is excited with a 130 V negative short pulse and the received waveform is digitized and stored at two different receiver locations in the same direction. Fig. 2 shows typical received waveforms for propagation in direction of a 0.28 mm thick (100) silicon wafer. The distance between the transmitter and receiver is 2.54 c m and receiver is moved 1.25 mm in the same direction.. With silicon wafers, the signal to noise ratio is better than 50 dBs. The frequency dependent phase velocity is then calculated as
where A d is the distance between the two receiver locations and A @ ( Q is the absolute value of the phase difference between the FFT of the waveforms at frequency f .
frequency. For accurate distance measurements, the indentations of the tips on a soft prebaked photoresist coated wafer are examined under optical microscope. To obtain anisotropy data, the sample is rotated to change direction of the measurement, and the procedure is repeated. RESULTS AND DISCUSSION The material characterization ability of the Hertzian point contact method is tested on various samples. In order to compare experimental results with theory, a computer program calculating Lamb wave propagation characteristics for general anisotropic plates is written and verified with published results. Silicon is chosen as a test material because of its well characterized properties and availaqility with nearly perfect crystal structure. The anisotropy data obtained for a 0.28 mm thick double side polished silicon plate is shown in Fig. 3 and compared with the calculations. The frequency is 200 KHz, and the transducer is excited with 10 cycle tone burst. The four fold symmetry in this plane is clearly seen and the agreement with the calculations is excellent. The deviation of data from the calculated values is less than 0.2 % showing the accuracy of the method.
930
-
9
4
916
3
-$ 903 s H g
889
-6 -8 0
5
10
15
20
25
30
35
40
Time (usec) Figure 2 . The received waveforms for Lamb wave propagation in direction in (100) silicon plate at two different locations. Solid line d=dl=2.54 cm, dashed line d=d1+1.25 trim. Variation in time delay is also used to measurethe phase velocity. In this case, the transducer is excited with aa 8 0 V tone burst of 10. The number of cycles used was limited by the length of the quartz rod. The round trip time in the rod was 53 psec limiting the number of cycles at 200 KHz to 10. The distance between the transmitter and receiver is kept small to prevent interference from the edges of the samples and to reduce the effect of attenuation especially in composite plates. Typical values are 2.3 cm for distance and 15 psec for time delay. The time delay is measured as follows: A particular zero crossing in the echo signal reflected from the tip of the transmitting quartz rod is used to start a high accuracy time interval counter, which has a time interval measurement accuracy of 0.5 nsec. The counter is stopped with another zero transition in the received signal. By tracking the particular zero crossing in the received signal at two locations and taking the time difference, we calculate the phase velocity at the given
298 - 1993 ULTRASONICS SYMPOSIUM
875' ' 0
'
'
"
'
'
"
"
'
90 180 270 Angle from X-axis (degree)
"
'
I 360
Figure 3. Phase velocity of Lamb wave in 0 28 mm thick (100) silicon wafer at 200 KHz. Solid line calculation, circles experimental data. The dispersion curve of silicon plates are also obtained by pulse excitation and using Fourier transform technique. The accuracy of this method critically depends on the phase errors resulting from the jitter in the digitizer, and on the SNR. These facts limit the frequency range of reliable data to the 3 dB bandwidth of the system. In Fig. 4, the dispersion curves in the and directions of the same silicon plate are depicted. Experimental data is very close to the calculation particularly around the resonance frequency of the transducer. The method can be used as a fast way of obtaining the dispersion curve of a particular plate mode. As an application of the method, the Lamb wave propagation characteristics of fiber reinforced composite plates are also investigated. The uniaxial composite sample was made by stacking 12 plies of T300/976 graphite/epoxy material. The density and thickness of the plate are measured as 1510 kg/m3 and 1.7 mm, respectively.
CONCLUSION
2
2
The Hertzian point contact transducers can be used to excite and detect acoustic waves in solid media very efficiently. The high signal to noise ratio provided by the technique enables accurate measurement of phase velocity of plate wave modes. This information can be used for determination of physical material properties by proper inversion algorithms [6]. The technique has many advantages in that it is nondestructive, very efficient, and does not necessitate coupling medium or modification on the samples. Although low frequency, narrow bandwidth applications are presented in this study, high frequency, realizations are possible with proper designs. Also, using a circular array of these transducers, tomographic imaging of velocity, hence defects and elastic constants can be realized
lo00
950
-Calc clooZ 140
160
180
200 220 240 Frequency (KHz)
260
280
Figure 4. The experimental data and calculated dispersion curves for the silicon sample. Although the composite is very lossy as compared to the silicon sample, signal to noise level has been measured as 40.3 dB in the most attenuating direction. Averaging is used to overcome this problem and enhance the accuracy of the measurements. For theoretical calculations, the transverse isotropy assumption is used with 5 independent elastic constants. The measured and calculated angular dependence of Lamb wave velocity at 200 KHz is depicted in Fig. 5. The calculated curve is obtained by adjusting some of the elastic parameters in their tolerance range [5]. Although the measured values agree very well in the direction along and perpendicular to the fiber axis, there is a significant difference in some other directions. To further confirm the measured values, the experiment is repeated on a different region of the sample and the new measurement s also plotted in Fig. 5. It is clearly seen that the measured data is very consistent and repeatable considering the non uniform surface conditions of the composite plate. The results suggest that a different theoretical model should be used to predict the anisotropy in this matenal 1600
1500
ja
1100
VI.
ACKNOWLEDGMENT
This work was supported by ARPA under Contract No. N00014-90-5-4016 and the Air Force MMST Program under a USAF subcontract (Texas Instruments). One of the authors (F. L. D.) acknowledges support from the Scientific and Technical Research Council of Turkey. Dr. F. Chang is thanked for providing the uniaxial composite sample.
REFERENCES 1. K. Y. Kim, W. Sachse and A. G. Every, " On the determination of sound speeds in cubic crystals and isotropic materials using a broadband ultrasonic pointsourcelpoint-receiver method", J. Acoust. Soc. Am., 93, March 1993, pp. 1393-1406. 2. C. Corbel, F. Guillois, D. Royer. M. Fink and R. De Mol, "Experimental study of anisotropic and dispersive effects on carbon-epoxy composite using laser ultrasound", Proceedins of I992 IEEE Ultrasonics Symposium, pp. 810-804. 3. A. Nayfeh and D. E. Chimenti, "Propagation of guided waves in fluid-coupled plates of fiber-reinforced composite", J. Acoust. Soc. Am., 83, May 1988, pp. 17361743. 4. L. D. Landau and Lifshitz, Theory of Elasticity, Pergamon Press, 1959, pp. 35-36. 5. The stiffness constants used for the uniaxial composite: c,, =141.85 , c,,=4.38 , c,,=10.72, c,,=4.37, cS = 5.38, all GPa. 6. M. R. Karim, A. K. Mal and Y. Bar-Cohen. "Inversion of leaky Lamb wave data by simplex algorithm", J. Acousr. Soc. Am., 88, July 1990, pp. 482-491. 7. F. L. Degertekin, J. Pei, B.T. Khuri-Yakub and K. C. Saraswat, " In-situ acoustic temperature tomography of semiconductor wafers", Appl. Phys. Lett., submitted for publication
1 0
90 180 270 Angle from fiber direction (degree)
360
Figure 5. Measured and calculated phase velocity variation with direction of propagation. Circles and triangles are measured data in two different locations, solid line is the calculation.
1993 ULTRASONICS SYMPOSIUM - 299