shearing for a three-dimensional analysis. Material properties as in Table 1. Investigating this issue further, another set of solu- tions using finite element limit ...
Computer Methods and Recent Advances in Geomechanics – Oka, Murakami, Uzuoka & Kimoto (Eds.) © 2015 Taylor & Francis Group, London, ISBN 978-1-138-00148-0
Material point method simulation of triaxial shear tests W.T. Sołowski Department of Civil and Environmental Engineering, Aalto University, Finland,1
S.W. Sloan ARC Centre of Excellence for Geotechnical Science and Engineering, Faculty of Engineering and Built Environment, University of Newcastle, Australia
D. Wang ARC Centre of Excellence for Geotechnical Science and Engineering, Centre for Offshore Foundation Systems, The University of Western Australia, Australia
ABSTRACT: The paper presents a number of numerical simulations of triaxial shear tests. The simulations have been made with the Generalised Interpolation Material Point method (GIMP, Bardenhagen & Kober 2004), which allows for modelling of large displacements, such as those occurring in shear bands. The simulations are assessed qualitatively and compared with available numerical results. Unconstrained compression tests on unsaturated soil specimens are also simulated. In all the analyses, the Mohr-Coulomb model, extended into the unsaturated regime, was used. The paper is part of a joint research program in the Centre for Geotechnical Science and Engineering which aims to assess and to validate the material point method for engineering purposes.
1
INTRODUCTION
Numerical simulation of shear-banding and triaxial tests has been a lively research field. These have been attempted using the discrete element method (DEM) (e.g. Li et al. 2006, Winduliñski et al. 2009, Lee et al. 2012, Kim et al. 2013) as well as with finite elements (e.g. Tejchman & Górski 2010). The paper aims to assess whether the material point method may be used for the simulation of tri-axial shear tests. It initially validates the material point method by applying it to a problem with a known solution. Later, an extended Mohr-Coulomb model, which includes an increase in shear resistance due to suction, is used to replicate the unconstrained shearing tests performed by Colmenares (1997). The paper extends the investigation of the material point method summarised in Sołowski & Sloan (under review). 1.1
Material Point Method
The material point method is a new numerical method which natively handles contact and large deformations. The method is a continuous method, similar to the finite element method or finite difference method. However, in the material point method, instead of elements one deals with material points, which carry 1
all the information required for the analysis (physical quantities like mass, momentum, stress and parameters required by the constitutive model). In every time-step, the material points pass the necessary information to the computational grid (which is most often held constant during the calculations). The time step data is resolved on the grid and passed back to the material points. The material points positions, momenta, stresses and internal variables are then updated and the time advances. The material point method originates from the FLIP method (Brackbill & Ruppel 1986) and was first proposed by Sulsky et al. (1994, 1995). The original version of the method suffered from a number of drawbacks. In particular, when the deformations were too large, the material points may lose contact with each other. The occurrence of this effect is heavily dependent on the underlying density of the grid. The first major improvement was made when the Generalized Interpolation Material Point Method (GIMP) was proposed (Bardenhagen & Kober 2004). GIMP is the version of material point method used in all the calculations in this paper. Although other potentially better material point schemes exist (e.g. Sadeghirad et al. 2011, 2013), their implementations in numerical codes needs further improvement before they can be widely adopted.
Formerly University of Newcastle, Australia
169
Figure 1. Initial two-dimensional sample (left) and sample after shearing. Displacements of material points shown.
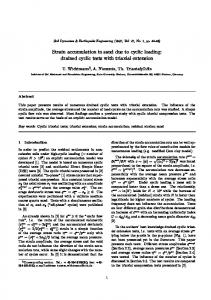
Figure 3. Velocities of material points at final stages of shearing for a three-dimensional analysis. Material properties as in Table 1.
Figure 2. Material point method results compared to results in Kardanie et al. (2012) and limit analysis.
Investigating this issue further, another set of solutions using finite element limit analysis was obtained (note that the approximate limit analysis solution, which takes into account a non-associated flow rule using the approach of Davis (1968), is almost the same as the solution for the associated case for the parameters chosen). The limit analysis solution agrees well with that from the material point method. The reason for the discrepancy between the results published by Kardani et al. (2012) and the other results is not yet fully understood.
2 VERIFICATION OF THE SIMULATION AGAINST AVAILABLE DATA 2.2 Three-dimensional tests The initial task was to find out whether the GIMP is a useful tool for simulating triaxial shearing. To verify the method, an example with an accurate known solution was chosen (Kardani et al. 2012). 2.1 Two-dimensional tests The bi-axial shear test was performed on a 2:1 (height:width) slice of Mohr-Coulomb material (Kardani et al. 2012). The location of the shear band was enforced by introducing a small triangle of slightly weaker material, exactly replicating the Kardani et al. (2012) plane strain simulation (see Table 1 for the material properties). The material point simulation used 80,000 points, with 4 material points allocated to each grid cell (see Fig 1). Surprisingly, the material point method yielded a quite different forcedisplacement curve and limit load to the finite element results of Kardani et al. 2012 (see Figure 2).
The results from three-dimensional material point simulations (where the force was applied via a slightly oversized rigid plate with frictionless contact) were also compared to the limit analysis solutions (see Fig. 2 and Fig. 3 for a sheared sample). The solution for the selected model parameters is virtually the same as in the two-dimensional case. The analysis confirmed that, in the case of the Mohr-Coulomb constitutive model for the parameters used, the two-dimensional simulation approximates the three-dimensional case rather well.
2.3 Summary of the verification tests The results shown suggest that the material point method is well suited for the simulation of triaxial tests. The ability to natively model large displacements, without the need for remeshing, appears to give
170
Table 1.
Mohr-Coulomb material properties.
Table 2. Simplified van Genuchten water retention curve parameters.
Young Modulus Poisson Cohesion E ratio* c Material [kPa] ν [kPa]
Friction angle φ [deg]
Dilation angle ψ [deg]
Stronger 1,000 Weaker 1,000
10◦ 10◦
5◦ 5◦
0.3 0.3
5.5 5.0
m
n
α [kPa−1 ]
0.531235
1.760144
0.001479
* Not given in Kardani et al. (2012).
this method an edge over the classical finite element approach for this case. 3
SIMULATIONS OF UNCONSTRAINED SHEAR TESTS FOR UNSATURATED SOIL SAMPLES
The primary assumption made here is that the water phase in the unsaturated soil sample is not continuous, so the suction can be different at different points of the sample. Furthermore, it has been assumed that the rate of shearing is quick, so the water transport within the soil sample is small. The updated degree of saturation was computed as:
Figure 4. Approximate water retention curve based on the laboratory data from Cunningham (2000). van Genuchten parameters are given in Table 2.
where the previous degree of saturation Sr , the previous specific volume v and the updated specific volume vnew are known, and the unknowns are the fraction volume of water Vw , the fraction volume of air Va at the updated specific volume vnew and the updated degree of saturation Sr,new . This way of computing suction allows for some water transport within the sample due to the way Va is computed (i.e. using the degree of saturation from the previous time-step) which lowers the air volume and thus reduces the degree of saturation somewhat. The degree of saturation Sr can be linked to the change of suction via the water retention curve. Finally, the change of suction can be linked to the shear strength via the extended Mohr-Coulomb equation (Fredlund & Rahardjo 1993):
where σ is the total stress, s denotes matrix suction, and φb is the friction angle relative to matrix suction. The water retention was predicted using the simplified van Genuchten (1980) model, which does not
account for differences of the retention behaviour upon drying and wetting and directly links suction and the degree of saturation according to:
where α, m and n are model parameters. These parameters were chosen using a least squares procedure based on number of laboratory tests reported by Cunningham (2000), see Fig. 4. The van Genuchten parameters used in all subsequent calculations are given in Table 2. During the calculations, the suction friction angle was assumed to be 14◦ . Before calling the stress integration algorithm, the unsaturated capability was introduced by calculating the cohesion c� for the current value of suction using the relation:
As the stress integration algorithm is implicit (following the work of Clausen et al. 2006, 2007), such an increase fits into its framework without any alteration.
171
Table 3.
Mohr-Coulomb material properties.
Bulk modulus K [MPa]
Shear Friction modulus Cohesion angle G c φ [MPa] [kPa] [deg]
Dilation angle ψ [deg]
Suction friction angle φb [deg]
5
2
14
14
3.1
20
31
Table 4.
3.2
Peak deviatoric stress Test
1 2 3 4 5 6 7 8 9 10 11
Simulations of unconstrained unsaturated soil samples shearing with the Mohr-Coulomb model
Based on the results of Cunningham (1997) and Colmenares (2000) (who tested exactly the same soil), the cohesion and friction angle for the Mohr-Coulomb model were set (see Table 3). The bulk modulus value was chosen to be low, mainly because of the very large strains upon shearing (reaching 15%) and the fact that the samples were unconstrained. The parameters given in Table 3 were used to run 11 shearing tests, replicating the laboratory work of Colmenares (1997). All the laboratory tests were made on unconstrained cylindrical samples with a diameter of 38mm and a height of 78 mm. These samples were modelled using the material point method, in two and three dimensions. The two-dimensional sample consisted of 80,000 material points (with 4 points per grid cell), whereas the threedimensional samples were constructed from 105,600 material points with 8 particles per grid cell. The maximum deviatoric stress obtained in the simulations is listed in Table 3 and shown in Fig. 5. The shearing modes change with increases in suction (see Figures 7–10). The shear-banding is well pronounced at low suctions (alongside dilation in the shear-bands leading to an increase in suction), whereas at high suctions the elastic behaviour of the sample is dominant, leading to a barrel-shaped deformed sample at the maximum strain of 15%. In the simulations the shear-band was initiated by introducing a small wedge of weaker material, similar to that shown in Fig. 1. Despite the slightly weaker material, the other shear-band direction competes with the preferred shear-band in the simulation. Simulations of unconstrained unsaturated soil samples shearing with no water transport
Unconfined shearing results.
Initial suction [kPa]
Experiment (Colmenares 1997) [kPa]
Simulation 2D [kPa]
3D [kPa]
3D* [kPa]
20.15 26.57 56.81 68.74 200.75 314.53 527.13 690.3 944.23 1060.7 1127.6
65.92 80.3 109.91 151.79 281 453.27 595.63 640.83 778.95 865.93 925.34
92.4 97.3 123.8 134.1 259.1 372.6 578.3 715.5 890.8 957.5 990.8
93.8 100.0 127.7 137.4 248.9 347.2 530.8 648.4 817.3 879.7 902.6
100.1 100.2 100.2 101.4 199.2 288.4 451.0 562.2 736.5 809.3 847.7
*indicates simulations with no water transport
Figure 5. Peak deviatoric stress in 2D and 3D simulations compared to the experimental data (Colmenares 1997).
The results obtained are given in Figure 6. Despite an early overshoot of the shear strength, the results obtained with no water transport could be possibly improved by increasing the suction friction angle φb slightly.
3.3 Discussion of results
In addition, three-dimensional simulations under the assumption of no water transport have been made. This has been achieved by substituting eq. 2 with:
The Mohr-Coulomb parameters were kept unchanged (see Table 3) with the exception of the dilation angle which was set to zero. The latter was necessary to obtain results without excessive suction in the shear band, which would cause unrealistic shear strengths.
The agreement between the predictions and the laboratory data is good, especially in the case of the three-dimensional analyses. It is interesting to note that the difference between the three-dimensional and two-dimensional plane strain analyses is more substantial than in the earlier simulation. This may be caused by different volume changes in the shearing region, leading to different suction distributions and therefore different final shear strengths. Especially at high suctions, the shear-bands are not fully developed at 15% strain and the sample becomes barrel-shaped. This is in contrast to shearing at low suction, where at the same amount of strain the shear bands are well developed
172
Figure 6. Peak deviatoric stress in 3D simulations compared to the experimental data (Colmenares 1997).
Figure 8. Sample suction at 15% strain. Initial suction 1127.6 kPa.
Figure 7. Sample suction at 15% strain. Initial suction 20.15 kPa.
and significant dilation occurs in them (compare Figs 7–10). Nonetheless, the explanation of the differences between the two- and three-dimensional simulations is speculative, and the phenomenon needs further investigation. It appears that the differences between the predicted peak deviatoric stresses and the experimental values are acceptable. However, the suctions predicted in the shearing zone are too small for low suctions. In the samples with high suctions, the experimental data show that the suction decreases substantially upon shearing whereas the numerical models predict that it either increases marginally or stays constant. Finally, the assumptions regarding water transport need to be revisited and re-evaluated using further calculations. It may be possible to assume that no water transport occurs within the sample during shearing,
Figure 9. Sample suction at 15% strain. Initial suction 20.15 kPa.
provided a constitutive model which can better predict the soil volume changes is used. 4
CONCLUSIONS
Reproducing unconfined shear tests numerically is difficult. The results presented are a first step in this
173
Figure 10. Sample suction at 15% strain. Initial suction 1127.6 kPa.
direction using the material point method, and show that the technique can accommodate large strains. To increase the accuracy of the results, a constitutive model which predicts the soil volume changes better is needed. Also, due to the very high nonlinearity of the tested soil in the elastic region, incorporating non-linear elastic behaviour may improve the quality of the predictions. REFERENCES Bardenhagen S.G., Kober E.M. 2004. The Generalized Interpolation Material Point Method. Computer Modeling in Engineering & Sciences 5:477–495. Brackbill, J.U., Ruppel, H.M. 1986. FLIP: a method for adaptively zoned, particle-in-cell calculations of fluid flows in two dimensions. Journal of Computational Physics 65:314–346. Clausen J., Damkilde L. and Andersen L. 2006. Efficient return algorithms for associated plasticity with multiple yield planes. International Journal of Numerical Methods in Engineering 66:1036–1059. Clausen J., Damkilde L. and Andersen L. 2007. An efficient return algorithm for non-associated plasticity. Computers and Structures 85:1795–1807.
Colmenares, J. 1997 The unconfined shear strength of a reconstituted clay-silt mix, MSc thesis, University of London. Cunningham, M.R. 2000. The mechanical behaviour of a reconstituted, unsaturated soil. PhD thesis, University of London. Davis E.H. 1968. Theories of plasticity and the failure of soil masses, in Soil mechanics: selected topics (Lee Ed.), Elsevier, New York : 341–354. Fredlund D.G., Rahardjo H. 1993. Soil Mechanics for Unsaturated Soils. Wiley & Sons. Kim B.-S., Park S.-W, Kato S. 2013. Distinct element method simulation on deformation mode and stress state for specimen shape in direct shear test. International Journal of Computational Methods 2:1–18. Lee S.J., Hashash Y.M.A., Nezami E.G. Simulation of triaxial compression tests with polyhedral discrete elements. Computers & Geotechnics 43:92–100. Li. X, Chu X., Feng Y.T. 2005. A discrete particle model and numerical modeling of the failure modes of granular materials. Engineering Computations: International Journal for Computer-Aided Engineering and Software 22: 894–920. Sadeghirad A., Brannon R.M., Burghard J. 2011. A convected particle domain interpolation technique to extend applicability of the material point method for problems involving massive deformations. International Journal of Numerical Methods in Engineering 86:1435–1456. Sadeghirad A., Brannon R.M., Guilkey J.E. 2013. Secondorder convected particle domain interpolation (CPDI2) with enrichment for weak discontinuities at material interfaces. International Journal of Numerical Methods in Engineering 95:928–952. Sołowski W.T., Sloan S.W. (under review). Evaluation of material point method for use in geotechnics. Submitted to International Journal of Numerical and Analytical Methods in Geomechanics. Sulsky, D., Chen, Z., Schreyer, H.L. 1994. A particle method for history-dependent materials. Computer Methods in Applied Mechanics and Engineering 118:176–196. Sulsky D., Zhou S.J., Schreyer H.L. 1995. Application of a particle-in-cell method to solid mechanics. Computer Physics Communications 87:236–252. Tejchman, J., Górski, J. 2010. Finite element study of patterns of shear zones in granular bodies during plane strain compression. Acta Geotechnica 5:95–112 van Genuchten, M.T. 1980. A closed-form equation for predicting the hydraulic conductivity of unsaturated soil. Soil Science Society of America Journal 44: 892–898. Widulinski Ł, Kozicki J,Tejchman J. 2009. Numerical simulations of triaxial test with sand using DEM. Arch Hydroeng Environ Mech 56(3–4):149–72.
174