matlab scripts for characterising multiple single-unit ...
Recommend Documents
function y = Tommi(datafiles, nsims,permtype,pa);. %returns #_simulations x 1 or #_simulations x 3 array of data lengths y,. %where the data has been ...
Going Loopy: Writing and Understanding. Batch Scripts and Functions in Matlab.
Jason Taylor. Skills Seminar. 18 November 2008 ...
behavioural driver of HIV, resulting in calls to make partner reduction programming central to an intensiï¬ed HIV ... scripting to discourage multiple and concurrent partnerships is required for ...... California Center for Population Research.
For producing a short video clip on "The Great Transformation". Closing ...
announce a competition for the best script on the topic of the Great
Transformation.
Suppose the first author is sitting at her workstation in the Theory Center, connected to ... calls the MultiMATLAB command ID on each of the processors running.
MATLAB's easy extensibility via packages of m-files known as Toolboxes. ... In many cases the needs for communication between the processors are rather ...
computer vision problems especially with multiple views. The Epipolar ... robot
SLAM is proposed in which the multiple view geometry is used to estimate the ...
mercially available program Sparse Optimal Control Software SOCS [Betts ..... To construct the total vector of NLP decision variables, the process described in.
A particular reusable MATLAB implementation of the algorithm, called GPOPS, is
applied to three classical optimal control prob- lems to demonstrate its utility.
Oct 28, 2008 - e-mail address: [email protected] ... and Hennessy to processes featuring probabilistic as well as nondeterministic choice. They.
In computer-supported collaborative learning (CSCL), the script is reified in the ..... composition (should I mix girls and boys, good and poor learners, â¦), the ... syntactical rules, for instance [task [group]] could mean distributing the task on
linking), leggere e scrivere i MAT-file. 4. Organizzazione del Corso. • Ambiente di
sviluppo. – Introduzione all'ambiente MATLAB, i tool ed il MATLAB desktop.
Professor of Electrical and Telecommunication Engineering Technology. New
York ... Practical MATLAB applications for engineers / Misza Kalechman. p. cm.
message along channel dk, which will in turn received by node unlock. Upon ... Dublin, 2012. http://software.imdea.org/~andrea.cerone/works/thesis.pdf. 3.
Oct 21, 2016 - CHEOPS (CHaracterising ExOPlanet Satellite) is the first ESA Small Mission as part of the ESA Cosmic Vision program 2015-2025 and it is ...
30 stuv wxyz{x|. }~ yz{x|. ÐÐ yz{x|. ÐÐÐÐÐ. wxyÐÐ ~СÐ. }~ yÐÐ ~СÐ. ÐÐ yÐÐ ~СР... the implementation of a cascading delete (Figure 24 and Figure 25). stuv.
Matlab for Numerical Algorithms. Vectors. A vector is a one-dimensional array of
numbers. A row vector is written horizontally; a column vector is written vertically
...
This tutorial has been prepared for the beginners to help them understand ... then it will be very much beneficial and learning MATLAB will be like a fun for you.
Dynamic Cone Penetrometer (DCP) tests. - Light Weight Deflectometer (LWD) measurements. - Deflection measurement through Remote Video Monitoring ...
code is executing, broadcasting and receiving messages; in our example these are m, n and l. Here ... In §3 we recall the theory of composition for networks of [3], upon which we define the testing ...... PhD thesis, Trinity College. Dublin, 2012.
Lawrence MJ Best1, Vishal Rawji2, Stephen P Pereira3, Brian R Davidson1, Kurinchi Selvan ...... Higashi T, Tamaki N, Honda T, Torizuka T, Kimura T,. Inokuma ...
These are notes accompanying a course in matlab for chemistry and ... tures, the
mathematical knowledge necessary to do the matlab exercises, is briefly
reviewed. ..... Recall that the set of all column vectors with n real components
forms a.
Email: [email protected]. Jesús Liceaga-Castro .... transformation, then the closed loop with negative feedback is stable if and only if the ...
matlab scripts for characterising multiple single-unit ...
... Plexon MAP 32-channel system for follow-up/non-recovery anaesthetised studies. ... Analysis of single-unit and LFP data were conducted using NeuroExplorer ... We illustrate some of the scripts the lab developed & applied to our studies on ...
MATLAB SCRIPTS FOR CHARACTERISING MULTIPLE SINGLE-UNIT SPIKE TRAINS: A STUDY OF RAT MEDIAL PREFRONTAL CORTEX & HIPPOCAMPUS Georgina Fenton1,2, Margarita Zachariou3 & Rob Mason1 1School
Neuronal Networks Laboratory
of Life Sciences, University of Nottingham Medical School UK, 2Department of Biology, University of Leicester UK & 3Department of Computer Science, University of Cyprus, Cyprus
INTRODUCTION • During in vivo multi-electrode electrophysiological studies in our laboratory it became evident that a more time efficient process for screening of correlated neural spike train activity Interpretation of multi-electrode electrophysiological data sets require time efficient processing and data visualisation during screening of spike train activity, correlated neural activity between units and characterising Up-Down states. We illustrate some of the scripts the lab developed & applied to our studies on the dynamics of neural ensemble interaction within the medial prefrontal cortical (mPFC) sub-regions and between the mPFC and hippocampus in the rat. Projects using the scripts: Central control of micturition in anaesthetised & awake-behaving rat - Fear conditioning - Epilepsy - Auditory sensory gating - VTA-mPFC ; Hpc-mPFC; mPFC-thalamus neural interactions • The data illustrated is an 16-channel MEA in mPFC (channels 1-8 “superficial mPFC”; channels 9-16 “deep mPFC”) before (BASAL) and following local intracortical administration of GABAA receptor antagonist GABAzine
METHODS Lister-hooded rats (male, 300-400g; n = 6) were anaesthetised with isoflurane (50%N2O:50%O2) and 8-channel microelectrode arrays (MEAs) implanted in the VTA; hippocampus and/or mPFC (cingulate gyrus & prelimbic areas) and hippocampus. Multiple single-unit and local field potentials (LFPs) were recorded simultaneously. All experiments were performed in accordance with the Animals (Scientific Procedures) Act 1986 UK and subject to local ethical review. ELECTROPHYSIOLOGY: • Single-unit & LFP activity were monitored using either a (i) Plexon Recorder 16-channel system with a synchronised Plexon CinePlex video recording system to image micturition behaviour or (ii) Plexon MAP 32-channel system for follow-up/non-recovery anaesthetised studies. DATA ANALYSIS: • Only data from animals with confirmed electrode placements in mPFC, VTA or hippocampus were analysed. Single-units were sorted using both automatic and manual sorting techniques in Offline Sorter (Plexon Inc.) – threshold + TM sorting algorithms. • Analysis of single-unit and LFP data were conducted using NeuroExplorer (www.neuroexplorer.com) and customised MATLAB scripts - PDC analysis [6] to evaluate directionality between the mPFC and thalamus. Raw data (Plexon MAP / Recorder system) *.plx file →
Firing rate statistics were calculated with firing rate histograms with 1-min bins normalized to a user-defined mean baseline firing of individual units. Z-score normalization was used to allow comparison across the unit populations (single or group experiments) with various firing rates. K-means cluster and hierarchical cluster analysis were used to detect any predominant patterns of responses to drug-treatment or stimulus-evoked events. To aid user identification, computed clusters were visualised with silhouette verification & 3-D principal component analysis and the sorted multiple unit recordings displayed as colour-coded spike rastergrams (z-axis colour proportional to firing rate). Plots allow users to visualise & compare spike train neural activity changes induced by behavioural- or drug-induced events.
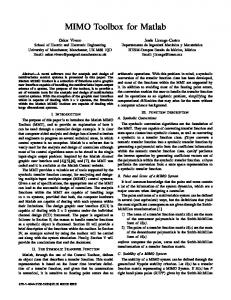
x-Correlation Grid analysis script: • • • •
The first script centres on graphical visualisation and evaluation of cross-correlation histograms (CCHs) of multiple unit-pairs from a recorded population, the resultant grid displaying reference (y-axis) vs. target (x-axis) units, with the z-axis colour proportional to the degree of correlation. Correlated activity was computed in 1ms bins for user-defined lag times (e.g. ±100, 500 or 1000ms). The mean ± SD of uncorrelated activity was computed from the (user-defined, e.g. ± 30, 100 or 200ms) “outer uncorrelated shoulders” of the correlogram. Computed correlogram parameters include - Correlation Strength (K)-index, i.e. peak (or trough) count/arithmetic mean (shoulder) count, and the half-peak width (PW50)-index. A mouse-click on an individual grid pixel produces a conventional cross-correlogram (CCH) figure with descriptional statistics for that given unit-pair. Peak Z-score
mPFC (sig 0108)
Reference Unit
0-300s
300-1800s
Correlation Strength (K)-index
half-peak width
+
half-peak width (PW50)-index
Confidence limits (95%)
Hpc (sig 0916)
mouse cursor “click” generates CCH
Target Units
Synchrony Index • Script computes / plots synchrony within user-assigned population(s) of recorded single-units – computed over successive 1s epochs (left panel) & 2s epochs (right panel):
Average Synchrony Indices - green = mPFC superficial mean SI = 0.237 - blue = mPFC deep mean SI = 0.34
mPFC superficial unit raster plots
mPFC deep layers
Lab References: Lab web site:
Coomber et al (2009) Synapse 62: 746-755; Dissanayake et al (2009) Brain Research 1298: 153-160; Taxidis et al (2010) Biol. Cybernetics 102 (4): 327-340; Fenton et al (2013) Neuroscience 233: 146-156