Azura Che Soh et. al. / (IJCSE) International Journal on Computer Science and Engineering Vol. 02, No. 04, 2010, 924-933
MATLAB Simulation of Fuzzy Traffic Controller for Multilane Isolated Intersection Azura Che Soh/Lai Guan Rhung
Haslina Md. Sarkan
Department Electrical & Electronic Engineering Universiti Putra Malaysia (UPM) Serdang Selangor, Malaysia
[email protected]
Advanced Informatics School UTM International Campus Jalan Semarak, Kuala Lumpur
[email protected]
Abstract—This paper presents a MATLAB simulation of fuzzy traffic controller for controlling traffic flow at multilane isolated signalized intersection. The controller is developed based on the waiting time and vehicles queue length at current green phase, and vehicles queue lengths at the other phases. For control strategy, the controller controls the traffic light timings and phase sequence to ensure smooth flow of traffic with minimal waiting time, queue length and delay time. In this research, the isolated intersection model used consists of two lanes in each approach. Each approach has two different values of vehicles queue length and waiting time, respectively, at the intersection. The maximum values of vehicles queue length and waiting times are selected as the inputs to controller for optimized control of traffic flows at the intersection. A traffic model and fuzzy traffic controller are developed to evaluate the performance of traffic controllers under different conditions. In the end, by comparing the experimental result obtained by the vehicle-actuated controller (VAC) and fuzzy traffic controller (FTC) which improves significant performance for intersections, we confirmed the efficiency of our intelligent controller based fuzzy inference system. Keywords-Fuzzy Traffic Controller; Intersection; Vehicle-actuated Controller.
I.
Multilane;
Isolated
INTRODUCTION
Traditional controllers, which are built based on historical data to create optimized timing plans, are no longer the ideal solution to traffic intersections due to fluctuating traffic volumes and the ever increasing number of vehicles on the road. Traffic controllers that are able to think like the way of human thinking are designed using Artificial Intelligence (AI) techniques such as fuzzy logic. The main aim of designing AI traffic controllers is that the traffic controllers have the ability to adapt to the real time data from detectors to perform constant optimizations on the signal timing plan for intersections in a network in order to reduce traffic congestions, which is the main concern in traffic flows control nowadays, at traffic intersections.
ISSN : 0975-3397
Human decision making and reasoning in traffic and transportation are characterized by a generally good performance. Even if the decision makers have incomplete information, and key decision attributes are imprecisely or ambiguously specified, or not specified at all, and the decisionmaking objectives are unclear, the efficiency of human decision making is unprecedented. According to [1], traffic intersections that are managed by human operators are still more effective as compared to the traffic responsive control and traditional methods. Niittymäki [2] has modeled the control principles and rules for controlling the traffic flow based on the actions of an experienced policeman represented by knowledge of an experienced signal control planner. This is because the human operator is capable of handling different flow patterns at the intersection and also unusual road situations, such as traffic accidents The first implementation of fuzzy logic controller in the literature appeared in 1977, which shows better performance compared to vehicle actuated controller for a very simplified intersection having two one-way streets based on a simple green time extension principle [3]. From this motivation, the main focus for the research has been on application for fuzzy control method for intersection control particularly aimed at an isolated intersection. However, the reviewed research either involved only through movement or with no turning movements [3]-[7]. The use of fuzzy logic controllers in comparison with traditional pre-timed or vehicle-actuated control modes has provided better traffic operations according to the usually adopted performance measures as in the case with delays and number of stops. Fuzzy controllers have proven effective in controlling a single traffic intersection, even when the intersection is somewhat complex. In certain instances, however, even if local controllers perform well, there is clearly no guarantee that they will continue to do so when the intersections are coupled with irregular traffic flow. Later, further development took place by adopting fuzzy logic based on traffic signal control for two-way single intersection without turning vehicles, single intersection with all possible movements, multiple intersections, phase sequence and time determination, congested intersection and network, etc.
924
Azura Che Soh et. al. / (IJCSE) International Journal on Computer Science and Engineering Vol. 02, No. 04, 2010, 924-933 In this research, detailed and elaborated description on the methods used in designing the traffic signal controllers and the overall project development are included. MATLAB is the sole program used in implementing the whole project. The traffic signal controllers are designed using SIMULINK block diagram provided by MATLAB. For fuzzy logic based traffic signal controller system, Mamdani-Type fuzzy inference system (FIS) editor is used to develop fuzzy rules, input and output membership functions. Fuzzy traffic controller will be built either using graphical user interface (GUI) tools or working from the command line. In this project, a graphical user interface (GUI) tool is used to build both fuzzy because it is much easier than working from command line. The traffic model is also developed using SIMULINK block diagram and enhanced with the SimEvent block diagram. However, actuated traffic signal controller for isolated intersection is also developed in this project in order to compare their performance with that of the fuzzy traffic signal controller. Lastly, the results from the simulations are discussed on average waiting time, average delay time and average queue length as performance index for controlling traffic flow at the intersection.
ISSN : 0975-3397
II.
ISOLATED TRAFFIC MODEL
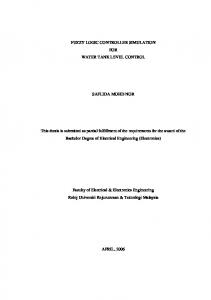
The traffic signal controllers for isolated intersection shown in Figure 1 are designed based on the traffic model from Che Soh et al. [8]. The isolated traffic intersection model developed in MATLAB using SIMULINK and SimEvent toolbox is shown in Figure 2.
Figure 1. Isolated intersection traffic model [8].
925
Azura Che Soh et. al. / (IJCSE) International Journal on Computer Science and Engineering Vol. 02, No. 04, 2010, 924-933 Arrival-South Bound
Exit 1
Arrival South1
InT1E
InT1E
IN
InT1D
InT1G
IN
OutT1G
OutT1D
IN1 OUT IN2
IN1 OUT IN2 P1A
Intersection1_South Bound
OUT1 IN OUT2
P1H
P12
OUT1 IN OUT2
P11
InT1G
OUT
OUT
Ext12 IN
Ext11
InT1D
Out12 IN
Out11
OutT1E
P1B
P1
OUT1 IN OUT2
IN1 OUT IN2
IN
OUT
IN
T1A In1
Out1
InT1B
In2
Out2
Arrival East1
Out3 InT1B
T1F
In3
Out4
OutT1B
In4
Cycle
Arrival-East Bound
Out1
Ext1 P1C
P2
OUT1 IN OUT2
IN1 OUT IN2
IN
OUT
Exit 1
IN
T1E
Out3
Ext2 ArrT1A
Intersection1_East Bound
T1B
ArrT1F ArrT1E
ArrT1D ArrT1B
P1F
Out13
OUT
IN
IN1 OUT IN2
Ext13
Out14
OUT
T1C
IN
IN1 OUT IN2 P1D
Ext14
OutT1A
InT1A
OutT1F
InT1F
ArrT1C
T1H
OUT1 IN OUT2
P14
ArrT1G
T1G
P1G
Exit 1 IN
OUT1 IN OUT2
ArrT1H
Controller Intersection1_West Bound
OUT1 IN OUT2
IN
T1D
P1E
OUT1 IN OUT2
P13
InT1A
Arrival-West Bound
InT1F
P16
IN1 OUT IN2
OutT1C InT1C
P15
IN1 OUT IN2
OutT1H InT1H
Arrival WB1
IN OUT
Ext16
InT1H
Out15
IN
InT1C
IN
Arrival-North Bound
Ext15
OUT
IN
Intersection1_North Bound
Out16
Arrival North1
Exit 1
Figure2.
SIMULINK and SimEvent Block Diagram of Isolated intersection traffic model.
There are four approaches in this isolated intersection model with eight total movements and a server traffic light. Each approach consists of two movements which are one through movement and one right turn movement. This model is modeled as an M/M/1 queues theory and it is built based on the three main concepts in queuing theory which are customers, queues, and servers. The first and the second M in M/M/1 stand for “memoryless” distribution of inter-arrival times and service times, respectively. The “1” indicates that the isolated intersection has single server, which means one traffic signal, to service single signal phase at one time. First-In-First-Out (FIFO) discipline is applied to the vehicles queue in this model. From queuing theory, the vehicles in this model are known as customers while services time is the time for the vehicles to depart and to cross the intersection. Traffic arrival and service times at the intersection are independent random variables with Poisson distribution. This means that vehicles arrival at the intersection
is Poisson process with arrival rate λ and the mean of the interarrival times between vehicles are 1/ λ. The arrival of vehicles is a Poisson process and the number of arriving vehicles in system over time period follows the Poisson Distribution Function as shown by Equation 1.
p{qin (t ) k}
(t ) k e t k!
(1)
where (λ > 0) is the arriving rate which is equivalent to the number of arriving vehicles per time period and k=0, 1, 2, … . III.
DESIGN OF FUZZY TRAFFIC CONTROLLER
The fuzzy traffic signal controller for this project is designed using Mamdani-Type fuzzy inference system in MATLAB Toolbox. The design is divided into three modules which are Green Phase Module, Next Phase Module, and
Universiti Putra Malaysia. UPM.
ISSN : 0975-3397
926
Azura Che Soh et. al. / (IJCSE) International Journal on Computer Science and Engineering Vol. 02, No. 04, 2010, 924-933 Switch module. The design structure of the fuzzy traffic signal controller is shown in the block diagrams in Figure 3. .
Figure 5. Programming code in “.Embedded MATLAB Function1” block. Figure 3. Block Diagram of a Fuzzy Traffic Signal Controller.
A. Green Phase Module The traffic conditions of the green phase are observed by the Green Phase Module. Green light extension time of the green phase is produced by this module according to the condition of observed traffic flows. Fuzzy controller block and embedded MATLAB function block that contains C programming codes are the two main blocks of this module. This module is shown in Figure 4.
Waiting time, Wt and vehicles queue length, Q are used as the two input variables for fuzzy inference system in traffic signal controller. The basic structure of FIS controller that consists of input membership function, fuzzy rules set, and output membership function is shown in Figure 6 below.
Figure 6. Basic structure of FIS.
Figure 4. SIMULINK blog diagram of Green Phase Module.
This module contains “Fuzzy Controller 1” block that has one set of fuzzy rules of Mamdani-type fuzzy inference system which is used to determine the extension time of green light. The set of fuzzy rules consists of a total of 25 rules and the fuzzy inference system (FIS) which contains these rules takes the vehicles waiting time and the vehicles queue length at current green phase as its antecedents and generates “extension” as output. Then, the value of “extension” is sent to the “Embedded MATLAB Function1” block for evaluation. The “Embedded MATLAB Function 1” block that contains simple if-else statements evaluate the possibility that the green phase should extend based on the generated ‘extension’ output from the first fuzzy inference system and the queue lengths in the other three phases. Figure 5 shows the slightly of programming code in “Embedded MATLAB Function1”.
ISSN : 0975-3397
Eleven types of membership functions are provided for designing the input characteristics of a system. Different type of membership function has different fuzzification condition to the design of fuzzy inference system. Instead of triangularshaped membership function, Gaussian membership function is chosen as the membership function type for both Wt and Q, respectively, because Wt and Q do not vary linearly in real time. The waiting time of vehicle is assumed to be ranged from 0 to 50 seconds and its input membership functions is shown in Figure 7. The input membership function of waiting time, Wt, is subdivided into five ranges: very short (VS), short (S), long (L), very long (VL), and extremely long (EL). Each range corresponds to a membership functions. Since there are five ranges in membership function of waiting time, Wt, so there are a total of five membership functions. Each of these Gaussian membership functions has standard deviation (σ) of 2 and the constant for Gaussian membership functions of VS, S, L, VL, and EL are 0 seconds, 10 seconds, 20 seconds, 30 seconds, and 40 seconds, respectively.
927
Azura Che Soh et. al. / (IJCSE) International Journal on Computer Science and Engineering Vol. 02, No. 04, 2010, 924-933 The rule based of fuzzy logic controller system is designed based on “IF-THEN” condition. All of the fuzzy rules for controlling a system are established by using the “IFAND-THEN” statement. The fuzzy rules for fuzzy traffic signal controller at isolated intersection is defined in Table 1. TABLE I. FUZZY RULES Figure 7. Input membership functions of vehicles waiting time(Wt).
For the membership functions of vehicles queue length, Q, the range of queue length is assumed to be 0 to 50 vehicles in a lane on each approach at the intersection. The input membership functions are shown in Figure 8. From the figure, input of Q membership functions are subdivided into five ranges: very short (VS), short (S), long (L), very long (VL), and extremely long (EL). Each range corresponds to a membership functions and it has a total of five membership functions for the input of Q. Each of these membership functions has standard deviation (σ) of 2 and the constant for membership functions of VS, S, L, VL, and EL are 0 vehicle, 10 vehicles, 20 vehicles, 30 vehicles, and 40 vehicles, respectively.
Rules
Input 1(Wt)
Input 2(Q)
Output(extension)
1 2 3 4 5 6 7 8 9 10 11 12 13 14 15 16 17 18 19 20 21 22 23 24 25
VS VS VS VS VS S S S S S L L L L L VL VL VL VL VL EL EL EL EL EL
VS S L VL EL VS S L VL EL VS S L VL EL VS S L VL EL VS S L VL EL
Z Z S S L Z S S L L S S L L L S S L VL EL L L L VL EL
Figure 8. Input membership functions of vehicles queue length(Q).
The input membership functions for both vehicles waiting time, Wt, and vehicles queue length, Q can be modified to suit the environmental condition of traffic flows in order to obtain better performance. The output fuzzy variable, extension which means the extension time of green light, is subdivided into five ranges corresponding to fuzzy sets: zero (Z), short (S), long (L), very long (VL), and extremely long (EL). So, it consists of five membership functions which Z, S, L, VL, and EL where these membership functions are Gaussian membership functions with standard deviation, σ equals 2 and constant, c equals 2.5. The membership function is shown in Figure 9 below.
B. Next Phase Module Next Phase module controls the phase sequence based on the vehicle’s queue length and extension time of green light from Green Phase module. The SIMULINK block diagram of this module is shown in Figure 10.
Figure 10. SIMULINK block diagram of Next Phase module.
Figure 9. Output membership function of extension.
ISSN : 0975-3397
This module selects one candidate for the green phase and it extends the green time of green phase based on traffic conditions of all phases. A phase is skipped if the phase has zero queue length. Zero queue length means no vehicle exist on the lane. This is done by the “Embedded MATLAB Function3” block that contains simple programming code in combination with “Triggered Subsystem” block that is set to
928
Azura Che Soh et. al. / (IJCSE) International Journal on Computer Science and Engineering Vol. 02, No. 04, 2010, 924-933 execute in falling trigger. Falling trigger means the triggered subsystem is executed when the control signal falls from a positive or 1 to 0. The program code in “Embedded MATLAB Function3” block is shown in Figure 11 below.
The Switch Module switches current phase to the appropriate next phase. Basically, this module switches the current phase to the next phase based on the outputs of Next Phase Module. If the other phases have longer queue than the queue of current phase, then, the Next Phase Module will give signal to Switch Module to switch to the phase that has the longer queue. This module is constructed using an embedded MATLAB function block that contains simple if-else programming language to switch the phases. The code of the programming language is shown in Figure 12.
Figure 11. Program code in “Embedded MATLAB Function3” block to skip a phase when vehicle queue length is zero.
Based on Figure 11, “g” is defined as the duration of ON for green light in green phase. If extension time of green light is zero and the queue length is zero, then duration of ON for green light in green phase is set to 1 second. It is set to 1 instead of 0 because this value will sum with the value from input port 2 (In2), which is actually a zero, as shown in Figure 9. Then, the output of 1 from the summation block will be sent to the “Subtract” and “Math Function9” blocks, respectively. The output from “Subtract” block to the upper input of “Relational Operator” block is 0. Initially, the output of “Relational Operator” block is zero in both of its inputs are not equal. At the time when the output of “Math Function9” starts to count from 0 to 1, the “Triggered Subsystem” will be triggered to switch to next phase at the time when both inputs to the “Relational Operator” block are zero. The output of “Relational Operator” switches from 1 to 0 instantly. This means the phase is skipped when there is no vehicle. There are four phases in this module which are phase 1, phase 2, phase 3, and phase 4. Green light in East direction is phase 1, green light in South direction is phase 2, green light in West direction is phase 3, and, lastly, green light in North direction is phase 4. The sequence of these phases is controlled by the “Triggered Subsystem”. Two outputs of Next Phase module are connected to the Switch module for phase switching.
Figure 12. Program code for Switch module.
The design structure of the fuzzy traffic signal controller is shown in the block diagrams in Figure 13.
C. Switch Module
ISSN : 0975-3397
929
Azura Che Soh et. al. / (IJCSE) International Journal on Computer Science and Engineering Vol. 02, No. 04, 2010, 924-933
Figure13. SIMULINK block diagram of the fuzzy traffic signal controller
At low traffic volume, the total number of vehicles flow in and out of the isolated intersection in one hour is assumed to be varied between 0 and 1000 vehicles, at medium traffic volume is assumed to be varied between 1000-2000 vehicles and at high traffic volume is assumed to be varied above 2000 vehicles. The fuzzy controller is compared with vehicleactuated signal controllers in terms of average queue length, average waiting time, delay time, and total departure at each of the four approaches at the isolated intersection. The performance index average waiting time is the measure time of waiting for the vehicles to pass through the intersection. Average queue length is the measure of queue length of vehicles at the intersection over time while waiting the traffic light to switch to green light. Delay time is the measure of the difference between the time that vehicles used to pass the intersection using its normal speed and the theory time The performance comparisons between fuzzy traffic controller and vehicle-actuated controller at low traffic volume are summarized in Table II. Based on Table II, the performance of fuzzy traffic controller is better than vehicleactuated controller in terms of average waiting time, average queue length, and delay time as the performance comparison for each of these three performance indices has positive percentage value. From the Table II, the fuzzy traffic controller shows improvement in average waiting time for
ISSN : 0975-3397
Average Waiting Time 80
70
60
50 Waiting Time(seconds)
The performance of fuzzy and vehicle-actuated signal controllers is compared by simulating these controllers in isolated traffic intersection model. Comparisons are done in three different scenarios. These three scenarios have different traffic volumes at the intersection and they are divided into low volume, medium volume, and high volume, respectively. This section shows the performance of these two types of traffic signal controllers at different traffic volumes and comparisons between these traffic signal controllers are done.
East direction is 13.09%, South direction is 46.62%, West direction 51.34% and North direction is 47.01% over the vehicle-actuated controller.
40
30
East Bound(Fuzzy) East Bound(Actuated)
20
North Bound(Fuzzy) North Bound(Actuated) West Bound(Fuzzy) West Bound(Actuated)
10
South Bound(Fuzzy) South Bound(Actuated) 0
0
500
1000
1500
2000 Time(seconds)
2500
3000
3500
Figure 14. A comparison of the results of average waiting time for each phase based on FTC and VAC controllers (low volume). Average Queue Length 10
9
8
7
Queue Time(seconds)
IV. SIMULATION RESULTS AND DISCUSSIONS
6
5
4
3
East Bound(Fuzzy) East Bound(Actuated) North Bound(Fuzzy)
2
North Bound(Actuated) West Bound(Fuzzy) West Bound(Actuated) South Bound(Fuzzy)
1
South Bound(Actuated) 0
0
500
1000
1500
2000 Time(seconds)
2500
3000
3500
Figure 15. A comparison of the results of average queue length for each phase based on FTC and VAC controllers (low volume).
930
Azura Che Soh et. al. / (IJCSE) International Journal on Computer Science and Engineering Vol. 02, No. 04, 2010, 924-933 Average Queue Length
Average Delay Time
20
140
18 120 16
14
Queue Time(seconds)
Delay Time(seconds)
100
80
60
12
10
8
6
40
East Bound(Fuzzy)
East Bound(Fuzzy)
East Bound(Actuated)
20
East Bound(Actuated)
North Bound(Fuzzy) North Bound(Actuated) West Bound(Fuzzy)
4
West Bound(Actuated)
2
North Bound(Fuzzy) North Bound(Actuated) West Bound(Fuzzy) West Bound(Actuated)
South Bound(Fuzzy) South Bound(Actuated) 0
South Bound(Fuzzy) South Bound(Actuated) 0
0
500
1000
1500
2000 Time(seconds)
2500
3000
3500
Figure 16. A comparison of the results of average delay time for each phase based on FTC and VAC controllers (low volume).
Average queue length (vehicles) Delay time (seconds)
FTC
VAC
East North West South East North West South East North West South
59.26 41.46 31.99 40.31 7.51 4.57 2.21 4.21 71.80 53.89 49.81 52.73
61.63 60.84 59.39 54.44 8.06 7.00 4.45 5.47 73.41 74.77 77.25 67.93
Improvement (%) 3.85 31.85 46.14 25.96 6.82 34.72 50.31 22.94 2.19 27.93 35.52 22.38
Average Waiting Time 100
90
1500
2000 Time(seconds)
2500
3000
3500
Average Delay Time
90
80
70
60
50
40
30 East Bound(Fuzzy) East Bound(Actuated) North Bound(Fuzzy)
20
North Bound(Actuated) West Bound(Fuzzy) West Bound(Actuated)
10
South Bound(Fuzzy) South Bound(Actuated) 0
0
500
1000
1500
2000 Time(seconds)
2500
3000
3500
Figure 19. A comparison of the results of average delay time for each phase based on FTC and VAC controllers (medium volume).
Average Waiting Time 60
50
40 Waiting Time(seconds)
The simulation on the traffic model with the controllers is extended to another scenario with the medium traffic volume and high traffic volume. The comparisons of these controllers in other two scenarios show similar trend. Fuzzy traffic controller show the good performance compared with the vehicle-actuated controller for average waiting time, average queue length and average delay time as shown in figures below.
1000
100
Delay Time(seconds)
Average waiting time (seconds)
Phase
500
Figure 18. A comparison of the results of average queue length for each phase based on FTC and VAC controllers (medium volume).
TABLE II. PERFORMANCE OF FUZZY TRAFFIC CONTROLLER(FTC) AND VEHICLE-ACTUATED CONTROLLER(VAC) AT LOW VOLUME. Performance Measure
0
30
20
80
East Bound(Fuzzy) East Bound(Actuated) North Bound(Fuzzy)
70
North Bound(Actuated) West Bound(Fuzzy)
Waiting Time(seconds)
10 60
West Bound(Actuated) South Bound(Fuzzy) South Bound(Actuated)
50
0
0
500
1000
1500
2000 Time(seconds)
2500
3000
3500
40
30 East Bound(Fuzzy) East Bound(Actuated) North Bound(Fuzzy)
20
North Bound(Actuated) West Bound(Fuzzy)
Figure 20. A comparison of the results of average waiting time for each phase based on FTC and VAC controllers (high volume).
West Bound(Actuated) South Bound(Fuzzy)
10
South Bound(Actuated) 0
0
500
1000
1500
2000 Time(seconds)
2500
3000
3500
Figure 17. A comparison of the results of average waiting time for each phase based on FTC and VAC controllers (medium volume).
ISSN : 0975-3397
931
Azura Che Soh et. al. / (IJCSE) International Journal on Computer Science and Engineering Vol. 02, No. 04, 2010, 924-933 Average Queue Length 18
16
TABLE IV. PERFORMANCE OF FUZZY TRAFFIC CONTROLLER(FTC) AND VEHICLE-ACTUATED CONTROLLER(VAC) AT HIGH VOLUME.
14
Queue Time(seconds)
12
Performance Measure
10
Average waiting time (seconds)
8
6 East Bound(Fuzzy) East Bound(Actuated)
4
North Bound(Fuzzy) North Bound(Actuated) West Bound(Fuzzy)
2
West Bound(Actuated) South Bound(Fuzzy) South Bound(Actuated)
0
0
500
1000
1500
2000 Time(seconds)
2500
3000
3500
Figure 21. A comparison of the results of average queue length for each phase based on FTC and VAC controllers (high volume).
Average Delay Time 70
60
Delay Time(seconds)
50
40
30
20
East Bound(Fuzzy) East Bound(Actuated) North Bound(Fuzzy) North Bound(Actuated) West Bound(Fuzzy)
10
West Bound(Actuated) South Bound(Fuzzy) South Bound(Actuated) 0
0
500
1000
1500
2000 Time(seconds)
2500
3000
3500
Figure 22. A comparison of the results of average delay time for each phase based on FTC and VAC controllers (high volume).
The summarized results for medium traffic volume and high traffic volume are shown in Table III and Table IV respectively. TABLE III. PERFORMANCE OF FUZZY TRAFFIC CONTROLLER(FTC) AND VEHICLE-ACTUATED CONTROLLER(VAC) AT MEDIUM VOLUME. Performance Measure Average waiting time (seconds) Average queue length (vehicles) Delay time (seconds)
ISSN : 0975-3397
Phase
FTC
VAC
East North West South East North West South East North West South
35.99 30.92 28.82 32.46 6.73 4.67 5.64 7.10 43.98 40.33 36.23 39.45
47.32 44.95 42.60 53.40 8.50 6.97 8.26 12.45 56.15 54.68 50.43 60.61
Average queue length (vehicles)
Improvement (%) 23.94 31.21 32.35 39.21 20.82 33.00 31.72 42.97 21.67 26.24 28.16 34.91
Delay time (seconds)
Phase
FTC
VAC
East North West South East North West South East North West South
22.77 26.25 27.91 31.73 6.62 8.07 8.14 11.74 28.40 31.73 33.61 36.37
36.21 36.95 36.08 46.23 10.66 11.32 10.73 16.93 41.87 42.55 41.80 51.28
Improvement (%) 37.12 28.96 22.64 31.36 37.90 28.71 24.14 30.66 32.17 25.43 19.59 29.08
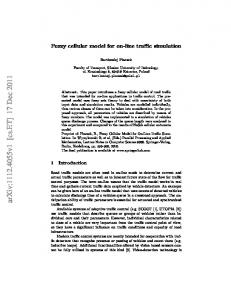
Fuzzy traffic signal controller produce lower waiting time, queue length and delay time as compared to the vehicleactuated signal controller because fuzzy traffic signal controller is able to skip the phase where there is no vehicle detected on any approach and assign the right of way to other approach where vehicles are present. This means that green phase will not assign the approach where there is no vehicle so that more green time can be allocated to other approaches that have longer vehicles queue length. By this means, shorter average vehicles queue length on each approach at the isolated traffic intersection can be maintained at all time. Total departure is the total number of vehicles that are allowed to pass through the intersection over a time period. The total departure for each direction is summarized in Table V. From table, the total departure at the East approach of the intersection is the highest amongst the four approaches at the intersection for low traffic volume. It is the lowest at the West approach. This indicates that the traffic volume at the East approach is heaviest while it is lightest at the West approach. Since the traffic flow volume at East approach is heaviest, fuzzy traffic controller will assign longer green time extension to the East approach in order to ease the traffic condition. So, the total departure at East approach of fuzzy controller will be higher than that of vehicle-actuated controller. For the traffic medium volume, the North direction is the highest departure vehicles exit the intersection. For the South direction, it is the lowest amongst the four directions. For this case, the vehicle-actuated controller show the good performance compared the fuzzy controller but only 3.05% little improvement. In the high traffic volume, the vehicleactuated controller show little improvement in the East and North direction with -0.09% and -4.24% respectively compared fuzzy controller. But, in overall the total vehicles for isolated intersection is highest for fuzzy traffic controller compared to vehicles-actuated controller. The histogram of total vehicles departure for each traffic volume scenario is shown in Figure 23 for fuzzy traffic controller and vehicleactuated controller.
932
Azura Che Soh et. al. / (IJCSE) International Journal on Computer Science and Engineering Vol. 02, No. 04, 2010, 924-933
TABLE V. Traffic Volume Low
Medium
High
the vehicle-actuated controller due to the former’s ability to adapt to different traffic conditions. The time extendibility is not fixed and it can freely determine the length of the green phase according to traffic conditions at the intersection, which does improve the efficiency of the controller.
DEPARTURE VEHICLES
Phase
FTC
VAC
East North West South Total East North West South Total East North West South Total
907 788 490 751 2936 1339 1654 1418 1081 5498 2113 2486 2129 2248 8976
890 743 539 719 2891 1291 1651 1365 1115 5422 2115 2596 2089 2150 8950
Improvement (%) 1.91 6.06 -9.09 4.45 1.56 3.72 0.18 3.88 -3.05 1.35 -0.09 -4.24 1.91 4.56 0.29
ACKNOWLEDGMENT This research is supported by Universiti Putra Malaysia.
REFERENCES [1]
[2] [3]
[4]
[5]
Total of Departure 10000
[6]
9000 Number of Vehicles
8000 7000
[7]
6000 FTC
5000
VAC
4000
[8]
3000 2000 1000 0 Low
Medium
High
Traffic Volume
Figure 23. Departure of vehicles exit intersection.
CONCLUSIONS In this paper, the traffic model and traffic controller are develop using MATLAB software. Based on M/M/1 queue theory, the traffic model is easy to develop using SIMULINK and SimEvent toolbax in MATLAB. The traffic controller is developed using fuzzy inference method implemented in MATLAB. To test the effectiveness fuzzy controller to control the traffic flow at isolated intersection, the MATLAB simulation has been done. The comparison proposed controller with the traditional method, vehicle-actuated controller also has been done. Overall, the fuzzy controller shows good performance for controlling traffic flow at multilane isolated intersection. The effectiveness of the fuzzy traffic controller is superior to
ISSN : 0975-3397
Y. Chong, C. Quek, and P. Loh, “ A novel neuro-cognitive approach to modeling traffic control and flow based on fuzzy neural techniques” Expert Systems with Applications. 36 (2009), pp.4788–4803, 2009. J. Niittymäki, Fuzzy Traffic Signal Control: Principles and Applications. Ph.D. Dissertation. Helsinki University of Technology, Findland, 2002. C. Pappis, and E. Mamdani, “A fuzzy fogic controller for a traffic junction”, IEEE Transactions on Systems, Man and Cybernetics, vol. 7, no10, 1977,pp. 707-717. S. Kim, Applications of Petri Networks and Fuzzy Logic to Advanced Traffic Management Systems. Ph.D. Thesis, Polytechnic University. New York, USA, 1994. J.Favilla, A. Machion, and F. Gomide, “Fuzzy traffic control: adaptive strategies”, Proceedings of the 2nd IEEE International Conference on Fuzzy Systems. March 1993. San Fransisco, USA, 1993,pp 505-511. K.K. Tan, M. Khalid, and R. Yusuf, “Intelligent traffic lights control by fuzzy logic”, Malaysian Journal of Computer Science, vol 9 no.2, 1996, pp 29-35. G.H. Kulkarni, and P.G. Waingankar, “Fuzzy logic based traffic light controller”, Second International Conference on Industrial and Information Systems, ICIIS 2007. 8 – 11 August, Sri Lanka,2007, pp107-110. A., Che Soh, M. Khalid, R. Yusof, and M.H. Marhaban, “Modelling and optimisation of a traffic intersection based on queue theory and markov decision control methods”, Asia Modelling Symposium, AMS2007, 2730 Mac , Phuket, Thailand,2007.
AUTHORS PROFILE Azura Che Soh received the B.Eng degree in Electronic/Computer and M.Sc degree in Electrical and Electronics Engineering from the Universiti Putra Malaysia (UPM), Malaysia in 1998 and 2002, respectively. Her research interest includes artificial intelligence, process control, control systems, robotics and automation. Presently she is a lecturer at Universiti Putra Malaysia (UPM), Malaysia. She is currently pursuing her PhD degree in intelligent urban traffic lights control at Universiti Teknologi Malaysia (UTM), Malaysia. Lai Guan Rhung received his B.Eng in Electrical and Electronic Engineering in 2010 from Universiti Putra Malaysia(UPM). His research interest includes intelligent control system and power engineering. Haslina Md. Sarkan received her B.Sc. degree in Electrical, Electronique and Electrotechnique and M.Sc. Degree in Electrical, Electronique and Electrotechnique from the Universite Science et Technologie de Languedoc, Montpellier, France in 1993 and 1995 respectively. Her research interests include Artificial Intelligence, Machine learning, Image processing, Computer vision and Control systems. She is currently pursuing her Ph.D. degree in intelligent face recognition system at Universiti Teknologi Malaysia (UTM), Malaysia.
933