Matlab Toolbox to Perform Secondary Quality Control (2nd QC) on Hydrographic Data Toste Tanhua, Leibniz Institute for Marine Sciences, Kiel, Germany. This Matlab package will help you perform secondary quality control (2nd QC) of your data. Background Secondary quality control is a process in which data are objectively studied to quantify systematic biases in the measurements. The identified data biases are subjectively compared to predetermined accuracy limits. If the data from the cruise being analyzed show significant bias, this may indicate that an adjustment (either multiplicative or additive) needs to be made to the data, or that there is a systematic problem in the data generation or calibration. It is not recommended that data be adjusted solely on the basis of a secondary QC, but rather that it be stated in the meta-data that there may be a bias and why. At best, the source of the bias will be identified (for example, a problem with the standard used) and corrected. Using this package allows crossover analysis to be performed. Crossover analysis is an objective comparison of deep water data from one cruise with data from other cruises in the same area (e.g., Sabine et al. 1999, Gouretski and Jancke 2001, Johnson et al. 2001, Sabine et al. 2005, Tanhua et al., 2010, see also http://cdiac.esd.ornl.gov/oceans/glodap/crossover.html). The scripts in this package are modified versions of the scripts used by the CARINA project; see Tanhua et al. 2010for more information. An extract of that information is given below. If you use this tool, please cite as: Tanhua, T. 2010. Matlab Toolbox to Perform Secondary Quality Control (2nd QC) on Hydrographic Data. ORNL/CDIAC-158. Carbon Dioxide Information Analysis Center, Oak Ridge National Laboratory, U.S. Department of Energy, Oak Ridge, Tennessee. doi:10.3334/CDIAC/otg.CDIAC_158 Crossover Analysis The result of a crossover analysis is an offset. Offsets are defined as the difference between two cruises, A and B, derived from the analysis. Here we refer the cruise being analyzed as cruise A and the cruise from the reference data base as cruise B. If the offset for cruise A (relative to cruise B) is less than zero (or unity, for multiplicative parameters), then cruise A data would have to be increased to be consistent with cruise B (or vice versa). The offsets are quantified as multiplicative factors for nutrients, oxygen, and CFCs, and as additive constants for salinity, DIC, and alkalinity. There are several reasons for the division between additive and multiplicative offsets. Firstly, multiplicative offsets eliminate the problem of potentially negative values for any variable with measured concentration close to zero, i.e., in the surface water for nutrients, or oxygen concentrations in low oxygen areas. Also, for nutrients and oxygen analysis, problems in standardization are the most likely source of error, hence a multiplicative offset is deemed appropriate. For DIC, alkalinity, and salinity, an additive adjustment is more appropriate, due to, for instance, biases in the reference material used. Similarly, since pH is a logarithmic unit, only additive offsets can be considered. Since the upper water column is more sensitive to variability on various timescales than the deep ocean, normally only the deep part of the water column is considered for
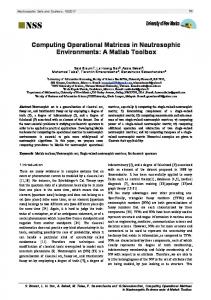
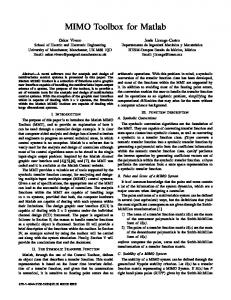
the analysis. This minimum depth must be defined for crossover analysis—1500 m is a standard set-point but not necessarily the best choice. The crossover analysis in this tool-box is performed on density (i.e., sigma-4) surfaces to account for vertical shifts of properties (i.e., internal waves etc.). The first step in a crossover analysis is to interpolate the profiles of the parameter in question for all stations with a Piecewise Cubic Hermite Interpolating scheme. An important feature of this algorithm is that interpolated values almost never exceed the range spanned by the data points and that large vertical gaps in the data are not interpolated; the definition of “large” is depth-dependent so that larger “gaps” are allowed in the deeper part of the profile. The software looks for stations that are in the same area as the one being analyzed. The definition of “same area” is a variable and has to be set (normally to 2 degrees of latitude, i.e., ~222 km) but can be changed based on knowledge of horizontal gradients in the area. The software compares the interpolated profile from each station in cruise A to each interpolated profile from cruise B within the maximum distance for a valid crossover, and a difference profile is calculated for each such pair. This process is repeated for each station in cruise A and the crossover offset and its standard deviation are calculated as the weighted mean and standard deviation of the difference profiles of each crossover pair (i.e., cruises A and B). In this way, the parts of the profiles with low variability have more weight in the calculation. The software performs this process for all cruises in the reference data base and displays the offsets in one figure per cruise pair (Figure 1) and one overview for all crossovers vs. a reference data set (Figure 2).
Figure 1: Offset found between two cruises for oxygen.
Figure 2: Summary of all biases found for one cruise vs. all cruise in the CARINA-ATL reference data base. This package allows data to be compared to data from the two data sets GLODAP [Key et al. 2004] and CARINA [Key et al. 2010] using crossover analysis. Both of these data sets can be downloaded from CDIAC at http://cdiac.esd.ornl.gov/. However, a few changes have been made to these data to avoid overlapping cruises (cruises available in both GLODAP and CARINA) and to correct some known errors in these data sets (see below). This package also contains a few m-files and the reference data in Matlab format. In addition, you will need m-map (preferably a recent version) to draw maps. There is an excellent documentation in the file “map.html”. Please, send feedback to Toste Tanhua:
[email protected].
Content of the 2ndQC toolbox
sec_QC.m xover_secQC.m intprofile.m posfig.m matching.m meanprofile.m example.m
The reference data are in a directory called “refdata” that consists of the CARINA and GLODAP data formatted for Matlab with the changes stated below. Sec_QC.m function sec_QC(input,ref,parameter,expocode,latlim,mindepth);
Function to perform cross-over analysis of hydrographic data. It is advisable to create a directory for each data set being analyzed. New directories will be made with the plots for the various parameters. The following must be defined: 1. INPUT:A matrix from the cruise undergoing 2nd QC must contain the following data in the following order: [Station number; Latitude; Longitude; Pressure; Sigma-4; Parameter-data (i.e. the parameter for which 2nd QC is being performed)]. 2. REF: The data set being used for 2nd QC. There are 6 options: 1: GLODAP Atlantic 2: GLODAP Pacific 3: GLODAP Indian 4: CARINA Southern Ocean 5: CARINA Atlantic 6: CARINA Arctic Mediterranean Seas 3. PARAMETER: 8 options: 1: TCO2; 2: Alkalinity, 3: Oxygen, 4: Nitrate 5: Phosphate 6: Silicate 7: Salinity 8: pH (only for CARINA data). 4. EXPOCODE: The expocode (or name) of the cruise you are testing 5. LATLIM: Horizontal influence ratio, i.e., a latlim of 2 means against which all data within ~222 km are being compared. 6. MINDEPTH: Compare only deep water data to avoid seasonal effects, etc.—often set to 1500 m. The script will produce the weighted difference between the cruises (multiplicative for nutrients and oxygen, additive for TCO2, alkalinity, salinity, and pH) and the corresponding weighted standard deviation of the comparison. This will be displayed in one figure for each
cruise used for comparison and a figure that displays all crossover results. These figures will be stored in a new directory.
Xover_2ndQC.m function [diff, stdw] = xover_2ndQC(parameter,mindepth,latlim);
This script is called by sec_QC.m. Normally, this script does not need to be edited, but it can be helpful to edit limits of the X-axis here. The profiles are interpolated using Piecewise Cubic Hermite Interpolating and then averaged to an average profile for each cruise. Note that for less than 3 data points for a depth/density, no further analysis will be performed. Thus, at least 3 stations per cruise are necessary for a crossover analysis. This function calculates the difference of each pair of stations, and the average of those differences is used to compute the crossover difference between the two cruises. m_map is necessary to run this function as well as the following files: intprofile.m Function to interpolate the value of a given parameter through the water column so that two profiles can be compared to each other without being sampled at the exact same depth. meanprofile.m Script to calculate an average profile from several profiles in an area. The profiles are first interpolated to standard depths (or densities), which are then averaged, and the standard deviation is calculated. matching.m Function to match two data sets with respect to the y-parameter (depth or density). For instance, two profiles from the same station that has been interpolated to the same depth, but where max and min depth might be different. INPUT: xpar1 = the dependent variable of the first station xpar2 = the dependent variable of the second station ypar1 = the independent variable (depth/dens) of the first station ypar2 = the independent variable (depth/dens) of the first station OUTPUT: x1 = the independent variable of the first station x2 = the independent variable of the second station y = the independent variable (dens/depth) Posfig.m Just a little routine for making nicer plots. example.m This is an example of how to use the 2nd QC toolbox. The preliminary data were downloaded from the 2010 repeat of line P6 from CCHDO (downloaded August 12, 2010) and saved as a .mat-file (318M20100105.mat).
Changes made to the GLODAP Atlantic data 1. Cruise 45 (TTONAS_1-7) DIC and alkalinity data were adjusted accordingly to Tanhua and Wallace (2005) 2. Cruise 23 (OACES93) was overcorrected for oxygen; oxygen is adjusted by -7.5 umol/kg as suggested by Sabine et al. (2005) 3. Cruise 24 (3230CHITHER2_1-2) is adjusted for alkalinity by -8 umol/kg (Velo, et al., 2009). 4. Cruises 2, 3, and 29 are also available in CARINA but with additional data. To avoid using the same cruise twice, these cruises are excluded in the GLODAP Atlantic file. 5. No changes have been made to the GLODAP data in the Pacific of the Atlantic.
References: Gouretski, V. V., and K. Jancke (2001), Systematic errors as the cause for an apparent deep water property variability: global analysis of the WOCE and historical hydrographic data, Prog. Oceanogr., 48, 337-402. Johnson, G. C., P. E. Robbins, and G. E. Hufford (2001), Systematic adjustments of hydrographic sections for internal consistency, J. Atmos. Ocean. Technol., 18, 12341244. Key, R. M., A. Kozyr, C. L. Sabine, K. Lee, R. Wanninkhof, J. L. Bullister, R. A. Feely, F. J. Millero, C. Mordy, and T. H. Peng (2004), A global ocean carbon climatology: Results from Global Data Analysis Project (GLODAP), Global Biogeochem Cycle, 18. Key, R. M., T. Tanhua, A. Olsen, M. Hoppema, S. Jutterström, C. Schirnick, S. van Heuven, A. Kozyr, X. Lin, A. Velo, D. W. R. Wallace, and L. Mintrop (2010), The CARINA data synthesis project: introduction and overview, Earth Syst. Sci. Data, 2, 105-121. Sabine, C. L., R. M. Key, K. M. Johnson, F. J. Millero, A. Poisson, J. L. Sarmiento, D. W. R. Wallace, and C. D. Winn (1999), Anthropogenic CO2 inventory of the Indian Ocean, Global Biogeochem Cycle, 13, 179-198. Sabine, C. L., R. M. Key, A. Kozyr, R. A. Feely, R. Wanninkhof, F. Millero, T. H. Peng, J. Bullister, and K. Lee (2005), Global Ocean data analysis project (GLODAP): Results and data. Tanhua, T., S. van Heuven, R. M. Key, A. Velo, A. Olsen, and C. Schirnick (2010), Quality control procedures and methods of the CARINA database, Earth Syst. Sci. Data, 2, 3549. Tanhua, T., and D. W. R. Wallace (2005), Consistency of TTO-NAS Inorganic Carbon Data with modern measurements, Geophys. Res. Letters, 32, L14618. Velo, A., F. F. Perez, P. Brown, T. Tanhua, U. Schuster, and R. M. Key (2009), CARINA alkalinity data in the Atlantic Ocean, Earth Syst. Sci. Data, 1, 45-61.