result in maximal recovery of WSN source data (for different ... at the direction of IEEE Communications Society subject matter experts for publication in the IEEE ...
This full text paper was peer reviewed at the direction of IEEE Communications Society subject matter experts for publication in the IEEE INFOCOM 2008 proceedings.
Maximal Recovery Network Coding under Topology Constraint Kiran Misra, Shirish Karande, Hayder Radha Department of Electrical and Computer Engineering, Michigan State University East Lansing, MI 48824-1226 USA {misrakir, karandes, radha}@egr.msu.edu
Abstract—Recent advances have shown that channel codes can be mapped onto networks to realize efficient Network Coding (NC); this has led to the emergence of Code-on-Network-Graphs (CNG). Traditional CNG approaches (e.g Decentralized Erasure Codes) focus on a generating a sequence of encoded symbols from a given input source (of size K), such that the original symbols can be recovered from any subset of the encoded symbols of size equal to or slightly larger than K. However in all cases the number of source symbols recovered falls rapidly if the number of encoded symbols received falls below K. In this paper we determine the CNG code-ensembles (under statistical toplogy constraint) which result in maximal recovery of WSN source data (for different erasure-rates), thereby minimizing the deterioration in data recovery. We also perform fixed point stability analysis on the underlying LDPC code ensemble. We then propose a distributed algorithm for generating a sequence of encoded symbols adhering to the designed code ensemble. Optimal solutions for a sensor network with 1000 nodes is determined using the Differential Evolution algorithm, and the solution sensitivity to variance in number of sensor nodes and node-interconnectivity is evaluated. Index Terms—Low Density Parity Check Codes, Wireless Sensor Networks, Network Coding
I. I NTRODUCTION Information theory and coding theory have increasingly been playing a significant role in providing viable solutions to networking problems. This resulted in an intriguing convergence between coding and networking for data delivery/persistence [9] [8] [10]. In this paper, we propose a distributed code-over-network framework for self-configuring Wireless Sensor Networks (WSNs), with data streams which adapt to the dynamic network configuration and to the fluctuating erasure rates within the network. We first describe the mapping of sensed-data to (a subset of) variable nodes of a Low Density Parity Check (LDPC) code [1] which gives erasurereslient Network Coding (NC). We then outline a framework which: (a) Determine the code ensemble which maximizes the data recovered at the receiver (for different erasure-rates), (b) Analyze and determine fixed-point stability conditions for the “maximal recovery code ensemble”, (c)Develop a Distributed Code over Network (DCoN) mapping algorithm. In [11] we proposed a centralized NC approach which uses channel coding techniques. However, here we develop a distributed coding algorithm (supported by underlying WSN topology), critical for developing a framework robust to failures. The paper is organized as follows: Section II discusses
related work. Section III gives problem formulation, followed by asymptotic analysis in section IV. Section V describes the network model followed by a description of distributed codeover-network (DCoN) algorithm and its analysis. In section VII we describe the Differential Evolution algorithm used to obtain a global optima under different transmission range settings. The experimental results and solution-sensitivity are discussed in section VIII. We conclude in section IX. II. R ELATED W ORK Random linear network coding [2] when employed in WSN generates a sequence of encoded symbols, such that the sink can recover the original source (with high probability) if it receives a subset of the encoded symbols the same size or slightly greater than the original source [8] [9]. The source data is typically recovered using Gaussian Elimination (GE). Although, efficient in terms of the number of encoded symbols required for decoding, the GE algorithm has cubic complexity. Moreover, a significant drawback of GE based decoding is that if the number of received encoded symbols at the sink falls below a certain threshold, the amount of source data recovered quickly diminishes to zero. In [8] Dimakis et al. proposed GE decoding based, Decentralized Erasure Codes (DEC) which uses random linear NC for distributed storage in WSN. A slightly different approach was taken by Kamra et al in [10], where Growth Codes (GC) with dynamically changing degree of encoded symbols was employed in conjunction with Belief Propagation (BP) decoding [3]. The use of BP decoding permits partial data recovery. However, both DEC and GC generate a stream of encoded symbols which can be tens of times the length of embedded source data, resulting in significant energy consumption. In energy constrained WSN, we are often allowed to transmit only a fixed number of symbols towards the sink, and the receiver (through post-processing) tries to recover as much of the original data as possible. In this paper we design fixed-length LDPC codes (constrained by underlying network connectivity) which provide optimal recovery for different erasure-rates within the WSN. III. P ROBLEM F ORMULATION In [1], Bao et al. mapped XOR-based NC operations of the incoming data flows (variable nodes of LDPC) at intermediate nodes of a WSN to the check equations of an LDPC code. This enabled Network Coding (NC) to be
978-1-4244-2026-1/08/$25.00 © 2008 IEEE
This full text paper was peer reviewed at the direction of IEEE Communications Society subject matter experts for publication in the IEEE INFOCOM 2008 proceedings.
v1
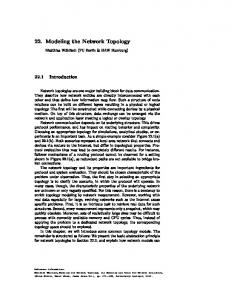
Fig. 1.
s1
s2
�
�
v2
If there is at least one check equation that has exactly one variable node erased then the erased variable node can be recovered immediately by XOR-ing the remaining known variable nodes participating in the check equation. The previously erased variable nodes can now be flagged as known and the process is repeated till no check equations with exactly one variable node erased remains. v3
v1
v2
v3
s1
For degree distributions with fixed maximum degree BP has complexity - linear in the number of received encoded symbols. We now define data-recovery as:
s2
Converting Network coding operations into a Belief Network
represented with a belief network and equated the NC design problem to that of LDPC code design. Fig. 1, depicts a simple example where the XOR operations of NC can be converted to LDPC check equations (belief network): v ⊕ v2 ⊕ v3 ⊕ s1 = 0 v1 ⊕ v2 ⊕ v3 = s1 ⇒ 1 v2 ⊕ v3 = s2 v2 ⊕ v3 ⊕ s2 = 0 The subset of XOR-ed symbols which reach the sink is subjected to BP decoding to retrieve as much of the original source data as possible. In the rest of the paper we refer to source as “data” bits, and the encoded symbols generated by the intermediate sensor nodes as “parity” bits. Additionally, nodes corresponding to the XOR equations in the belief network are termed as “check” nodes and the collection of data and parity bits which appear in the equation are called “variable” nodes. The amount of original data recovered at the sink is a function of the number of encoded symbols received and the node degree distribution of the received parity subset [7]. The precise definition of “node” and “edge” degree distributions, along with their notational representation is given in Table I. The “node” and “edge” parity degree distribution can be inter-converted using: φ φi = � i i φj /j ∀j
φ θ θ ρ ρ λ λ
(3)
φ,θ
M is number of parity symbols generated by network Perasure is the rate of erasure as seen by the data-sink α {α1 , α2 , ..., αh } is the network degree distribution having αi fraction of sensor nodes with degree i (h is maximum network node degree). The solution for the above problem determines the optimal (φ, θ), and equivalently the optimal (ρ, λ) as shown below: λ = {λ1 , λ2 , ..., λn } = (K/(K + M )) ∗ {θ1 + K/M, θ2 , θ3 , ..., θ n } ρ = {ρ2 , ρ3 , ..., ρq+1 } = {φ1 , φ2 , ..., φq }
(4) (5)
IV. A SYMPTOTIC O PTIMALITY AND F IXED P OINT S TABILITY
to to
r = (M (1 − Perasure )) /K
(1)
TABLE I {φ1 , φ2 , ..., φq }, where φi is the fraction of edges connected degree i parity nodes (q is maximum parity node degree). {φ1 , φ2 , ..., φq }, where φi is the fraction of nodes connected degree i parity nodes. {θ1 , θ2 , ..., θn }, where θi is the fraction of edges connected degree i data nodes (n is maximum data node degree). {θ1 , θ2 , ..., θn }, where θi is the fraction of nodes connected degree i data nodes. {ρ2 , ρ3 , ..., ρq+1 }, where ρi is the fraction of edges connected degree i check nodes. {ρ2 , ρ3 , ..., ρq+1 }, where ρi is the fraction of nodes connected degree i check nodes. {λ1 , λ2 , ..., λn }, where λi is the fraction of edges connected degree i variable nodes. {λ1 , λ2 , ..., λn }, where λi is the fraction of nodes connected degree i variable nodes. (θ, φ) ≈ (θ, φ) ≈ (λ, ρ) ≈ (λ, ρ): Code Degree Distribution
(φ∗ , θ∗ ) = f (K, M, Perasure , α) = arg max δ
We now look at some asymptotic results in literature to determine the nature of expected solution. We then determine a stability condition which needs to be satisfied by any (φ∗ , θ∗ ). Random Walk based Analysis: In [7] extensive asymptotic analysis was carried out (using recent results in random-walks over hypergraphs [6]-Thm 2.1) for equation (3), where α was chosen to be a complete graph (and data size K → ∞). We reproduce the key results of [7] below, so they may be compared to the results obtained in section VIII for more realistic settings of α. Let us define r as:
iφ φi = � i jφj ∀j
The inter-conversion formulae for data, check and variable degree distributions are identical to (1). Let us now take a closer look at the BP decoding algorithm.
φ
Number of source symbols recovered (2) K where, K is the number of source symbols encoded by the network. The optimal mixing rules (φ∗ , θ∗ ) for maximal data recovery, can now be mathematically stated as: δ=
to to to to to to
(6)
Typically, K is fixed and M is determined based on the energy constraint within the WSN. Meanwhile, Perasure is a function of the packets drops resulting from congestion/corruption within the network. Equation (6) implies that a solution obtained for a single r is applicable for a wide range of energy constraints (M ) and erasure rates (Perasure ) within the WSN. In [7] the Thm. 2.1 of [6] is restated as: Theorem 1. Let r ∈ R, r > 0, then we have: � rφ (t) + ln(1�− t) > 0, for 0 ≤ t ≤ s(r, φ)�where �
s(r, φ) = inf t ∈ [0, 1}rφ (t) + ln(1 − t) ∧ 1
This full text paper was peer reviewed at the direction of IEEE Communications Society subject matter experts for publication in the IEEE INFOCOM 2008 proceedings.
�
�
If the limiting degree distribution φ for K → ∞ and number of received parity bits ∼ P oi(rK), we have δ → s(r, φ).
and β = (1 − δ) rate.
Proof: Refer [6] for proof. In [7] a further analysis of Theorem 1 for r < 1 led to the following conclusions: • For 0 < δ ≤ 1/2 ⇔ 0 ≤ r ≤ ln 2, only degree 1 symbols are required at the receiver, implying that only uncoded data need be transmitted from the source. Since our problem formulation has a fixed M , this corresponds to network conditions where erasure rate is: 1 − K ln 2/M ≤ Perasure ≤ 1. • For 1/2 < δ ≤ 2/3 ⇔ ln 2 ≤ r ≤ (3/4) ln 3 all encoded symbols must be of degree 2. This translates to an erasure rate: 1 − (3K ln 3)/(4M ) ≤ Perasure < 1 − K ln 2/M . • For δ > 2/3 (i.e. Perasure < 1 − (3K ln 3)/(4M )) no analytic solution exists. Above results imply that optimal (φ∗ , θ∗ ) would change based on r. We show that this is indeed the case in section VIII. Density Evolution based Stability Analysis: The BP algorithms performance can be determined by using Density Evolution [3] [4] an analytic tool used to track the evolution of log-likelihood ratios probability density function along the edges of a belief network. In Density Evolution, the fraction of incorrect messages passed from the variable node to the check nodes at the �−th iteration is calculated, by assuming that the graph does not contain cycles of length 2� or less. Message densities from check to variable-nodes can be represented as:
Proof: Let us represent the effective erasure-rate at iteraC respectively. For the Binary tion � and (�+1) with P�C andP�+1 erasure channel P�+1 is said to be a fixed point of (λ, ρ), if C = P�C . For stability we �require that there be no fixed P�+1 � C C points for P� ∈ β, Perasure . This would ensure the BP decoder does not get stuck on its way to recovering δ source symbols. We want the effective erasure in the codeword to C C < P�C ; ∀β 0 do 8: Draw a number c from uniform distribution U (0, 1) 9: if c ≤ τ then 10: Randomly select dcur bits and XOR them to generate a parity bit. 11: τ ⇐τ −1 12: end if 13: end while 14: end for tribution θ of the codeword. We can however estimate the θ achieved, by assuming that each parity degree d contributes a small independent fraction to the overall θ. These cond d tribution θ is θ ∼ N (nd , pd ) where nd = M φd and �h d pd = d/K i=d αi The sum of these independent θ gives: d θ= θ ∼ N (µθ , σθ2 ) (10) �q
∀d
�q where µθ = i=1 µi , and σθ2 = i=1 σi2 . Note, we can use the above approximation in the stability condition (9). The probability that a data-bit generated by a sensor participates in a codeword bit formation, is termed as the “probability of coverage” and can be calculated as 1 − P (θ < 1). VII. D IFFERENTIAL E VOLUTION AND N ETWORK C ONSTRAINTS The optimal degree distributions (φ∗ , θ∗ ) for (K = 1000, M = 1500) are obtained using Differential Evolution [12]. For fixed (K, M ) we can replace Perasure with r as seen in equation (6). We determine optimal solutions for r = (0.1, 0.2, 0.3, ..., 1.5). Infeasible solutions are avoided by using penalty functions identical to those defined in [5]. The initial population size is set to 10q and the cross-over parameter CR = 1. The i − th sample in next generation (G + 1) is determined using: pi,G+1 = pbest,G + 0.5 (pr1 ,G + pr2 ,G − pr3 ,G − pr4 ,G ) (11) where, r1 , r2 , r3 , r4 is chosen randomly. We present results for q = 6 in section VIII. Note, over a period of time the
1
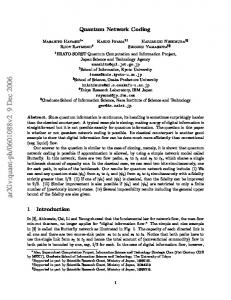
Υ=∞ Υ=8 Υ=7 Υ=6
0.8
4 Avg. Parity degree
Fraction of source recovered
bit to all its neighbors in the sensor-field. In the second stage, each node employs algorithm 1 outlined in the box to generate parity bits with the overall codeword adhering to the distribution φ. We shall see in section VIII that this localized single-hop mixing is often sufficient to achieve performance akin to that which would be obtained by mixing data beyond a single-hop. Algorithm 1 leaves little control over the data degree dis-
0.6 0.4 0.2 0
3.5
Υ=∞ Υ=8 Υ=7 Υ=6
3 2.5 2 1.5
0
0.5
r
1
1.5
1 0.4
(a)
0.5 0.66 0.8 0.9 Fraction of source recovered
1
(b)
Fig. 2. (a) Recovery (δ) as fraction of received symbols (r) increases, (b) Increase in Avg. Parity degree with increasing recovery(δ)
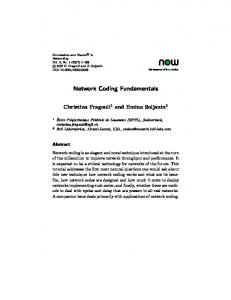
energy reserve in sensors get depleted resulting in reduced transmission power and therefore transmission range. To accommodate this we also find solutions for Υ = (6, 7, 8, ∞). The final choice of Υ = ∞ corresponds to a complete graph similar to that considered in [7]. VIII. R ESULTS The data-recovery profile shown in Fig. 2a for different transmission ranges demonstrates that the loss in performance due to localized single-hop mixing (Υ = 6, 7, 8) is small compared to mixing across the entire network with multiple hops (Υ = ∞). A quick look at Table II however shows that the degree distributions which achieve the same amount of recovery for different transmission ranges are different. In Table II we can see the trend in the optimal degree distribution for Υ = ∞ is similar to that predicted by the asymptotic analysis of section IV till r = (3/4) ln 3 ≈ 0.8. However there are some significant differences for the finite transmission range cases. The asymptotic analysis predicts a sharp change in degree distribution from all degree-one symbols to all degree-two symbols at r = ln(2). However, for (Υ = 6, 7, 8) the change is gradual. Lower the transmission range, slower is the fall in fraction of degree-one nodes. This gradual fall in degree one nodes results in smaller average degree for finite tranmission range for δ > 0.6 (Fig. 2b). The degree two nodes sees a rapid rise for Υ = ∞, and then higher degree nodes are introduced quickly. However, for finite transmission ranges the degree two node is dominant for a long time and therefore results in lower average degree (Fig. 2b). Next, we determine the sensitivity of this solution to change in network size and node-interconnections. To keep the same network degree distribution α for different number of sensors K ∗ we determine new transmission ranges Υ∗ for the sensors. We then analyze the sensitivity by measuring performance loss: �δ = δ(αK,Υ ) − δ(αK ∗ ,Υ∗ ) for K ∗ = 500, 1000, 1500, 2000. Node-Interconnection Sensitivity: Fig. 3b shows the loss in performance for 1000 sensors, but with nodeinterconnections different from design. We observe �δ ≤ 0.02, with most significant loss occurring in the range 0.7 ≤ r ≤ 1.3. This shows that the degree distributions have some sensitivity to actual node-interconnections but not significant. Sensor-Field Size Sensitivity: Fig. 3a,3c,3d illustrates that the loss in performance is more for fall in K then for a rise in K. This is consistent with results from channel coding where a
This full text paper was peer reviewed at the direction of IEEE Communications Society subject matter experts for publication in the IEEE INFOCOM 2008 proceedings.
TABLE II
0.1 0.2 0.3 0.4 0.5 0.6 0.7 0.8 0.9 1.0 1.1 1.2 1.3 1.4 1.5
Loss in Performance
0.1 0.08
φ4 φ5 φ6 Range Υ = ∞ 0.00 0.00 0.00 0.00 0.00 0.00 0.00 0.00 0.00 0.00 0.00 0.00 0.00 0.00 0.00 0.00 0.00 0.00 0.00 0.00 0.00 0.00 0.00 0.00 0.00 0.00 0.00 0.10 0.06 0.03 0.01 0.01 0.34 0.00 0.01 0.43 0.00 0.01 0.50 0.00 0.01 0.54 0.02 0.01 0.57
0.04 0.02
0.5
r
φ2 φ3 Transmission 0.99 0.00 0.00 1.00 0.00 0.00 1.00 0.00 0.00 1.00 0.00 0.00 1.00 0.00 0.00 0.99 0.00 0.00 0.97 0.02 0.00 0.23 0.76 0.01 0.03 0.96 0.00 0.01 0.96 0.01 0.03 0.65 0.30 0.14 0.00 0.84 0.06 0.39 0.03 0.17 0.07 0.01 0.25 0.04 0.06
0.1
Υ=∞ Υ = 11.44 Υ = 9.98 Υ = 8.54
0.06
0
φ1
1
1.5
0.08
0.04 0.02 0
0.5
φ1
φ2 φ3 Transmission 0.99 0.00 0.00 0.99 0.00 0.00 0.99 0.00 0.00 0.99 0.01 0.00 0.99 0.00 0.00 1.00 0.00 0.00 0.89 0.10 0.00 0.41 0.57 0.01 0.10 0.90 0.00 0.03 0.95 0.02 0.01 0.91 0.01 0.03 0.77 0.00 0.00 0.73 0.01 0.02 0.61 0.01 0.01 0.61 0.01
0.1
Υ=∞ Υ=8 Υ=7 Υ=6
0.06
(a) Fig. 3.
φ4 φ5 φ6 Range Υ = 8 0.00 0.00 0.00 0.00 0.00 0.00 0.00 0.00 0.00 0.00 0.00 0.00 0.00 0.00 0.00 0.00 0.00 0.00 0.00 0.00 0.00 0.00 0.00 0.00 0.01 0.00 0.00 0.02 0.00 0.00 0.01 0.01 0.00 0.00 0.01 0.01 0.51 0.00 0.01 0.72 0.00 0.02 0.01 0.64 0.00
r
1
1.5
(b)
0.08
φ4 φ5 φ6 Range Υ = 7 0.00 0.00 0.00 0.00 0.00 0.00 0.00 0.00 0.00 0.00 0.00 0.00 0.00 0.00 0.00 0.00 0.00 0.00 0.00 0.00 0.00 0.00 0.00 0.01 0.00 0.00 0.00 0.00 0.00 0.00 0.02 0.02 0.03 0.00 0.20 0.00 0.00 0.00 0.26 0.04 0.00 0.33 0.00 0.01 0.36
0.06 0.04 0.02 0
0.5
r
φ1 0.99 1.00 1.00 1.00 1.00 0.99 0.98 0.45 0.24 0.07 0.05 0.03 0.04 0.03 0.02
φ2 φ3 φ4 φ5 Transmission Υ = 6 0.00 0.00 0.01 0.00 0.00 0.00 0.00 0.00 0.00 0.00 0.00 0.00 0.00 0.00 0.00 0.00 0.00 0.00 0.00 0.00 0.00 0.00 0.00 0.00 0.02 0.00 0.00 0.00 0.54 0.00 0.00 0.00 0.75 0.00 0.00 0.00 0.93 0.00 0.00 0.00 0.90 0.01 0.01 0.02 0.83 0.00 0.01 0.00 0.76 0.00 0.02 0.16 0.68 0.00 0.00 0.01 0.65 0.01 0.01 0.00
0.1
Υ=∞ Υ = 6.51 Υ = 5.70 Υ = 4.89
Loss in Performance
φ2 φ3 Transmission 1.00 0.00 0.00 1.00 0.00 0.00 1.00 0.00 0.00 1.00 0.00 0.00 1.00 0.00 0.00 1.00 0.00 0.00 0.99 0.00 0.00 0.01 0.99 0.00 0.03 0.56 0.40 0.08 0.40 0.33 0.05 0.57 0.02 0.06 0.50 0.00 0.08 0.41 0.00 0.09 0.35 0.00 0.12 0.27 0.01
Loss in Performance
φ1
Loss in Performance
r
1
1.5
0.08
φ6 0.00 0.00 0.00 0.00 0.00 0.00 0.00 0.00 0.00 0.00 0.01 0.12 0.01 0.28 0.31
Υ=∞ Υ = 5.63 Υ = 4.93 Υ = 4.23
0.06 0.04 0.02 0
(c)
0.5
r
1
1.5
(d)
Loss in performance for (a) K = 500 (b) K = 1000 (node interconnection sensitivity) (c) K = 1500 (d) K = 2000
fall in codeword length typically leads to worse performance. Again most loss occurs for 0.7 ≤ r ≤ 1.3. IX. C ONCLUSIONS Channel Coding formulation of NC can be used to design Network-Codes resilient to packet drops. We have shown how this formulation enables the design of Network-Codes tailored to the underlying network statistical topology. We also use this formulation to derive stability condition for the mixing rules (code degree distribution). We have demonstrated that the WSN can attain maximal recovery by choosing the appropriate mixing rules after considering the prevailing network conditions. A distributed code-over-network mapping algorithm was developed to achieve the designed degree distribution. It was shown that for networks with sufficient connectivity, single-hop mixing is adequate to achieve performance similar to mixing across the network with multiple-hops. Sensitivity of the “designed solution” to change in node-interconnections and sensor-field size was evaluated and performance loss was found to be small. ACKNOWLEDGEMENTS This work was supported in part by NSF Award CCF0515253, NSF Award CNS-0430436, MEDC Grant GR-296, and unrestricted gift from Microsoft Research.
R EFERENCES [1] X.Bao, J.(T).Li “Matching Code-on-Graph with Network-on-Graph: Adaptive Network Coding for Wireless Relay Networks”, 43rd Allerton Conference on Communication, Control, and Computing, Sep. 2005. [2] T. Ho, M. M` edard, R. Koetter, D. R. Karger, M. Effros, J. Shi, B. Leong, “A Random Linear Network Coding Approach to Multicast,” IEEE Tans. on Information Theory, Vol. 52, No. 10, pp.. 4413-4430, Oct. 2006. [3] T. Richardson and R. Urbanke, “The capacity of low-density parity check codes under message-passing decoding,” IEEE Trans. Inform. Theory, vol. 47, pp. 599-618, 2001. [4] T. Richardson, A. Shokrollahi, and R. Urbanke, “Design of capacityapproaching irregular low-density parity-check codes,” IEEE Trans. Inform. Theory, vol. 47, pp. 619-637, 2001. [5] A. Shokrollahi, R. Storn, “Design of efficient erasure codes with differential evolution,” Proc. of ISIT, 2000. [6] R. Darling and J. Norris, “Structure of large random hypergraphs,” Annals of Applied Probability, vol. 15, no. 1A, pp. 125-152, 2005. [7] Sujay Sanghavi, “Intermediate Performance of Rateless Codes,” arXiv:cs/0612075v1 [cs.IT], submitted 15 Dec 2006. [8] A. G. Dimakis, V. Prabhakaran, K. Ramchandran, “Decentralized Erasure Codes for Distributed Networked Storage,” IEEE Trans. on Information Theory, Vol. 14, No. 6, pp. 2809-2816, June 2006. [9] S. Katti, R. Hariharan, W. Hu, D. Katabi, M. M` edard, Jon Crowcroft, “XORs in the air: practical wireless network coding” ACM SIGCOMM Computer Communication Review, Vol.36, No.4, pp. 243-254, Oct 2006. [10] Abhinav Kamra, Jon Feldman, Vishal Misra, Dan Rubenstein, “Growth Codes: Maximizing Sensor Network Data Persistence,” Proceedings of ACM Sigcomm, Pisa, Italy, Sept. 2006. [11] Kiran Misra, Shirish Karande, Hayder Radha, “INPoD: In-Network Processing based on Code Design,” Proc. of IEEE SECON, 2007. [12] K. Price, R. Storn, “Differential Evolution - A simple and efficient heuristic for global optimization over continuous spaces,” Journal of Global Optimization, No, 11, pp, 342-359, 1997.