We use Maximum Likelihood Estimation (MLE) analysis to analyze students' responses ... The emphasis in this paper is an introduction to likelihood estimation.
Maximum Likelihood Estimation (MLE) of students’ understanding of vector subtraction Tianren Wang and Eleanor C. Sayre Department of Physics, Wabash College, Crawfordsville, Indiana 47933 Abstract. In this paper, we report on the impact that slight changes in question format have on student response to onedimensional vector subtraction tasks. We use Maximum Likelihood Estimation (MLE) analysis to analyze students’ responses on six very similar questions which vary in context (physics or mathematics), vector alignment (both pointing to the right or opposed), and operation (left-right subtraction or right-left subtraction). Responses on all questions are generally correct and do not vary by instructional week or even by course. Context and specific operation do not show significant differences. Vector alignment is significantly different, indicating that perception or heuristic thinking is a bigger cause of failure than conceptual deficit. The emphasis in this paper is an introduction to likelihood estimation. Keywords: vectors, maximum likelihood estimation PACS: 01.40.Fk, 01.30.Cc
INTRODUCTION Vector subtraction is endemic in introductory physics but students still have problems with it, even after instruction.[1, 2] Understanding vector operations is foundational to understanding physics at the university level.[3, 4] Previous research on vector addition and subtraction in two dimensions[5, 6] suggests that graphical representations and context – mathematics, physics, or physicsless physics[7] – both play a role in predicting students’ success. The data discussed in this paper are part of a larger study on how students’ conceptual ideas change with instruction.[8, 9] The study has computerized, paperbased, and interview components; the data discussed here are exclusively paper-based. Responses on these questions do not exhibit any changes with instruction, and data from all weeks in the introductory sequence, including Mechanics and Electricity and Magnetism have been collapsed together. In this short paper, we use an easily-understood example from one-dimensional vector subtraction to highlight likelihood estimation, a statistical analysis method which is computationally difficult but more honest to the methods of PER than traditional probability.
participated in the study over 5 quarters, with roughly equal numbers of students each quarter. In each quarter, the instructor was a regular physics faculty member who taught both sections. clickers) used beyond the occasional answering of a question from a student. In addition to the 3 lectures per week, there was one recitation and one traditional lab section.
DATA COLLECTION In addition to the standard homework, students were also given a “flexible homework” assignment with credit for participation. The flexible homework assignment consisted of participating in a one-hour session in a physics education research lab where students would complete some combination of training, testing, and interviewing. Data reported in this paper are from these sessions. Typically, about 95% of students participated in the flexible homework. Because not every student took every task, the data presented here represent 812 students of the ≈1700 total participants in this phase of the study. We observed during these sessions that students made a good faith effort to answer the questions to the best of their ability.
PARTICIPANTS
Vector Subtraction
The participants in this study were university students enrolled in a first quarter (Mechanics) or second quarter (Electricity and Magnetism) introductory calculus-based physics course primarily designed for engineering students at the Ohio State University. In total, 1694 students
In this paper, we examine students’ responses to two sets of three related questions about the subtraction of vectors in one dimension. In each question, the student is given two vectors (either A and B or vi and vf ) graphically in gridded boxes and asked to perform one of
RC1v5.5
4. Below are two vectors, A and B. In the space provided, please draw B-A.
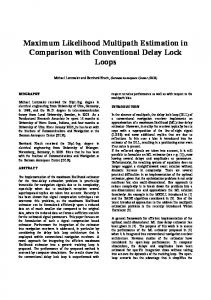
FIGURE 1. A sample question. For the questions analyzed in this paper, the vector on the left is always magnitude 5 and directed to the right (“5R”). The5.vector on of thethese rightisisequal always magnitude could "v be ?directed to either left or right (“3L” or “3R”). The Which to the change 3, in but velocity, vectors could be labeled “A” and "v =asvithey # v f are here, or ∆vi and ∆vf , respectively. a. “B”, b. "v = v f # vi = vi + vsubtraction c. "vvector TABLE 1. Differences between quesf tions. A vector which is 5 units long points d. both and a and b. to the right ! is denoted “5R”. e. all of the above. Name N ! Vectors Operation Correct ! AlignedAB 38 5R 3R A-B 2R
AlignedBA AlignedV OpposedAB OpposedBA OpposedV
37 35 66 151 485
5R 5R 5R 5R 5R
3R 3R 3L 3L 3L
B-A ∆v A-B B-A ∆v
2L 2L 8R 8L 8L
!all responses.
We use a binomial model, collapsing all distractor responses into a single “wrong” response of magnitude, and focusing on the fraction of correct responses (“score”). Because the data are largely binomial already, converting magnitude to score allows us to compare success across questions with different correct magnitudes.
Likelihood Estimation three operations: (A − B), (B − A), or (∆v) (isomorphic to B − A). Students draw their resultant vector in a provided gridded box. In contrast to Hawkins, these vectors are one-dimensional.[5] Each student was only asked one question on this topic, which followed a series of questions on vector products.Table 1 summarizes the differences between the questions, and figure 1 shows one question as the students saw it. The definition of ∆v was not provided to the students. In a follow-up question, many students were asked to decide which of the following (singly or in combination) were equal to ∆v: vi − v f , v f − vi , vi + v f . Irrespective of prior vector operation, the success rate on this question was 87% ± 5%. The alternative hypothesis that students do not know the mathematical definition of ∆v is not supported by the data from the follow-up question.
STATISTICAL ANALYSIS Responses across all questions were generally one of four variations: magnitude 8 or 2 (the result of adding or subtracting 5 and 3), to either the right or the left. In this paper, we focus on the magnitude data and not the direction data. A minority of responses were magnitude 7 or 9, which we counted as magnitude 8 because some students are imprecise artists. Similarly, very few responses with magnitude 1 or 3 are counted as magnitude 2. Together, magnitudes 8 ± 1 and 2 ± 1 account for 96% of
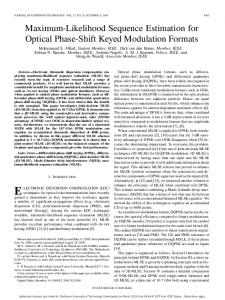
Our binomial model is based on the binomial likelihood function instead of the probability density function. Probability and likelihood are related, but they have crucial differences. Probability predicts unknown outcomes given known parameters. Conversely, likelihood estimates unknown parameters given known outcomes. For example, consider a case of flipping a coin 10 times to get 6 heads. The conventional probability is the chance of getting 6 heads assuming that the coin bias (chance of getting a single head or tail) is fixed. (The standard hypothesis H0 is that the coin is fair.) The likelihood is the chances of getting six heads as a function of all possible coin biases (from 100% heads to 100% tails). The Probability Density Function (PDF) for a random variable is a function that describes the probability for this random variable to occur in a given region in the observation space. As expected, the integral of the PDF must equal 1 because the sum of probability for all the outcomes in one trial should equal 1. In contrast, the integral of the likelihood function is not meaningful; the derivative is. This is because the derivative measures the relative chance of obtaining the observed result (e.g. 6 heads) from slightly different values of the underlying parameter(s). A large derivative (sharp peak) allows us to infer that the observation likely results from a narrow range of bias. A small derivative (broad peak) implies that the obsevation could likely result from a much larger range of biases. Figure 2 shows a plot of likelihood vs probability for
Magnitude
0.30
Binomial Likelihood
Determining the success parameter
0.15 0.00
0.05
0.10
Likelihood
0.20
0.25
AlignedAB AlignedBA AlignedV OpposedAB OpposedBA OpposedV
0.0
0.2
0.4
0.6
0.8
1.0
Probability of Success
FIGURE 2. Likelihood as a function of probability for each question. The shorter three curves in the middle are Aligned questions; the taller three curves on the right are Opposed questions. Magnitude
0.0
0.2
0.4
Score
0.6
0.8
1.0
Score
A-B
B-A
delta V
A-B
B-A
delta V
Question
FIGURE 3. Score on each question. The three questions on the left are Aligned questions; the three on the right are Opposed questions. Error bars represent one standard error using the conservative Clopper-Pearson method.
the six magnitude questions discussed in this paper. To read this graph, note that the horizontal axis represents the probability of success. For each curve, the peak of the curve (the “maximum” in Maximum Likelihood Estimation) corresponds to the observed frequency of success, as is expected in a binomial distribution[10]. In the coin example, this is 60% heads. In our data set, this is the score.
Parameters are properties of populations: the success parameter is the fraction of the total population which would succeed on these questions, were we to test the entire population. Likelihood allows us to estimate the population’s success parameter given our data. Narrow peaks correspond to well-determined parameters. The width of the binomial distribution curve corresponds to the uncertainty in each point. The height of the plot is determined by the value of the likelihood function, L. The variance, expressed as y/n2 − y2 /n3 , influences the width of the plot. Values of n influence the result more than values of y. For a given observed score, more trials result in shorter, narrower curves. This is consistent with our intuition that larger n better determines the success parameter, but inconsistent with our expectation that curves involving probability should conserve area. Again, the integral of the likelihood function is not meaningful, and our expectation of conserved area is misplaced. Using graphs of the binomial likelihood functions of different problems, we analyze the spread in likely probabilities for score on each question. From the probabilities of success, all six problems can be divided into 2 two groups: the rightmost group contains the Aligned problems which have a relative high probability of success, comparatively, and the leftmost group includes the Opposed problems, which have a relative low probability of success (though still about 50%). Precisely, in the rightmost group, all the three are statistically same because they have large overlap, especially problems AlignedAB and AlignedBA. The cognate problems in the Opposed set – OpposedAB and OpposedBA – also share a large overlap. The curve for problem OpposedAB is higher than the curve for problem OpposedBA because there are more trials of problem OpposedBA (as seen in Table 1). In contrast, problems OpposedBA and OpposedV, which differ only in context, do not overlap much at all; we conclude that they are different. These conclusions are also supported statistically. We use the Clopper-Pearson method, a conservative and exact method which does not assume an underlying normal distribution, to calculate our error[11]. Figure 3 is a more familiar plot of score vs question. In this plot, error bars correspond to one standard error. The difference in score on the aligned/opposed axis is probably not due to a fundamental misunderstanding of vector subtraction: note ceiling effects on the definition of ∆v follow-up question as well as the Aligned case. Rather, we suggest that the failure is in alternative methods which are faster, yet may be correct for some problems. Hawkins[5] notes that students use multiple methods to solve two-dimensional problems, some of which are more time-costly and/or technically correct
than others. Students may use fast heuristics which are more likely to be correct in the Aligned case than in the Opposed case.
Comparing two plot types The two types of plots provide complementary information, but the different representations make some features more apparent than others. The appearance of the bar plot makes score more visually compelling; on the likelihood plot, increased score means moving to the right, which is not necessarily as arresting to the gaze. However, the appearance of likelihood plot makes n and statistical differences more visually compelling. This is an important distinction. Too often, the appearance of the bar chart makes statistically insignificant differences between bars seem weighty. In a bar plot, the order of the bars is determined a priori by researchers. In a likelihood plot, questions group naturally by score: the horizontal axis is naturally meaningful. In our data, score clumps naturally by vector alignment; however, in principle clumping by one operation is not necessary. It is an accident of our data that the most highly scoring questions (on the right of the likelihood plot, tallest on the bar plot) are also the ones with the smallest numbers of respondents (and thus the highest on the likelihood plot); in general, this is not true.
DISCUSSION Prior research on the physics/mathematics context switch in one dimension focused on Opposed case[6]. We have replicated his results in our discussion of magnitude: OpposedBA and OpposedV are identical except for the context switch, and the curves are statistically different. These conclusions are supported if we consider the direction of the Opposed case as well. There are two additional wrinkles. When we consider the Aligned case, there is no statistical difference in either magnitude or direction for the math/physics context shift. This could be due to ceiling effects on the question; however, the presence of ceiling effects indicates that this question is not difficult for students in either context. A far larger effect is found between Opposed and Aligned questions. These two clumps of questions are quite different from each other. We represent our data in two ways: first, using the more traditional bar plot, and second, using the more feature-rich likelihood plot. The likelihood plot shows all of the information present in the bar plot; additionally, it makes statistical differences much more apparent and
does not rely on the researcher to manually order the horizontal axis. In PER, quantitative data usually take the form of samples drawn from a larger population, and researchers would like to draw conclusions about some parameter in the greater population. Probability assumes that population parameters are already known, and outcomes from data need to be estimated. Likelihood estimation is designed to estimate population parameters given known outcomes, and is better suited to the structure of our data.
ACKNOWLEDGMENTS The authors are grateful to Andrew Heckler, Thomas Scaife, and the members of the Ohio State University Physics Education Research Group for their work in collecting this data, and to Scott Franklin for his assistance in interpreting it. This research is partially supported by NSF CCLI Grant #0941378.
REFERENCES 1.
N. Nguyen, and D. E. Meltzer, American Journal of Physics 71, 630–638 (2003). 2. R. D. Knight, The Physics Teacher 33, 74–78 (1995). 3. S. Flores, S. E. Kanim, and C. H. Kautz, American Journal of Physics 72, 460–468 (2004). 4. P. S. Shaffer, and L. C. McDermott, American Journal of Physics 73, 921–931 (2005). 5. J. M. Hawkins, J. R. Thompson, and M. C. Wittmann, “Students Consistency of Graphical Vector Addition Method on 2-D Vector Addition Tasks,” AIP, 2009, vol. 1179, pp. 161–164. 6. J. Van Deventer, Comparing student performance on isomorphic math and physics vector representations, unpublished Master of Science in Teaching thesis, University of Maine, Orono, ME (2008). 7. W. Christensen, and J. Thompson, “Investigating Student Understanding of Physics Concepts and the Underlying Calculus Concepts in Thermodynamics,” in Proceedings of the 13th Annual Conference on Research in Undergraduate Mathematics Education, Mathematical Association of America, 2010. 8. E. C. Sayre, and A. F. Heckler, Phys. Rev. ST Phys. Educ. Res. 5, 013101 (2009). 9. A. F. Heckler, and E. C. Sayre, American Journal of Physics 78, 768–777 (2010). 10. A. W. F. Edwards, Likelihood, The Johns Hopkins University Press, 1992, expanded edition edn., ISBN 0801844436. 11. C. Clopper, and E. S. Pearson, Biometrika 26, 404–413 (1934).