JOURNAL OF LIGHTWAVE TECHNOLOGY, VOL. 27, NO. 20, OCTOBER 15, 2009
4583
Maximum-Likelihood Sequence Estimation for Optical Phase-Shift Keyed Modulation Formats Mohammad S. Alfiad, Student Member, IEEE, Dirk van den Borne, Member, IEEE, Fabian N. Hauske, Member, IEEE, Antonio Napoli, A. M. J. Koonen, Fellow, IEEE, and Huug de Waardt, Associate Member, IEEE
Abstract—Electronic chromatic dispersion compensation employing maximum-likelihood sequence estimation (MLSE) has recently been the topic of extensive research and a range of commercial products. It is well known that MLSE provides a considerable benefit for amplitude modulated modulation formats such as ON-OFF keying (OOK) and optical duobinary. However, when applied to optical phase modulation formats, such as differential phase-shift keying (DPSK) and differential quadrature phase-shift keying (DQPSK), it has been shown that the benefit is only marginal. This paper investigates joint-decision MLSE (JD-MLSE) detection applied to 10.7-Gb/s DPSK. It demonstrates that a JD-MLSE using the constructive and destructive components preserves the 3-dB optical signal-to-noise ratio (OSNR) advantage of DPSK over OOK in dispersion-limited optical systems. Furthermore, we demonstrate that the use of a shortened MZDI with MLSE for the 10.7-Gb/s DPSK modulation can equalize an accumulated chromatic dispersion of 4000 ps/nm. In addition, we discuss in this paper different MLSE schemes applied to 2 10.7-Gb/s DQPSK modulation. It is shown that a joint-symbol MLSE (JS-MLSE) on the balanced outputs of the in-phase and quadrature components gives the best performance. Index Terms—Differential phase-shift keying (DPSK), differential quadrature phase-shift keying (DQPSK), joint-decision MLSE (JD-MLSE), Mach–Zehnder delay interferometer (MZDI), maximum-likelihood sequence estimation (MLSE).
I. INTRODUCTION LECTRONIC DISTORTION COMPENSATION (EDC) techniques for optical telecommunications have recently gained a momentum as they improve the resilience against a number of significant propagation effects [e.g., chromatic dispersion (CD), polarization-mode dispersion (PMD), and narrowband filtering]. Among the various EDC techniques available, maximum-likelihood sequence estimation (MLSE) has showed itself as one of the more powerful [1]. MLSE provides excellent performance when combined with ON-OFF keying (OOK) [2]–[4] and duobinary modulation [5].
E
Manuscript received October 04, 2008; revised May 12, 2009. First published June 16, 2009; current version published August 28, 2009. M. S. Alfiad, A. M. J. Koonen, and H. de Waardt are with COBRA Institute, Eindhoven University of Technology, Eindhoven 5600 MB, The Netherlands (e-mail:
[email protected];
[email protected];
[email protected]). D. van den Borne and A. Napoli are with Nokia Siemens Networks, Munich D-81379, Germany (e-mail:
[email protected]; antonio.napoli@nsn. com). F. N. Hauske is with Federal Armed Forces University, Munich EIT-3, Germany (e-mail:
[email protected]). Color versions of one or more of the figures in this paper are available online at http://ieeexplore.ieee.org. Digital Object Identifier 10.1109/JLT.2009.2025148
Optical phase modulation formats, such as differential phase-shift keying (DPSK) and differential quadrature phase-shift keying (DQPSK), have been widely investigated in the recent years due to their favorable transmission characteristics. Unlike more traditional modulation formats, such as OOK, the information in D(Q)PSK is transmitted in the optical phase difference between two adjacent symbols. Hence, an equal optical power is transmitted in each bit slot, which enhances the robustness against bit-pattern-dependent nonlinear effects [6]. The main advantage of DPSK is however that, when combined with balanced detection, it has a 3-dB improvement in receiver sensitivity compared to modulation formats that use amplitude modulation to transfer the information [7], [8]. When conventional MLSE is applied to DPSK, both simulations [9] and experiments [3], [10] report that the 3-dB sensitivity advantage of DPSK over OOK disappears when CD becomes the dominating impairment. To overcome this problem, Cavallari et al. proposed in [11] the use of joint-decision MLSE techniques (JD-MLSE) for D(Q)PSK modulation. JD-MLSE is characterized by having more than one input into the MLSE function in order to provide it with additional information about the signal. This advance MLSE scheme has proved to enhance the MLSE symbols estimation when the constructive and destructive components of DPSK signal are used as the inputs [10]. Alternatively, in [12] and [13], we proposed another solution to enhance the efficiency of MLSE when combined with DPSK. This scheme includes combining a Mach–Zehnder delay interferometer (MZDI) that has a delay of less that one bit between its two arms, with a conventional balanced MLSE equalizer. We showed the ability of this technique to equalize an accumulated CD of up to 4000 ps/nm. As a multilevel modulation format, DQPSK can be used to increase the spectral efficiency compared to binary modulations. As DQPSK encodes 2 b/symbol, it requires only half the symbol rate of a binary modulation format for the same total bit rate [6]. This makes DQPSK less sensitive to linear transmission impairments such as CD and PMD. The CD and PMD tolerance of DQPSK can be further extended through MSLE, if the in-phase and quadrature phase tributaries of DQPSK are used as inputs [14]. This paper is organized as follows. Section II introduces the principle behind DPSK and DQPSK. In Section III, a short introduction to MLSE is given by explaining concepts such as histograms method and Gaussian model method, together with the idea of JD-MLSE. Section IV contains a detailed comparison of OOK-MLSE, and DPSK with single-ended, balanced and JD-MLSE, at a data rate of 10.7 Gb/s both using experimental
0733-8724/$26.00 © 2009 IEEE Authorized licensed use limited to: Eindhoven University of Technology. Downloaded on March 23,2010 at 09:49:47 EDT from IEEE Xplore. Restrictions apply.
4584
JOURNAL OF LIGHTWAVE TECHNOLOGY, VOL. 27, NO. 20, OCTOBER 15, 2009
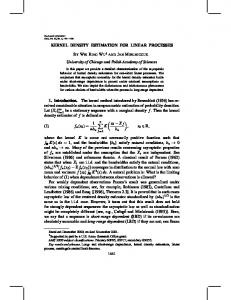
Fig. 1. DPSK modulator and eye diagram.
Fig. 3. DQPSK transmitter and receiver. Fig. 2. DPSK demodulator and the eye diagrams for the signals in each of its parts.
and simulations results. In the same section, the concept of the shortened MZDI (S-MZDI) with MLSE is introduced, and the results of the experiments and simulations applying it are discussed. Section V investigates three different MLSE schemes for the detection of 2 10.7-Gb/s DQPSK modulated signal. Finally, in Section VI, we draw the conclusions. II. ADVANCED OPTICAL MODULATION FORMATS DPSK modulation transmits the information in the optical phase difference between two adjacent symbols; having the value of either 0 or . The most common implementation of DPSK modulator is based on a Mach–Zehnder modulator (MZM) as reported in Fig. 1 [7]. Whenever the phase of the DPSK symbol is shifted by compared to the previous one, the output signal passes through the trough-point in the transfer function of the MZM. This is the cause of the intensity dips between adjacent symbols, depicted in Fig. 1. At the receiver, the signal is first passed through a Mach–Zehnder delay interferometer (MZDI). The MZDI extracts the information from the optical phase through interference between the two adjacent symbols. The MZDI splits the signal into two parts, delaying one part over a single symbol period , and afterwards recombining both parts. This results in two distinct outputs signals, namely, the constructive and destructive outputs. The constructive and destructive signals carry the same logical information, but with different polarities. Each of the two signals can, therefore, be used to extract the received signal. However, balanced detection of both signals doubles the sensitivity of the DPSK receiver [8]. The DPSK demodulator, including the MZDI and the balanced detector is shown in Fig. 2. The 3-dB sensitivity advantage of DPSK over OOK is one of its key advantages. Considering the constellation diagrams for
both OOK and DPSK, one can notice that for the same average output power the constellation points of DPSK are further apart compared to OOK [7]. In from each other by a factor of terms of optical power, this implies a factor of two difference between the constellation points which explains the 3-dB sensitivity advantage of DPSK. It has been shown in [3] that the 3-dB sensitivity advantage of DPSK over OOK is lost in the dispersion-limited regime. Using MLSE to compensate for CD shows the same behavior, making it less attractive to DPSK modulation. Section IV, therefore, proposes two schemes for efficiently combining MLSE with DPSK. Combined with the proper equalization scheme, DPSK might be a good candidate for next-generation high-performance 10-Gb/s optical systems. However, for data rates of 40 Gb/s or higher, the high baud rate makes it difficult to combine DPSK with digital signal processing, due to the limited speed of electrical receiver front-end (speed of analog-to-digital converters (ADCs) represents one of the main limitations). As a solution, DQPSK can be used. The lower symbol rate (i.e., 20 Gsymbols/s to modulate 40 Gb/s) alleviates the constraints on the electrical receiver front-end. The most widely used implementation of a DQPSK transmitter and receiver structure, as shown in Fig. 3, consists of two parallel DPSK modulators, with the output of one of them when both output signals are recombined. For shifted by demodulation, two parallel MZDIs are used, with a path-delay and a phase difference between its two arms of equal to and , respectively. This difference is necessary to demodulate either the (in-phase) or (quadrature) tributary of the DQPSK signal. However, demodulation of a DQPSK signal using an MZDI is suboptimal and results in crosstalk between the two tributaries. Consequently DQPSK loses 1–2 dB of its optical signal-to-noise ratio (OSNR) tolerance compared with DPSK at the same bit rate [7]. In Section V, three different experimental configurations of MLSE combined with DQPSK are tested in order to enhance its tolerance to CD. Simulations are also included to further validate the experimental results.
Authorized licensed use limited to: Eindhoven University of Technology. Downloaded on March 23,2010 at 09:49:47 EDT from IEEE Xplore. Restrictions apply.
ALFIAD et al.: MAXIMUM-LIKELIHOOD SEQUENCE ESTIMATION FOR OPTICAL PHASE-SHIFT KEYED MODULATION FORMATS
4585
III. MAXIMUM-LIKELIHOOD SEQUENCE ESTIMATION The inter symbol interference (ISI) resulting from CD deterministically distorts the optical pulses into specific shapes determined by the value of the neighboring pulses. This might be described using conditional probability density functions (pdfs), with the logical information of the surrounding symbols as the condition. Describing a sequence not as separate symbols but as conditional sequences can as well be used to explain the functionality behind MLSE. Taking a 2-b channel memory as an expossible combinations for the two biample, there will be nary symbols surrounding any symbol. In other words, a received logical “1” or “0” has four different conditional pdfs. To estimate a symbol, the MLSE algorithm first trains itself to build up the channel statistic. This is used to collect information about the channels conditional pdfs which are then used in maximizing the likelihood of making the right decision during symbol estimation. The MLSE estimation process is based on the Viterbi algorithm (VA) [15], [16]. The VA is implemented states by means of a trellis diagram (TD) that consists of states transitions, where is the alphabetic length with of the modulation format, and is the channel memory length. Each transition between states in the TD is associated with one of the pdfs of the channel. Two methods for MLSE estimation are currently in use, namely, the histograms method and the Gaussian model method [17]. The two techniques are discussed in Sections III-A and III-B, respectively. In Section III-C, the JD-MLSE is explained.
Fig. 4. MLSE histograms for a channel with (a) 0 ps/nm CD and (b) for 2000 ps/nm CD.
A. Histogram Method The histogram method calculates the corresponding discrete pdfs for all possible transitions on the TD. The received samples are quantized with a vertical resolution of bits, and the probability of occurrence of each state transition at each quantization level is counted. This information is stored in one discrete pdf, also here referred to as histogram. Two examples of MLSE histograms are depicted in Fig. 4 for back-to-back [Fig. 4(a)] and 2000 ps/nm of CD [Fig. 4(b)], respectively. The -axis shows the transitions in the TD for a channel with 2-b memory, while the -axis represents the quantization bins for the case of 4-b quantization resolution. The -axis shows the probability for each quantization bin/transition. The histograms can be converted into eight 2-D discrete pdfs, each of them representing one transition; this idea will be used later on to explain the principle of JD-MLSE. The histogram method looks for the sequence that satisfies the following condition: (1) where is the current received sample, is the number of successive symbols to be estimated, and is the probbelongs to the state ability that the current received sample can be read from the histransition . The value of togram [18]. In other words, the method aims at looking for the sequence of length that maximizes the total probability of belonging to a specific state for each sample in the sequence.
Fig. 5. JD-MLSE histogram for transition 010 at 2000-ps/nm CD.
B. Gaussian Model Method In the Gaussian model method, the MLSE assumes that the pdfs associated with a specific channel have Gaussian distributions [16]. Therefore, the only information needed from the training sequence is the mean value of each of the Gaussian pdfs. After training, these mean values are stored in a lookup table in order to be used with the VA. This method aims at looking for the sequence that minimizes the Euclidean distance defined as (2) where
is the th sample of the received sequence , is the mean value for the sample , which be[16], [19], and is the number of longs to state transition successive symbols to be estimated. If the mean value of state is the nearest to the sample , then the sample transition belongs to that state. Minimizing the sum of these distances for successive samples implies maximizing the probability that the sequence has been correctly estimated. The VA is again used to reduce the number of possible sequences to investigate.
Authorized licensed use limited to: Eindhoven University of Technology. Downloaded on March 23,2010 at 09:49:47 EDT from IEEE Xplore. Restrictions apply.
4586
JOURNAL OF LIGHTWAVE TECHNOLOGY, VOL. 27, NO. 20, OCTOBER 15, 2009
Fig. 6. DPSK and OOK experimental setup. PC: polarization controller, VOA: variable optical attenuator, OSA: optical spectrum analyzer, O/E: optical-to-electrical conversion, DSO: digital storage oscilloscope, HDR: hard decision receiver.
IV. MLSE COMBINED WITH DPSK
C. Joint-Decision MLSE The principle of the JD-MLSE is similar to the principle used in the histograms method, since both methods build discrete pdfs or histograms. The only difference between the conventional histogram method and the JD-MLSE is that JD-MLSE uses two input sequences instead of one. A JD-MLSE can thus be considered as a two-input–single-output receiver. For instance, in DPSK, the two inputs of the JD-MLSE are the constructive and destructive output ports of the MZDI. 3-D discrete pdfs instead of The JD-MLSE constructs the 2-D ones used in the histograms method. This can be visualized by displaying the histogram for each transition separately. Here, the -axis represents the quantization bins for the first input, while the -axis represents the quantization bins for the second input. The -axis gives the probability for each point in this 2-D plane. If the inputs are two different signals, carrying the same information, the joint decision will add another degree of confinement to the conditional pdfs. This results in a higher degree of certainty when calculating the total probability for a specific sequence of samples. An example of a 3-D pdf is depicted in Fig. 5, showing the pdf for the state transition 010 in a channel with 2-b memory length. The JD-MSLE maximizes the probability (3) and represent the th samples of the input sewhere quences and received on JD-MLSE input ports one and two, respectively, is the probability that samples and belong to , and is the length of sequence or [11]. When comparing JD-MLSE with the histogram-based conventional MSLE with respect to complexity, both methods are similar except for the size of the pdfs. The TD is still used in the same way and with the same complexity by the JD-MLSE. The hardware complexity of JD-MLSE is, therefore, comparable to the standard MLSE based on histograms (except for the need of another ADC for sampling the second input).
In this section, the performance of DPSK with an MLSE receiver is discussed. In Section IV-A, the measurement and simulation setups for the OOK and DPSK systems are described. In Section IV-B, first both the experimental and simulations results are discussed for a balanced MLSE (MLSE applied to the balanced output of a DPSK receiver) and compared to those of an MLSE applied to an OOK receiver. In the same section, the results of JD-MLSE applied to the constructive and destructive arms of the MZDI are reported and compared to the performance of the balanced MLSE receiver. Section IV-C explains a second concept to combine MLSE with DPSK modulation, namely, MLSE combined with a shortened MZDI. A. Measurement and Simulation Setup Fig. 6 shows the experimental setup to verify the performance of both DPSK and OOK modulation with an MLSE receiver. The performance is verified by measuring the required OSNR for a specific BER (all the OSNR values reported are measured within 0.1-nm resolution bandwidth). The DPSK and OOK signals are both generated by modulating the output of a distributed feedback (DFB) laser with an MZM. For DPSK modulation, the MZM is biased at the trough point and driven by a 10.7-Gb/s (PRBS ) data sequence with volts amplitude. For OOK modulation, the MZM is biased at the quadrature point and the data sequence has peak-to-peak amplitude of volts. At the receiver side, a variable optical attenuator (VOA) along with an erbium-doped fiber amplifier (EDFA) is used to vary the OSNR of the received signal. Afterwards the signal passes through an optical bandpass filter (OBPF) with a 3-dB bandwidth of 50 GHz. A second EDFA and OBPF ensure a constant power into the receiver. For OOK, the signal is detected with a single-ended photodiode. For DPSK, the signal is input to an MZDI, followed by a balanced photodetector. The MZDI used for the measurements in Section IV-B has a delay between both arms. Standard single-mode fiber (SSMF) and dispersion compensating fiber (DCF) with gradually increased lengths are used to vary the accumulated CD in a range of 3600 ps/nm. The
Authorized licensed use limited to: Eindhoven University of Technology. Downloaded on March 23,2010 at 09:49:47 EDT from IEEE Xplore. Restrictions apply.
ALFIAD et al.: MAXIMUM-LIKELIHOOD SEQUENCE ESTIMATION FOR OPTICAL PHASE-SHIFT KEYED MODULATION FORMATS
input optical power to the fiber is set to 0 dBm, in order to minimize the influence of fiber nonlinearity. At the receiver side, the output of optical/electrical conversion stage for both OOK and DPSK is input to both a hard-decision receiver (HDR) and digital storage oscilloscope (DSO) TDS 6804B with a sampling rate of 20 Gsamples/s. The resolution for the analog-to-digital converts at the input of the DSO is 8 b and effective number of bits at a frequency of 5.5 GHz is 3.6 b. The DSO has been used to store the signals for offline processing. The bandwidth of the DSO is 8 GHz, which is close to the optimum electrical filtering bandwidth for a 10.7-Gb/s data rate. To obtain a sample rate of exactly 2 samples/b, the stored signal is resampled to a sample rate of 21.4 Gsamples/s after recovering the reference clock phase using the digital filter and square timing recovery and loalgorithm [20]. The two samples are taken at cations of the symbol. The resampled sequence is subsequently used to determine the performance of an MLSE based on histograms with 4-b quantization resolution (the signal has been requantized in the offline algorithms), four-state Viterbi decoder and 2 samples/b. To establish the MLSE performance, data sequences of one million bits have been processed by the MLSE algorithm, in order to achieve an accuracy of 99% for a bit error [21]. No special training sequences were rate (BER) of symused for training the MLSE. Instead, the first bols from the received signal were utilized for building the histograms of MLSE. This training sequence is used for all MLSE algorithms discussed in this paper. The large number of training bits required refers to the fact that each of the histograms in MLSE contains a large number of points, and the probability for each of these points should be calculated during training. Therefore, using a large number of training bits guarantees that we have enough occurrences for each point in the histograms, which means a more reliable probability calculation. In real-time systems, however, some other special algorithms are used for building the histograms that reduces system’s complexity. One of these methods is the one used in [2] where the received signal is divided into separate blocks, and after estimating a block using MLSE, this block is used to construct the histograms for the following block. The experimental results of MLSE have been verified by simulations. Both DPSK and OOK modulations are modeled bits using a bit sequence with a block length of 512 b (a PRBS sequence that is repeated four times to obtain a total bits). Chromatic dispersion is subsequently block length of added to this signal through the linear Schrodinger equation. At the receiver, a data sequence with a length of one million bits is constructed from the received 512-b block, using the overlap and add method [22]. Additive white Gaussian noise is summed to the signal, which is subsequently filtered by a second-order Gaussian optical filter with a bandwidth of 50 GHz. After the optical-to-electrical conversion by photodiodes, the electrical signal is filtered using a tenth-order Bessel electrical filter with a bandwidth of 7 GHz. The output of the electrical filter is then sampled into two samples/b using an ADC with 4-b quantization resolution. The MLSE algorithm is subsequently implemented with exactly the same properties as described for the experimental verification.
Fig. 7. Required OSNR (BER 10 types.
4587
). OOK and DPSK, with different receiver
B. Joint-Decision MLSE The results of both HDR and MLSE for OOK and DPSK are displayed in Fig. 7, reporting the required OSNR to achieve a as a function of CD. As reported earlier [3], [10], BER of Fig. 7 clearly shows that the B-MLSE loses the sensitivity difference of DPSK over OOK, which is preserved when using an HDR. To investigate the 3-dB sensitivity loss, and in trying to retrieve it, four different DPSK receivers are considered, including a JD-MLSE applied to the constructive and destructive ports of the MZDI (based on histograms). The experimental setup for the four receivers is depicted in Fig. 8. First, the MLSE receiver, based on histograms, is applied to the constructive and destructive ports separately, which is referred to in this paper as single-ended MLSE (S-MLSE). As a reference, a balanced photodetector followed by an HDR is applied to the outputs of the constructive and destructive ports. The JD-MLSE used in this experimental verification assumes , hence the Viterbi decoder has a channel memory of four states, and eight transitions between the states. Therefore, it builds eight 3-D histograms similar to the one shown in Fig. 5. Fig. 9 compares the performance of the HDR with both JD-MLSE and B-MLSE for DPSK detection, confirming that B-MLSE gives no advantage with respect to the HDR in the presence of CD at 2-dB OSNR penalty, and a negligible advantage at higher CD values [3], [10]. On the other hand, at 2-dB penalty, JD-MLSE almost doubles the CD tolerance of DPSK. A 2-dB OSNR penalty is obtained for 2000 ps/nm of CD, compared to only 1100 ps/nm of CD for the HDR and B-MLSE receivers. Now, comparing the results of DPSK combined with JD-MLSE (Fig. 9) to OOK combined with MLSE (Fig. 7), it is evident that JD-MLSE preserves the 3-dB OSNR difference between DPSK and OOK. To understand the difference between B-MLSE and JD-MLSE, an S-MLSE is applied to both the constructive and destructive ports of the DPSK demodulator. Fig. 10 shows the results of S-MLSE for the two arms, and compares it to the B-MLSE. This clearly shows that the destructive port has a higher CD tolerance when compared to the constructive output port of the MZDI. This can be explained by noting that the constructive output port is an alternating mark inversion (AMI)-like
Authorized licensed use limited to: Eindhoven University of Technology. Downloaded on March 23,2010 at 09:49:47 EDT from IEEE Xplore. Restrictions apply.
4588
JOURNAL OF LIGHTWAVE TECHNOLOGY, VOL. 27, NO. 20, OCTOBER 15, 2009
Fig. 8. Different DPSK receivers.
Fig. 9. Required OSNR (BER 10
) DPSK and different receiver types.
Fig. 10. S-MLSE and B-MLSE at a BER 10
.
signal, whereas the destructive signal is a duobinary-like signal [7]. Duobinary is generally known for its high CD tolerance in comparison to other binary modulation formats. When the constructive and destructive ports are combined with balanced detection, the OSNR penalty will be dominated
Fig. 11. Simulations of the required OSNR for a BER of 10 OOK.
: DPSK versus
by the constructive port, which can be readily noticed by observing the B-MLSE behavior in Fig. 10. On the other hand, when both ports are input into a JD-MLSE receiver, the OSNR penalty is determined by the larger dispersion tolerance of the duobinary-like signal that is output by the destructive port. Fig. 11 shows the HDR and JD-MLSE simulation results for DPSK modulation, and compares them with OOK modulation. This again shows that JD-MLSE maintains the advantage in OSNR requirement of DPSK over OOK modulation. Comparing the experimental (Figs. 7 and 9) and simulation (Fig. 11) results, an excellent match between both can be observed for the B-MLSE. In the case of JD-MLSE, a good agreement between experiments and simulation at low CD has been obtained, while at high CD, a small difference can be noticed. With a high value of accumulated CD, the clock recovery partially fails due to the high distortion on the shape of the optical signal, which leads to a limited shift for the sampling instances. However, as is known from [23] for increasing values of dispersion, the performance of the MLSE becomes more sensitive to static deviation from optimum sampling phase (verified to
Authorized licensed use limited to: Eindhoven University of Technology. Downloaded on March 23,2010 at 09:49:47 EDT from IEEE Xplore. Restrictions apply.
ALFIAD et al.: MAXIMUM-LIKELIHOOD SEQUENCE ESTIMATION FOR OPTICAL PHASE-SHIFT KEYED MODULATION FORMATS
Fig. 12. Measured chromatic dispersion tolerance for HDR and offline MLSE with a delay of 0:5T and T .
4589
Fig. 13. Comparison between experimental and simulations results for different sampling instants with offline and real-time MLSE.
be and for non return to zero (NRZ) signals [23]), which explains the difference between experimental and simulation results. C. Conventional MLSE Combined With an S-MZDI In [24] and [25], it has been shown that using an MZDI with a delay of less that between both arms for demodulating the DPSK signal can considerably enhance the CD tolerance. In [12] and [13], we extended this concept by applying an MLSE to the balanced output of the S-MZDI, and showed that this can enable a CD tolerance of up to 4000 ps/nm at 2-dB OSNR penalty. In this section, we revise the recent results reported for the S-MZDI with MLSE, and we compare this technique with JD-MLSE. In order to verify the performance of an S-MZDI with MLSE, the DPSK setup depicted in Fig. 6 has been used. At the receiver, two different MZDIs are employed: an MZDI with a delay of between both arms, and an MZDI with a delay of (S-MZDI). Subsequently, the output of the balanced photodiode is used as an input signal for 1) a hard decision receiver, 2) a commercial MLSE receiver [2], or 3) a digital storage oscilloscope for offline processing. The commercial MLSE-receiver samples at 2 samples/b, with a 3-b vertical resolution and a four-state Viterbi decoder. For offline processing, the signal is resampled again to a sampling rate of 21.4 Gsamples/s, i.e., 2 samples/b. In order to have offline results that are comparable to the results of the real-time MLSE, the vertical resolution of the offline B-MLSE is reduced to 3 b, and the number of states is kept at four states. Finally, a BER tester is used for the HDR and real-time MLSE measurements. The measured CD tolerance in terms of the required OSNR (for a BER of ), for both HDR and the offline MLSE with a delay MZDI is depicted in Fig. 12. The conventional -delay MZDI with both the HDR and the B-MLSE receiver is shown as a reference. A comparison between the HDR and the B-MLSE receiver for the case of a -delay MZDI shows again the small performance improvement that is realized by combining DPSK modulation with an MLSE receiver. The -delay MZDI, on the other hand, shows a considerable improvement in term of CD tolerance, at the cost of moderately higher back-to-back OSNR requirement. Using a -delay MZDI combined with an MLSE receiver shows a flat OSNR requirement up to 3600 ps/nm of CD, and
Fig. 14. Offline and real-time MLSE sampling phase; eye diagrams after balanced photodiode.
4000 ps/nm of CD results in only a 2-dB penalty compared to the back-to-back performance. In [12], this CD tolerance is compared with the tolerance of duobinary modulation. The comparison further underlined the remarkable larger CD tolerance of this configuration. To show the feasibility of combining MLSE with a -delay MZDI, we compare in Fig. 13 the performance of a B-MLSE combined with offline processing with a commercial, real-time MLSE [2]. The real-time MLSE shows a slight OSNR penalty ( 2 dB) for low CD, but the same OSNR requirement for higher CD. This can be attributed to a difference in sampling phase between the two methods. In [25], it has been shown that due to the deterministic interference between consecutive symbols in the S-MZDI, the output is close to an inverted return-to-zero (RZ) signal. It is well known that an RZ signal is more sensitive to the choice of the sampling phase compared to NRZ. Since the real-time MLSE employed in the experiment is optimized for NRZ-OOK modulation, it samples the signal at the two instants and that represent a suboptimal part of the symbol period for an RZ-like signal. This results in our setup in a higher OSNR requirement, as shown in Fig. 14(a). On the other hand, Fig. 14(b) shows that in the CD-limited regime, the eye diagram loses its RZ shape, which makes the choice of the sampling instant less critical. This explains the convergence of the two curves for a CD in excess of 2500 ps/nm. In Fig. 14(a), one can notice that because the DPSK eye diagram with -delay MZDI is RZ-like, it has a high extinction ratio in the middle. Knowing that the HDR makes its decision in the middle point of the symbol period, one can expect that
Authorized licensed use limited to: Eindhoven University of Technology. Downloaded on March 23,2010 at 09:49:47 EDT from IEEE Xplore. Restrictions apply.
4590
Fig. 15. Required OSNR for a BER of 10 values; with MLSE.
JOURNAL OF LIGHTWAVE TECHNOLOGY, VOL. 27, NO. 20, OCTOBER 15, 2009
using MZDIs with different delay
this high extension ratio can alleviate the penalty from using delay MZDI instead of a conventional MZDI (with a a delay of ) in back-to-back configuration. Therefore, in going back to Fig. 12, one can understand the better performance for -delay the HDR compared to MLSE when combine to a MZDI at back-to-back configuration. In the case of S-MZDI with B-MLSE, simulations provide a higher degree of freedom in choosing some of the receiver parameters. Therefore, in the first simulation, the differential delay of the MZDI is varied between and in steps of in order to investigate its effect on the CD tolerance. After detection with a balanced photodiode, the electrical signal is filtered using a tenth-order 7-GHz electrical Bessel filter. The signal is then sampled with 2 samples/b, after which MLSE is applied. Fig. 15 depicts the influence of the MZDI delay on the CD tolerance of the DPSK system with MLSE. For the S-MZDI with MLSE, the CD tolerance improves with decreasing the delay value, but this comes at the cost of a higher back-to-back OSNR requirement. In order to optimize the CD tolerance, an MZDI delay in the range of – has to be utilized. On the other hand, such a delay causes a back-to-back OSNR penalty of almost 3 dB compared to conventional DPSK detected by an MZDI with a delay of . Consequently, a slightly higher delay represents the optimal tradeoff in order to reduce the back-to-back penalty while still obtaining the enhanced CD tolerance. The performance of the S-MZDI with different sampling instants is shown in Fig. 16. This figure shows the results of a -delay MZDI and MLSE, compared to a conventional MZDI. The -axis indicates the sampling instant of the first sample along the symbol period, whereas the second sample is taken at . This comparison shows that conventional DPSK with a -delay MZDI is not sensitive to the sampling phase in the absence of CD, which is similar to what has been reported for NRZ-OOK in [23]. But in the case of an MZDI with a delay of , the required OSNR is dependent on the sampling phase. We find that, as expected, the selection of the two samples at and at of the symbol (most of the information in RZ can be extracted from the middle of the symbol) results in the best sensitivity. On the other hand, and as we explained earlier, the dependence on sampling phase disappears at high inline CD.
Fig. 16. Effect of chosen sampling phase on MLSE performance.
In order to verify the assumption concerning the impact of sampling phase on the difference between offline and real-time MLSE measurements, we simulated a DPSK system with MZDI , and used the two sampling phases that has a delay of shown in Fig. 14 for its balanced output. It can be observed in Fig. 13 that the simulations with a suboptimal sampling phase ( and ) are nearly identical to the measured CD tolerance with the real-time MLSE for both low and higher CD. Note that the real-time MLSE receiver could be easily modified to sample at the optimal sampling point of the system employing the S-MZDI. We finally compare JD-MLSE and the combination of an S-MZDI with MLSE. Both techniques have shown a considerable increase in CD tolerance of DPSK. The major drawback of the combination S-MZDI with MLSE is the 2.5-dB higher back-to-back OSNR requirement. On the other hand, such a receiver can cope up with about 4000-ps/nm CD at a 2-dB OSNR penalty, while JD-MLSE can only tolerate around 2000 ps/nm. From a receiver complexity viewpoint, JD-MLSE requires two ADCs for the constructive and destructive ports, while the S-MZDI with MLSE requires only one ADC at the balanced output. V. MLSE COMBINED WITH DQPSK We now extend our analysis to the combination of DQPSK with MSLE. DQPSK modulation is particularly interesting for 40-Gb/s optical systems. However, since an experimental verification of 40-Gb/s DQPSK with MLSE was not possible, the results shown in this paper are scaled down to a 20-Gb/s DQPSK system (2 10 Gb/s). In this section, different MLSE receivers are combined with DQPSK modulation, in order to optimize the CD tolerance. In Section V-A, the measurement setup for the DQPSK system with the different detection techniques is discussed. Section V-B discusses the experimental results obtained, and compares the achieved enhancement on the system performance between the various MLSE techniques with reference to the HDR. Finally, Section V-C contains simulations results verifying the experimental results obtained in Section V-B. A. Measurement Setup Fig. 17 shows the experimental setup of the DQPSK transmitter and various MLSE receivers. The output of a DFB laser is modulated using an integrated super MZM structure for DQPSK
Authorized licensed use limited to: Eindhoven University of Technology. Downloaded on March 23,2010 at 09:49:47 EDT from IEEE Xplore. Restrictions apply.
ALFIAD et al.: MAXIMUM-LIKELIHOOD SEQUENCE ESTIMATION FOR OPTICAL PHASE-SHIFT KEYED MODULATION FORMATS
4591
Fig. 17. DQPSK experimental setup.
modulation. Both inputs of the super MZM are driven with a bits and a relative delay 10.7-Gb/s PRBS having a length of 8 b, in order to achieve a pseudorandom quaternary sequence (PRQS). At the receiver side, a VOA followed by an EDFA is used to set the OSNR of the received signal. After passing through an OBPF with a 3-dB bandwidth of 50 GHz, the received signal is input to a second EDFA and OBPF cascade to maintain a constant power to the receiver. The output signal is split into two parts by means of a 3-dB splitter, and afterwards input into two separate MZDIs, in order to generate the constructive and deand structive ports of the - and -components. The phase differences between the two MZDI arms are optimized using heating elements, which are controlled manually in this setup, with no feedback control loops. It has been proven mathematically in [27] that the DQPSK receiver is extremely sensitive to phase errors generated by these unstable two heating elements; this aspect results in some measurement variations as will be explained in Section V-C. Fig. 17 displays the four detection schemes applied to the outputs of the balanced detectors. In the first scheme, an HDR on the balanced outputs is used to obtain the reference measurement. For the other three schemes, the digital storage oscilloscope (DSO) has been used to store the - and -tributaries simultaneously. First, two identical MLSE equalizers applied separately to the balanced outputs of - and -tributaries (B-MLSE) have been considered. The MLSE has a 4-b quanfour-state tization resolution, 2-b channel memory (i.e., Viterbi decoder) and uses 2 samples/b. In a second step, a JS-MLSE has been considered with the same parameters as for the B-MLSE except for using 16-state Viterbi detwo-symbol channel memory (i.e., coder). JS-MLSE uses samples from the - and -balanced
outputs simultaneously to compute the branch’s metrics in the Viterbi decoder. For the joint-symbol MLSE (JS-MLSE) estimation two separate approaches have been applied. The first approach is based on building histograms as described in Section III-C. This method is referred to as histogram joint-symbol MLSE (HJS-MLSE), and it uses the formula stated in [11]. The second approach assumes the transmission channel has a Gaussian transfer function and depending on that it tries to minimize the Euclidean distance defined as (4) We refer to this method by Gaussian joint-symbol MLSE (GJS-MLSE). Equation (4) follows from (2), except for the term that is defined here as , where and are the samples from the - and -tributary, respectively. The Euclidean distance is minimized for successive symbols at sampling instants . The Gaussian model is just an approximation to the DQPSK signal statistics, but it has been shown in [28] that it can be a fair assumption for the distribution of the balanced - and -tributary outputs. Finally, two JD-MLSE equalizers, with the same properties as the one described in the DPSK section, have been applied separately to the - and -tributary. In this case, no information is exchanged between the joint MLSEs on - and -tributary. B. Experimental Results The OSNR penalty as a function of CD is shown in Fig. 18 for the different detection schemes. It is evident that the B-MLSE provides almost no advantage when compared to HDR. Nevertheless, B-MLSE used with DQPSK shows different behavior when compared to the one with DPSK. This can be referred
Authorized licensed use limited to: Eindhoven University of Technology. Downloaded on March 23,2010 at 09:49:47 EDT from IEEE Xplore. Restrictions apply.
4592
Fig. 18. Required OSNR for a BER of 10
JOURNAL OF LIGHTWAVE TECHNOLOGY, VOL. 27, NO. 20, OCTOBER 15, 2009
, for different DQPSK schemes.
to the 45 phase difference between the MZDI arms, which minimizes the difference between the constructive and destructive outputs. In the case of JD-MLSE, the system can tolerate 400 ps/nm more CD at an OSNR penalty of 2 dB in comparison to HDR. However, when combined with DPSK, JD-MLSE provides a better performance than when combined with DQPSK. This can again be attributed to the fact that in DQPSK the difference between the constructive and destructive ports is less than in the case of DPSK modulation, due to the use of the 45 phase difference between the MZDI arms. Finally, JS-MLSE provides the optimum performance with a CD tolerance of about 2000 ps/nm compared to only 800 ps/nm for the HDR (at a 2-dB penalty), resulting in a more than a factor of two improvements in CD tolerance. It can be observed that the HJS-MLSE and the GJS-MLSE show the same performance in this case. On the other hand, the complexity to store, update, and compute the branch metric is strongly reduced in the case of the Gaussian model. This can be attributed to the fact that only the mean value for each state is stored in the lookup tables of the GJS-MLSE, and only Euclidean distances are computed in the TD (i.e., lower computation complexity). The improvement provided by JS-MLSE can be attributed to its ability to recover the 1–2-dB OSNR sensitivity lost in DQPSK suboptimal phase demodulation [7]. This implies that JS-MLSE is the only MLSE technique able to reduce the cross talk between the - and -tributary, because it has access to information from both of them. C. Simulations Results The combination of the three MLSE receivers with DQPSK modulation is further analyzed with simulations. As described in Section IV, a block length of 512 b is used to simulate the impact of CD on the signal, whereas this is extended to one million bits at the receiver side using the overlap-and-add method. The ADC simulated at the receiver has 4-b quantization resolution and sampled the signal at a sampling rate of 2 samples/symbol. The optical and electrical filters used have the same characteristics as described in Section IV. Finally, the MLSE equalizers applied here have the same properties as those used in the experiments. Fig. 19 shows the results for the three MLSE schemes compared to HDR. The simulation results present a considerable match with what has been obtained experimentally. The
Fig. 19. DQPSK simulations: required OSNR for a BER of 10
.
B-MLSE provides only a negligible enhancement to the system performance, offering no more than 100-ps/nm improvement in CD tolerance at 2-dB OSNR penalty in comparison to the HDR. JD-MLSE shows a better performance and offers about 500 ps/nm more CD tolerance at 2-dB OSNR penalty. Finally, JS-MLSE provided again the best performance compared to the two other MLSE schemes, by offering two and a half times increase in the CD tolerance, using both the histograms and the Gaussian model methods. By comparing the experimental and simulated results, one can readily observe the consistency between them. Similar to what has been noticed in DPSK simulations with JD-MLSE, a small mismatch at high CD values is observed, which can be attributed to both the instability of the phase shifters in the MZDIs, and to the partial failure of the clock recovery method at high accumulated CD values. VI. DISCUSSION In this paper, different MLSE algorithms are used to optimize the performance of optical phase keyed modulation formats, by means of both experiments and simulations. We showed that a conventional MLSE failed to provide any significant advantage to the CD tolerance of DPSK over conventional direct detection with a hard threshold receiver. On the other hand, a JD-MLSE, which processes samples from the constructive and destructive ports of DPSK, proved to be capable of doubling the tolerance of DPSK against chromatic dispersion. Furthermore, we demonstrate that the use of an S-MZDI, which uses a path-delay shorter than one symbol, combined with a conventional MLSE offers for DPSK a significant improvement in terms of CD tolerance. However, this results at the same time in a reduced back-to-back OSNR tolerance. We found that the tradeoff between OSNR tolerance and CD tolerance is opti. mized for an MZDI delay of The combination of DQPSK with MLSE has shown that a JS-MLSE, which uses simultaneous samples from the in-phase and quadrature phase balanced outputs, provides the optimum performance. Using this scheme nearly triples the DQPSK CD tolerance. It is furthermore shown that a JS-MLSE can efficiently operate even if a simple Gaussian model is used for MLSE estimation.
Authorized licensed use limited to: Eindhoven University of Technology. Downloaded on March 23,2010 at 09:49:47 EDT from IEEE Xplore. Restrictions apply.
ALFIAD et al.: MAXIMUM-LIKELIHOOD SEQUENCE ESTIMATION FOR OPTICAL PHASE-SHIFT KEYED MODULATION FORMATS
REFERENCES [1] C. Xia and W. Rosenkranz, “Nonlinear electrical equalization for different modulation formats with optical filtering,” J. Lightw. Technol., vol. 25, no. 4, pp. 996–1001, Apr. 2007. [2] A. Farbert, S. Langenbach, N. Stojanovic, C. Dorschky, T. Kupfer, and C. Schulien, “Performance of 10.7 Gb/s receiver with digital equalizer using maximum likelihood sequence estimation,” in Proc. Eur. Conf. Opt. Commun., Stockholm, Sweden, 2004, Th4.1.5. [3] I. Polo, D. van den Borne, E. Gottwald, H. de?Waardt, and E. Brinkmeyer, “Comparison of maximum likelihood sequence estimation equalizer performance with OOK and DPSK at 10.7 Gb/s,” in Proc. Eur. Conf. Opt. Commun., Cannes, France, 2006, We2.5.3. [4] J. M. Gene, P. J. Winzer, S. Chandrasekhar, and H. Kogelnik, “Joint PMD and chromatic dispersion compensation using an MLSE,” in Proc. Eur. Conf. Opt. Commun., Cannes, France, 2006, We2.5.2. [5] J. P. Elbers, H. Wernz, H. Griesser, C. Glingener, A. Faerbert, S. Langenbach, N. Stojanovic, C. Dorschky, T. Kupder, and C. Schulien, “Measurement of the dispersion tolerance of optical duobinary with an MLSE-receiver at 10.7 Gb/s,” in Proc. Opt. Fiber Commun., Anaheim, CA, 2005, OThJ4. [6] K. P. Ho, Phase-Modulated Optical Communication Systems. New York: Springer-Verlag, 2005. [7] A. H. Gnauck and P. J. Winzer, “Optical phase-shift-keyed transmission,” J. Lightw. Technol., vol. 23, no. 1, pp. 115–130, Jan. 2005. [8] G. Charlet, “Progress in optical modulation formats for high-bit rate WDM transmissions,” IEEE J. Sel. Top. Quantum Electron., vol. 12, no. 4, pp. 469–483, Jul./Aug. 2006. [9] C. Xia and W. Rosenkranz, “Electrical dispersion compensation for different modulation formats with optical filtering,” in Proc. Opt. Fiber Commun., Anaheim, CA, 2006, OWR2. [10] M. S. Alfiad, D. van den Borne, F. N. Hauske, A. Napoli, A. M. J. Koonen, and H. De Waardt, “Robust detection of 10.7 G-b/s DPSK using joint decision maximum likelihood sequence estimation,” in Proc. Eur. Conf. Opt. Commun., Berlin, Germany, 2007, Th 9.1.2. [11] M. Cavallari, C. R. S. Fludger, and P. J. Anslow, “Electronic signal processing for differential phase modulation formats,” in Proc. Opt. Fiber Commun., Los Angeles, CA, 2004, TuG2. [12] M. S. Alfiad, D. van den Borne, A. Napoli, F. N. Hauske, A. M. J. Koonen, and H. de Waardt, “A 10.7-Gb/s DPSK receiver with 4000-ps/nm dispersion tolerance using a shortened MZDI and 4-state MLSE,” in Proc. Opt. Fiber Commun., San Diego, CA, 2008, OWT3. [13] M. S. Alfiad, D. van den Borne, A. Napoli, A. M. J. Koonen, and H. de Waardt, “A DPSK receiver with enhanced CD tolerance through optimized demodulation and MLSE,” IEEE Photon. Technol. Lett., vol. 20, no. 10, pp. 818–820, May 2008. [14] M. S. Alfiad, D. van den Borne, F. N. Hauske, A. Napoli, A. M. J. Koonen, and H. de Waardt, “Dispersion tolerant 21.4-Gb/s DQPSK using simplified Gaussian joint-symbol MLSE,” in Proc. Opt. Fiber Commun., San Diego, CA, 2008, OThO3. [15] T. Kupfer, C. Fludger, S. Langenbach, N. Stojanovic, C. Dorschky, and C. Schulien, “Digital equalization at 10.7 Gb/s using maximum likelihood sequence estimation- A present and future technology,” in Proc. IEE Seminar Opt. Fiber Commun. Electron. Signal Process., Dec. 2005, Ref. No. 2005-11310. [16] J. G. Proakis, Digital Communications, 4th ed. New York: McGrawHill, 2001. [17] O. E. Agazzi, D. E. Crivelli, and H. S. Carrer, “Maximum likelihood sequence estimation in the presence of chromatic and polarization mode dispersion in intensity modulation/direct detection optical channels,” in Proc. Int. Conf. Commun., Paris, France, 2004, pp. 2787–2793. [18] S. Savory, A. Napoli, B. Thomsen, P. Bayvel, and R. Killey, “Robust optical systems using maximum likelihood sequence estimators,” in Proc. IEE Seminar Opt. Fiber Commun. Electron. Signal Process., London, U.K., 2005, Ref. No. 2005-11310. [19] A. Napoli, S. Savory, B. C. Thomsen, V. Curri, P. Bayvel, and R. I. Killey, “Limits of maximum likelihood sequence estimation in chromatic dispersion limited systems,” in Proc. Opt. Fiber Commun., Anaheim, CA, 2006, JThB36. [20] M. Oerder, “Digital filter and square timing recovery,” IEEE Trans. Commun., vol. 36, no. 5, pp. 605–612, May 1988. [21] M. C. Jeruchim, “Techniques for estimating the bit error rate in the simulation of digital communication systems,” IEEE J. Sel. Areas Commun., vol. 2, no. 1, pp. 153–170, Jan. 1984. [22] M. C. Jeruchim, P. Balaban, and K. S. Shanmugan, Simulation of Communication Systems, 1st ed. New York: Plenum, 1992.
4593
[23] H. Griesser, J. Elbers, and C. Glingener, “On MLSE reception of chromatic dispersion tolerant modulation schemes,” in Optical Communication Theory and Techniques. New York: Springer-Verlag, 2005. [24] B. Mikkelsen, C. Rasmussen, P. Mamyshev, and F. Liu, “Partial DPSK with excellent filter and OSNR sensitivity,” Electron. Lett., vol. 42, no. 23, pp. 1363–1364, 2006. [25] Y. Lizé, L. Christen, X. Wu, J.-Y. Yang, S. Nuccio, T. Wu, A. E. Willner, and R. Kashyap, “Free spectral range optimization of return-to-zero differential phase shift keyed demodulation in the presence of chromatic dispersion,” Opt. Ex., vol. 15, no. 11, pp. 6817–6822, 2007. [26] D. van den Borne, G. D. Khoe, H. de Waardt, and E. Gottwald, “Bit pattern dependence in optical DQPSK modulation,” Electron. Lett., vol. 43, no. 22, pp. 1223–1225, Oct. 2007. [27] K. P. Ho, “The effect of interferometer phase error on direct-detection DPSK and DQPSK signals,” IEEE Photon. Technol. Lett., vol. 16, no. 1, pp. 308–310, Jan. 2004. [28] F. N. Hauske, B. Lankl, C. Xie, and E. D. Schmidt, “Iterative electronic equalization utilizing low complexity MLSEs for 40 Gbit/s DQPSK modulation,” in Proc. Opt. Fiber Commun., Anaheim, CA, 2007, OMG2. Mohammad S. Alfiad (S’05) was born in Zarqa, Jordan, in 1982. He received the M.Sc. in broad band telecommunication (cum laude) from the Eindhoven University of Technology, Eindhoven, The Netherlands, in 2007. His M.S. thesis research was conducted at Siemens AG in Munich, Germany. Currently, he is working towards the Ph.D. degree at the Eindhoven University of Technology in cooperation with Nokia Siemens Networks, Munich, Germany. His research focuses on digital signal processing and 100-Gb/s Ethernet for long-haul fiber-optic transmission systems.
Dirk van den Borne (S’04–M’09) was born in Bladel, The Netherlands, on October 7, 1979. He received the M.Sc. and Ph.D. degrees in electric engineering from the Eindhoven University of Technology, Eindhoven, The Netherlands, in 2004 and 2008, respectively. During his M.S. studies he has done research at Fuijtsu Laboratories, Ltd., Kawasaki, Japan and the Siemens AG, Munich, Germany. His Ph.D. research was conducted at Nokia Siemens Networks, Munich, Germany, in collaboration with the Eindhoven University of Technology. During his Ph.D. research, he focused on improvements in long-haul transmission systems using robust optical modulation formats, alternative dispersion compensation schemes, and electronic impairment mitigation. He is currently an R&D Program Manager at Nokia Siemens Networks, where he focuses on the optical system performance of next-generation transmission systems. He has authored and coauthored more than 70 peer-reviewed papers and conference contributions. Dr. van den Borne received the telecommunication award from the Royal Dutch Engineering Society (KIVI-NIRIA) and the IEEE/LEOS graduate student fellowship in 2007.
Fabian N. Hauske (S’04–M’07) received the Dipl.-Ing. degree in electrical engineering from the Munich University of Technology, Munich, Germany, in 2003. Currently, he is working towards the Dr.-Ing. degree at the Institute for Communications Engineering, University of the Federal Armed Forces, Munich, Germany, in collaboration with Nokia Siemens Networks GmbH & Co. KG. From 2000 to 2001, he was a visiting student at the University of Nottingham, U.K. In 2003, he carried out research at the Fuijtsu Laboratories, Ltd., Kawasaki, Japan, within the scope of his diploma thesis. His fields of interest cover digital signal processing algorithms for equalization and optical performance monitoring for next generation optical transmission systems.
Authorized licensed use limited to: Eindhoven University of Technology. Downloaded on March 23,2010 at 09:49:47 EDT from IEEE Xplore. Restrictions apply.
4594
Antonio Napoli was born in Cossato, Italy, in 1974. He received the M.S. degree in electronics engineering and the Ph.D. degree with a thesis on electronic equalization for advanced modulation formats from Politecnico di Torino, Italy, in 2002 and 2006, respectively. During his studies he was a visiting student at the Technical University Wien, University College London, and Universitat Politecnica de Catalunya. In 2006, he joined the R&D of Siemens which later merged into Nokia Siemens Networks, Munich, Germany, where he works on robust and tolerant design of optical communications systems. His interests cover the areas of digital signal processing, advanced modulation, forward error correction, and equalization.
A. M. J. Koonen, (M’00–SM’01–F’07) photograph and biography not available at the time of publication.
JOURNAL OF LIGHTWAVE TECHNOLOGY, VOL. 27, NO. 20, OCTOBER 15, 2009
Huug de Waardt (A’05) was born in Voorburg, The Netherlands, in December 1953. He received the M.Sc.E.E. and the Ph.D. degrees from the Delft University of Technology, Delft, The Netherlands, in 1980 and 1995, respectively. In 1981, he started his professional carrier in the Physics Department at PTT Research, Leidschendam, The Netherlands, where he worked on the performance issues of optoelectronic devices. In 1989, he moved to the Transmission Department and became involved in WDM high-bit-rate optical transmission. In 1995, he was appointed an Associated Professor at the Eindhoven University of Technology (TU/e), Eindhoven, The Netherlands, in the area of high-capacity trunk transmission. He coordinated the participation of TU/e in ACTS Upgrade, ACTS BLISS, ACTS APEX, and IST FASHION. He served as project leader of the national research initiative Freeband Broadband Photonics (2004–2008). He (co)authored over 150 conference and journal papers. His current interests are in high capacity optical transmission and networking, integrated optics, and semiconductor optical amplifiers/modulators.
Authorized licensed use limited to: Eindhoven University of Technology. Downloaded on March 23,2010 at 09:49:47 EDT from IEEE Xplore. Restrictions apply.