Article Geography
September 2010 Vol.55 No.26: 3023–3029 doi: 10.1007/s11434-010-3237-x
SPECIAL TOPICS:
May–June mean maximum temperature change during 1360–2005 as reconstructed by tree rings of Sabina Tibetica in Zaduo, Qinghai Province SHI XingHe1,2, QIN NingSheng1*, ZHU HaiFeng3, SHAO XueMei3, WANG QingChun2 & ZHU XiDe2 1
Institute of Plateau Meteorology, China Meteorological Administration, Chengdu 610072, China; Climate Date Center of Qinghai, Qinghai Meteorological Bureau, Xining 810001, China; 3 Institute of Geographic Sciences and Natural Resources Research, Chinese Academy of Sciences, Beijing 100101, China 2
Received November 30, 2009; accepted March 17, 2010
Based on tree-ring samples collected from Zaduo area in southern Qinghai Province, a 646-year ring-width series was established. Using response function, correlation function and partial correlation analysis we found that the ring-width series is sensitive most to May and June mean maximum air temperature at Zaduo meteorological stations and the correlation is significantly negative. Therefore, May–June mean maximum air temperature in Zaduo area since 1360 is reconstructed using this ring-width series. The regression equation was cross-validated in the calibration period of 1961–2005. The calibration equation can explain 59.8% of the total variance. Since high temperature could reinforce evapotranspiration and result in water stress, the high values are more reliable than the low values in the reconstructed series. By further analyzing upon the reconstructed series, it shows that on the inter-annual scale there are 6 periods with higher temperature: 1438–1455, 1572–1612, 1684–1700, 1730–1754, 1812–1829 and 1853–1886; while there are 5 periods with lower temperature: 1547–1571, 1701–1729, 1755–1777, 1830–1852 and 1887–1910. There is no significant rising of temperature in recent 50 years. By comparison with the rings-width series nearby which are also sensitive to the mean maximum air temperature and the mean maximum temperature reconstruction by ring-widths, it is found that the variation of inter-annual scale is fairly common in the region. tree rings, reconstruction, mean maximum temperature, Zaduo, Qinghai Citation:
Shi X H, Qin N S, Zhu H F, et al. May–June mean maximum temperature change during 1360–2005 as reconstructed by tree rings of Sabina Tibetica in Zaduo, Qinghai Province. Chinese Sci Bull, 2010, 55: 3023−3029, doi: 10.1007/s11434-010-3237-x
Previous studies [1,2] have shown that climate changes at the decadal scale over the Tibetan Plateau (TP) often preceded that in East Asia. However, sparse weather stations and short observation records over the plateau limit studies on the patterns of climate change. Therefore, there is a great need to use proxy data to reconstruct changes of various climatic elements during historical times. Tree-ring width data have been used widely in studies of past climate, which can be extremely useful in the TP region [3–5]. Many studies have been conducted over the TP using ice *Corresponding author (email:
[email protected])
© Science China Press and Springer-Verlag Berlin Heidelberg 2010
cores, lake deposits and other proxies to reconstruct characteristics of climate change during the past 2000 years [6–10]. Compared with other proxy data, tree ring data have the advantages of annual resolution, accurate crossdating, and continuity, and have long been highly prized by researchers in studies of environmental changes in the TP. Especially in the past 10 years, much progress [11–20] has been accomplished in reconstruction of climate change based on treering width data. These studies have filled the gaps of instrumental observations due to low station density and short data records, and contributed to a better understanding of full picture of climate change during historical times in the csb.scichina.com
www.springerlink.com
3024
SHI XingHe, et al.
Chinese Sci Bull
TP. However, just as pointed out by Jones et al. [21], more proxy data are necessary to obtain accurate information of climate change for the past millennium. The purpose of this study is to further expand the pool of proxy data for the historical climate change in the TP. In this study, we used tree-ring samples from Zaduo County of Qinghai Province to develop a standard ringwidth chronology. Based on the analysis of the relationship between ring-width index and climate variables, the May– June mean maximum temperature was reconstructed. We also analyzed the reconstructed series in order to build the baseline for future studies of historical climate change in the TP, which may also be used to support local governmental decision-making in establishing policies regarding the impact of climate change.
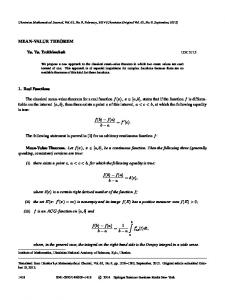
1 Materials and methods The tree-ring samples used in this study were obtained from old growth forest in Nangcai of Zaduo County in the headwater region of the Lancang/Mekong River. Tibetan juniper (Sabina tibetica Kom.) is the dominant tree species of the sparse forest in the elevation belt between 4100 m and 4500 m a.s.l. [22]. This is the highest forest community in Qinghai Province. The soil type is sparse forest meadow soil in its young stage. Due to harsh growth conditions on slopes of steep gradient and thin soil, the forest is typically of slow growth rate and low canopy coverage (0.14). The sampling site is undisturbed by human activities (Figure 1), located at 32°39'36"N, 95°'43'14"E with elevations of 4200–4230 m. We extracted 67 cores from 29 healthy trees with long ages. The samples are processed following the conventional procedures [23,24]. They were dried in room temperature, mounted and polished. Then individual rings were dated and then ring widths were determined at the 0.01 mm accuracy using a tree-ring width measurement system. The re-
Figure 1
Locations of tree-ring samples and meteorological stations.
September (2010) Vol.55 No.26
sulted ring-width data were analyzed using the COFECHA [25,26] to assess the quality of dating and ring measurement, and to check for any subjective errors. By examining the correlations between individual sample series and the master chronology, samples with too many outliers and those with very low correlations with the master chronology were eliminated. In the end, 46 cores from 23 trees (2 cores per tree) were selected to construct the ring width chronology using the ARSTAN program [27]. Comparisons suggested that common variation within the ring-width series might be best preserved by fitting a 100-year spline curve to remove growth trend and non-climatic signals. Therefore, a 100year spline was employed for detrending in this study. The standard (STD), residual (RES) and autoregressive standardization (ARS) chronology were obtained respectively through bi-weight mean estimation. In order to quantitatively assess the STD, common interval 1601–1900 for the detrended series was selected for computing serial correlation, mean sensitivity [24] and EPS [28]. The monthly climate data were from Zaduo meteorological station (32°54'N, 95°18'E, 4066.4 m) with records of mean temperature, mean maximum, mean minimum temperature, total precipitation, relative humidity, pan-evaporation, and sunshine duration running from 1961 through 2005. Homogeneity test was performed to ensure that no inconsistencies were present in the records due to relocation or equipment replacement. An examination suggested that the location of the meteorological station had never been migrated since it was established and that all equipments were supplied by China Meteorological Administration under strict quality control. Moreover, the observed records were also reviewed by experts from Qinghai Climate Center. Finally, the instrumental records were crosschecked with the gridded climate data [29] at grids 32.75°N, 95.25°E and 32.75°N, 95.75°E based on Mann-Kendall [30] and Double Mass [31] tests and a conclusion was reached that climate data are homogeneous and the variability was well expressed
SHI XingHe, et al.
Chinese Sci Bull
in the instrumental records. Correlation and response functions [24] used often in dendroclimatology were employed to explore the relationship between climate and radial growth. Correlation function is to calculate the Pearson correlation coefficient between the monthly climatic data and ring-width indices. The results could help to select the variable and season to reconstruct. Response function analysis is a regression technique applied to tree-ring data and climate variables and the regression coefficients is corresponding to the climate variables. Since a higher regression coefficient means the associated climate variable has a greater effect on radial growth, response function can be used to quantatively assess growthclimate relationship. Bootstrapping [32] with 500 iterations was performed to ensure significance of regression coefficients. Monthly climate data from previous October through current September were selected for correlation and response functions. To evaluate the effects of the selected climate variables on tree growth partial correlation analysis was also employed. By controlling the inter-correlation between climate variables, partial correlation coefficient could provide a reasonable and objective assessment of climategrowth relationship. All response function, correlation and partial correlation analyses were limited to the period 1961–2005. Based on the analysis of growth-climate relationship, climate variables and the group of months for which to reconstruct were determined [24]. Considering the lag effects of tree growth, ring-width indices of current year and the following year were chosen as the candidates to regress the selected climate variable. Stepwise regression was conducted with 95% confidence interval for the regression coefficient. The calibration equation was verified with cross-validation [33] based on sign test of the raw data, sign test of the first difference, t value of product mean, reduction of error, and correlation coefficient. In addition, variation tendency of the reconstructed series was also analyzed to reveal climate evolution for the past hundreds of years.
2
Results and discussion
2.1 Tree-ring chronology and its response to climate variables The STD was chosen in order to retain as much low-frequency signal as possible. Table 1 lists the statistics of STD for common interval 1601–1900. The chronology was characterized by a high sensitivity with a low standard deviation as well as a low ratio of missing rings. The first principal component accounted for 56.00% of the variance. The STD also displayed a high between-tree and within-tree correlation, as well as a high EPS. These statistics indicates that the STD preserves a great level of common variations and these variations can be well representative of that of the population. Based on a threshold of 0.85 of the subsample
3025
September (2010) Vol.55 No.26
Table 1
Statistics for common interval analysis (1601–1900)
Item Starting year Standard deviation Mean sensitivity Ratio of absent ring First-order autocorrelation Mean correlation between all series Mean correlation between trees Mean correlation within a tree Expressed population signal (EPS) % variance in 1st PC
ZD 1290 0.28 0.27 0.94 0.41 0.54 0.53 0.82 0.97 56.00
strength assessment [28], the chronology since 1360 was considered relatively reliable. Correlation analysis showed that the STD was significantly correlated most with May and June mean maximum temperature. Less significant correlations were observed between the STD and mean temperature, pan-evaporation, relative humidity, and sunshine duration in May and June. In addition, the STD is also correlated significantly with May precipitation, monthly minimum mean temperature of previous October and December, and mean temperature and sunshine duration in December (Table 2). If the mean maximum temperature in May and June were averaged, the correlation coefficient of it with the STD would be as high as –0.77 (α