JOURNAL OF INFORMATION SCIENCE AND ENGINEERING 31, 1593-1611 (2015)
MCL-3D: A Database for Stereoscopic Image Quality Assessment using 2D-Image-Plus-Depth Source* RUI SONG1,2, HYUNSUK KO2,+ AND C.-C. JAY KUO2 1
State Key Laboratory of Integrated Service Networks Xidian University Xián, 710071 P.R. China E-mail:
[email protected] 2 Ming Hsieh Department of Electrical Engineering University of Southern California Los Angeles, CA 90089-2564, USA E-mail: {kohyunsu; cckuo}@sipi.usc.edu
A new stereoscopic image quality assessment database rendered using the 2D-image-plus-depth source, called MCL-3D, is described and the performance benchmarking of several known 2D and 3D image quality metrics using the MCL-3D database is presented in this work. Nine image-plus-depth sources are first selected, and a depth image-based rendering (DIBR) technique is used to render stereoscopic image pairs. Distortions applied to either the texture image or the depth image before stereoscopic image rendering include: Gaussian blur, additive white noise, down-sampling blur, JPEG and JPEG-2000 (JP2K) compression and transmission error. Furthermore, the distortion caused by imperfect rendering is also examined. The MCL-3D database contains 693 stereoscopic image pairs, where one third of them are of resolution 1024*768 and two thirds are of resolution 1920*1080. The pair-wise comparison was adopted in the subjective test for user friendliness, and the Mean Opinion Score (MOS) were computed accordingly. Finally, we evaluate the performance of several 2D and 3D image quality metrics applied to MCL-3D. All texture images, depth images, rendered image pairs in MCL3D and their MOS values obtained in the subjective test are available to the public (http: //mcl.usc.edu/mcl-3d-database/) for future research and development. Keywords: stereoscopic images, 3D images, depth image based rendering, subjective quality, perceptual quality, image quality assessment, image quality database
1. INTRODUCTION Stereoscopic multimedia contents become popular nowadays. Since the multi-view image format [1] is costly for visual communication, the 2D-image-plus-depth format [2] is proposed as an alternative, where a texture image and its associated depth image are recorded at a view point simultaneously. For stereoscopic display, the depth image-based rendering (DIBR) technique is applied to the texture and depth images to generate the proper left- and right-views. The 2D-image-plus-depth format has a few advantages, including bandwidth efficiency, interactivity and 2D/3D video content switch, etc. [3]. A 3D video coding standard, called MPEG-C part 3[4], has been developed using the Multi-View-plus-Depth (MVD) format. In this work, we address the visual quality assessReceived August 28, 2014; revised December 22, 2014; accepted January 31, 2015. Communicated by Jar-Ferr Yang, C.-C. Jay Kuo, Hsueh-Ming Hang, Ming Ouhyoung and Chu-Song Chen. + Corresponding author: Hyunsuk Ko. * This work was supported by NSFC Grant No. 61401337, the 111 Project (B08038) and Fundamental Research Funds for the Central Universities.
1593
1594
RUI SONG, HYUNSUK KO AND C.-C. JAY KUO
ment problem using the 2D-image-plus-depth source. With the DIBR technology, the stereoscopic images rendered and displayed on the stereoscopic screen rely on the quality of texture images, depth maps and the rendering technology. Since discomfort caused by watching stereoscopic images may go beyond annoying and lead to psychological dizziness, we cannot over-emphasize the importance of the stereoscopic image/video quality assessment problem.
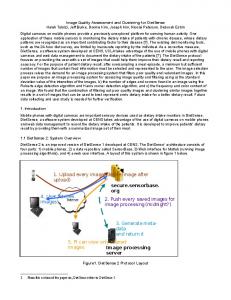
Fig 1. The processing flow of a stereoscopic visual communication system with the DIBR technology.
We show the processing flow of a stereoscopic visual communication system with the DIBR technology in Fig. 1. In this figure, ‘C’, ‘T’, ‘D’, and ‘R’ stand for ‘compression’, ‘transmission’, ‘decompression’ and ‘rendering’, respectively. At the encoder end, the texture and depth images captured at one viewpoint (or multiple viewpoints) are compressed and transmitted separately. At the decoder end, texture and depth maps are decoded and a pair of stereoscopic images can be rendered. Various distortion types can be introduced in each link of the communication system. The perceived quality of rendered stereoscopic images is of great interest to 3D display system and algorithm designers. To take the video capturing system as an example, additive white noise and Gaussian blur often arise in the image capturing process. The captured visual data can be fed into the media processor for pre- and post-processing. For a system using the DIBR technology, the quality of the rendered stereoscopic images is highly dependent on whether additive noise exists in the texture image or in the depth image. Another example is the measurement of the distortion caused by compression. Currently, the block-based compression scheme and PSNR-based rate-distortion algorithms are still the mainstream for 3D content delivery. However, the blocking effect has a distinct impact on rendered stereoscopic images when it appears in the texture image or the depth map. Therefore, the objective quality metric has to be reevaluated and/or redesigned to allow a better match between human visual experience and the predicted quality score. A suitable database containing subjective test results as the ground truth is essential to the development of a better objective quality metric of rendered stereoscopic images. In this work, we follow a similar process to build a stereoscopic image quality assessment database and consider a wide range of distortion types occurring in image capturing, compression, transmission and rendering. The resulting database is called the Media Communications Lab 3D (MCL-3D) Database.
MCL-3D: A DATABASE FOR STEREOSCOPIC IMAGE QUALITY ASSESSMENT
1595
Table 1. Summary of 3D image databases. LIVE_I 20
LIVE_II 8
IVC_3D IVC_DIBR_Image EPFL NB-SA NB-SS Scenes 6 3 10 10 12 Image 640360 640360 5124481 1024768 19201080 -2 -3 Resolution Blur, Hole filling Disparity JP2K, Gaussian Distortion Blur, White JPEG, JPEG, Blur, Types Fast-fading, Noise, JP2K, White noise, White Noise, JP2K, Blur, Gaussian JPEG, JPEG, JPEG, Blur JP2K White noise JP2K, Fast-Fading Distortion -5 -6 77 108 -2 -3 -4 Levels Total Num. 385 368 96 96 100 400 312 1. Image size is not identical in IVC 3D, 512448 is the mean value provided in the corresponding paper. 2. Horizontal size for the images in NB-SA is not identical, and the levels for different distortion types is not described explicitly. 3. Image size varies from 430x270 to 1024x768 in NB-SS, and the levels for different distortion types is not described explicitly. 4. Different distortion types have different levels in LIVE Phase I. 5. LIVE Phase II has complex level definitions for asymmetrical distortion types. 6. Different distortion types have different levels in IVC 3D database. 7. IVC DIBR database has 7 different hole-filling algorithms, taken as 7 distortion levels. 8. 10 camera configurations, taken as 10 distortion levels.
There are several publicly accessible stereoscopic image databases developed for the quality assessment purpose as listed in Table 1. Only symmetric distortions (i.e., the same distortion type and level) are applied to the left and right images in the LIVE Phase I database [5]. Non-symmetric distortions are considered in the LIVE Phase II database [6] as a generalization. The IVC 3D database [7] and the Ningbo stereoscopic image database with symmetric distortion (NB-SS) [8] are similar to LIVE Phase I yet with a different set of source images. One common concern with these three databases is that the resolution of stereoscopic images is low. Images of higher resolution are adopted by the IVC DIBR [9], EPFL databases [10] and the Ningbo stereoscopic image database with asymmetric distortion (NB-SA) [11]. One unique feature of the EPFL database is that it examines the effect of different disparity values on the resulting visual quality so as to develop a guideline on disparity selection. A similar yet more delicate work is given in [12], where the disparity effect on continuous video is analyzed so that some visual metrics can be fine-tuned for disparity selection in 3D films. The NB-SA database focuses on the visual experience when different distortion is only added on the right eye image. The IVC DIBR database examined the visual quality of rendered stereoscopic pairs with various rendering mechanisms. However, no transmission distortion is considered. Furthermore, distortions were imposed on binocular images directly, which has a more restricted application constraint. In contrast, distortions are applied to either the texture image or the depth image before stereoscopic image rendering in MCL-3D. The distortion types of consideration include: Gaussian blur, additive white noise, down-sampling blur, JPEG and JPEG-2000 (JP2K) compression and transmission error. The artifact caused by imperfect rendering is also considered. The pair-wise comparison was adopted in the subjective test to be
1596
RUI SONG, HYUNSUK KO AND C.-C. JAY KUO
friendly to viewers, and the Mean Opinion Score (MOS) was computed accordingly. All texture images, depth images, rendered image pairs and their MOS values obtained from the subjective test in MCL-3D are available to the public (http://mcl.usc.edu/mcl-3d-database/) for future research and development. The rest of this paper is organized as follows. The source data, the DIBR rendering process and distortions adopted by the MCL-3D database are detailed in Section 2. The human subject test process is presented in Section 3. Then, we compare several existing 2D and 3D objective image quality assessment methods against the MCL-3D database in Section 4. Finally, concluding remarks and future work are given in Section 5.
2. DESCRIPTION OF MCL-3D DATABASE 2.1 Stereoscopic Image Pair Synthesis System The stereoscopic image pair synthesis system used to create the MCL-3D database is shown in Fig. 2, where characters O, D and R denote the original input, distorted and rendered outputs, and subscript characters T, D and VL and VR denote the texture image, depth map, rendered left-view and right-view, respectively. First, the original texture image and its associated depth map of three views, denoted by (OT1, OD1), (OT2, OD2), and (OT3, OD3), are obtained by selecting key frames from 3DVC test sequences [13] and used as the input. Distortions of different types and levels were introduced to either the texture image or the depth map, and distorted texture images or depth maps are used as the input to the view synthesis reference software (VSRS) [14] to render the distorted stereoscopic image pair. For the DIBR distortion, we take the original source OT2 and OD2 as the input, and use four different rendering algorithms to generate the stereoscopic image pair. The VSRS offers a near-perfect stereoscopic image synthesis mechanism. If the original left- and right-views are given, the VSRS can output a near perfect rendered view in between. The rendered left-view and right-view using the original texture images and depth maps, denoted by RVL and RVR, will be taken as the reference for further analysis.
Fig 2. The block-diagram of the stereoscopic image pair synthesis system used to create the MCL3D database.
MCL-3D: A DATABASE FOR STEREOSCOPIC IMAGE QUALITY ASSESSMENT
1597
2.2 Image and Depth Source The quality of a database is highly dependent on reference images. The selected images should be representative and with sufficient diversity. In the MCL-3D database, we focus on the quality assessment of images rendered by DIBR technology. The test sequences used in the 3DVC standard can be good candidates, which provide a few multi-iew sequences associated with depth maps. All of these sequences were produced with professional equipment by the producer, and rectified before submission to the Joint Collaborative Team (JCT) [13, 15]. The quality of the test sequences were approved by JCT group members. We selected nine of them as the reference images in the MCL-3D database. The images were shown in Fig. 3, and the corresponding description and computed indicators were listed in Table 2. All the nine sequences were provided as uncompressed raw format. The bit depth for both texture images and depth maps are 8 bit. We extracted one frame from each sequence at the time slot with very slow motion while having a perceptible depth of field. The frame numbers along with other description used in MCL-3D were also listed in Table 2.
Fig. 3. Reference images in the MCL-3D database.
Among the nine selected images, ‘Kendo’ and ‘Balloon’ are from the Tanimoto Laboratory of Nagoya University, ‘Love_bird1’ is from the Electronics and Telecommunications Research Institute (ETRI), ‘Poznan_street’ and ‘Poznan_hall2’ are from the Poznan University of Technology, ‘Microworld’ and ‘Shark’ are from the National Institute of Information and Communications Technology, and ‘Gt_fly’ and ‘Undo_dancer’ are from the Nokia Corporation. The spatial resolution of the first three images is 1024*768 while that of the last six images is 1920*1088. The Spatial Information (SI) for each texture image, as defined by ITU-T recommendation P.910 [16]1, is calculated to demonstrate the variety of selected contents. The SI is also calculated for the depth map, called the depth spatial indicator (DSI) [17], to capture the characteristics of depth variation in the spatial domain. 1
The ‘max{}’ was not applied, since we only evaluate single frame.
RUI SONG, HYUNSUK KO AND C.-C. JAY KUO
1598
Table 2. Description and computed indictors of images used in MCL-3D database.
Kendo Balloon Love_bird1 Poznan_ street Poznan_hall2 Shark Microworld Gt_fly Undo_dancer
Owner & provider Nagoya1 Nagoya1 ETRI2 PUT3
Spatial Resolution 1024768 1024768 1024768 19201088
Camera space 5cm 5cm 3.5cm 13.75cm
Views Frame Source SI DSI No. Compression 1,3,5 3 No 45 25 1,3,5 3 No 43 32 4,6,8 3 No 57 8 5,4,3 239 No 58 23
PUT3 NICT4 NICT4 Nokia5 Nokia5
19201088 19201088 19201088 19201088 19201088
13.75cm CG2 CG CG CG
7,6,5 1,5,9 1,5,9 9,5,1 1,5,9
118 242 242 122 110
No No No No No
21 42 62 48 57
9 36 50 33 22
1. Nagoya University Tanimoto Laboratory, Japan. 2. Electronics and Telecommunications Research Institute, Republic of Korea. 3. Poznan University of Technology, Poznañ, Poland. 4. National Institute of Information and Communications Technology, Japan. 5. Nokia Corporation, Finland.
2.3 Distortion Types and Levels In a communication system that adopts the 3DVC coding standard, distortions may come from various stages such as image acquisition, compression, transmission and rendering. Gaussian blur and additive noise may occur in the acquisition stage. The image and the depth map may be down-sampled to accommodate multiple display devices before compression. For efficient transmission, all images should be compressed, which leads to blockiness and compression blur. Transmission errors may occur in the transmission stage. A rendering algorithm will be adopted to render multiple views for display. Some of these distortions were investigated before as shown in Table 1. We include distortions of all above-mentioned cases in the MCL-3D database.
Fig. 4. The entire processing flow and the corresponding distorted part for each database.
Based on the recommendations of ITU [16, 18, 19] and VQEG [20, 21], we consider five quality levels in subjective tests. The original reference stereoscopic images have the ‘excellent’ quality while the other 4-level distorted images were controlled by parameters corresponding to different distortion types. The distortion caused by imperfect rendering has not been well studied before. Typically, only the mid-view image and 2
CG is short for Computer Graphics.
MCL-3D: A DATABASE FOR STEREOSCOPIC IMAGE QUALITY ASSESSMENT
1599
its depth map are taken as the input, and a stereoscopic image pair is rendered using a hole filling technique. In our experiment, we take OT2 and OD2 as the input to generate the stereoscopic image pair. Distortion types are summarized in Table 3 and explained below. Gaussian Blur Many parameters have to be calibrated [10] during the acquisition of high quality stereoscopic images, wherein the focal length is a critical one. Texture images from any view will be blurred due to an improper focal length. Depth maps could be either acquired by equipment [22, 23] or estimated by depth estimation algorithms [24]. It was claimed by some researchers [2, 9] that the visual experience can be improved by applying some blur to the depth map before rendering. Its effectiveness can be studied using MCL-3D. We used ‘GaussianBlur()’ function in the OpenCV [25] library to add the Gaussian blur effect and controlled distortion levels by varying the standard deviation parameter of the kernel. Their values were set to 11, 21, 31 and 41 for four distortion levels. Additive White Noise In digital image capturing systems, CMOS or CCD sensors are used to capture R/ G/B color light intensities. The intensity is later transformed to the voltage and quantized to digital pixel values. Interference is ubiquitous in electronic circuits. It appears in form of additive white noise in the texture or depth image. The ‘randn()’ function in the OpenCV library was used to generate additive noise whose levels were controlled by selecting four standard deviation values (5, 17, 33 and 53). Down-sampling Blur To be adaptive to varying transmission bandwidth conditions, scalable video coding schemes have been proposed by researchers [26-28]. In these proposed schemes, the captured texture image or depth map will be down-sampled before compression. Another scenario is that the captured image may be down-sampled to fit a different spatial resolution requirement. We would like to acquire the ground-truth of such cases. The ‘resize()’ function in OpenCV is used for down-sampling and up-sampling. Four different downsampling blur levels with a sampling ratio of 5, 8, 11 and 14 were included. JPEG and JP2K Compression Compression is always applied to images and video to remove redundancy. The appearance caused by commonly used compression techniques is blockiness and loss of high frequency component. We applied JPEG and JP2K compression to source images as representative of such kind of distortion. For JPEG compression, we utilized the ‘imencode()’ function in OpenCV with four quality levels (30, 12, 8 and 5). For JP2K compression, we utilized the Kakadu [29] package with four compression parameters (200, 500, 900 and 1500) for four distortion levels. Transmission Error Transmission errors like packet loss or bit error is unavoidable over unreliable channels such as those in wireless networks. The error pattern is quite different from
RUI SONG, HYUNSUK KO AND C.-C. JAY KUO
1600
other regular distortion types. The transmission error distortion is added to evaluate the quality degradation under this scenario. We used the OpenJPEG library to encode source images and then applied unequal protection and error correction codes in the JPWL mode. Some bit errors were added to the compressed bit-streams. At the decoder side, the errors were partly corrected. With the assistance of protection methods, it is difficult to build a simple relationship between the bit-error rate and the visual quality of the decoded image. Thus, we used 80 seeds to generate a group of error-corrupted images and selected 4 from them to obtain 4 transmission error levels. Rendering Distortion Stereoscopic images were rendered based on the texture and the depth map images using the DIBR technology. Typical rendering errors include the black hole [30] and the boundary blur, which tend to appear with imperfect rendering techniques [9]. We selected several representative ones, including DIBR without hole filling [3], DIBR with filtering [2], DIBR with in-painting [31], and DIBR with hierarchical hole filling [3, 32, 33]. Table 3. Distortion generation mechanism and the associated level parameters. Distortion type
Method
Gaussian blur
‘GaussianBlur()’ in OpenCV
Additive white noise
‘randn()’ in OpenCV
Down-sampling blur
‘resize()’ in OpenCV
JPEG compression
‘imencode()’ in OpenCV
JPEG2000 compression Kakadu package Transmission error Rendering distortion
OpenJPEG lib with JPWL mode Different hole filling algorithms
Level parameters Standard deviation of the function kernel, 11, 21, 32 and 41 for 4 levels Standard deviation parameter, 5,17,33 and 53 for 4 levels Sampling ratio, 5, 8, 11 and 14 for 4 levels Quality level parameter, 30, 12, 8, and 5 for 4 levels Compression parameter, 200, 500, 900 and 1500 for 4 levels Different levels set by visual check 4 algorithms corresponding to 4 cases
3. SUBJECTIVE TEST For the subjective test, the test environment was set up according to the ITU recommendations [16] and a pairwise comparison method was adopted. Testing results were verified after the subjective test procedure. ITU and VQEG are two organizations working on the standardization of subjective test methods. Both of them have published recommendations on subjective test procedure for 2D images [19], 2D videos [16] and stereoscopic images [18, 34]. They can be roughly classified into four groups according to score levels and stimulus numbers as shown in Table 4. It was mentioned in [35, 36] that the continuous scale score does not improve the precision of test results. For the ACR and ACR-HR method, the same score may have a different meaning for a different assessor. Even for the same assessor, the rating criteria may vary along test time. Besides, it is difficult for assessors to differentiate weak impairments without explicit comparison. For this reason, we focus on methods with double stimulus and discrete scores.
MCL-3D: A DATABASE FOR STEREOSCOPIC IMAGE QUALITY ASSESSMENT
1601
Table 4. Recommendations for subjective test methods. Discrete Score Continuous Score Single Stimulus ACR1, ACR-HR2 SSCQE3 4 5 6 DSCQS9 Double Stimulus DCR , DSIS , CCR , DSCS7, PC8 1. 2. 3. 4. 5. 6. 7. 8. 9.
ACR: Absolute Category Rating. ACR-HR: Absolute Category Rating with Hidden Reference. SSCQE: Single stimulus continuous quality evaluation. DCR: Degradation category rating. DSIS: Double Stimulus Impairment Scale. CCR: Comparison Category Rating. DSCS: Double Stimulus Comparison Scale. PC: Pair Comparison. DSCQS: Double Stimulus Continuous Quality Scale.
Double stimulus methods give assessors two items which lead to an easier decision procedure. However, the 5 or 7 choices still confuse the assessor to some extent. It is somehow difficult to tell the relative quality is ‘about the same’, ‘slightly better’ or ‘better’. The pair comparison methods, which were introduced in [34], largely simplified the decision procedure. Its superiority to other method has been demonstrated in several experiments [9, 37-40]. Based on the above considerations, we adopted the pairwise comparison method in the MCL-3D database. The pairwise comparison method has solid mathematical foundation [41-43] and is extensively used for resource ranking and recommendation systems. Generally speaking, two stereoscopic image pairs are viewed by an assessor simultaneously and, then, the assessor selects the preferred one so as to assign a point score. The point score of a stereo image pair will accumulate across multiple rounds of pairwise competition, and the final point score is properly normalized to yield the final opinion score for the same assessor. The opinion scores of multiple assessors are averaged to result in the final mean opinion score (MOS) for each stereoscopic image pair. The subjective test environment is described below. The display equipment was 46.9'' LG 47LW5600. Assessors were seated 3.2 meters [18] away from the display screen and equipped with polarized glasses. The images were resized by the cubic function to fit the screen size before display, and the gap between two images was padded with grey levels as specified in [18]. During the comparison, both image pairs were resized simultaneously, and the relative quality difference was kept. With the pair comparison method, an assessor can point out slight difference between two items. The distortion levels were designed to make the quality gap large enough so that the resizing will not affect the pair comparison result. For each assessor, all 77 image pairs in one set were tested in one session. We developed a program with a proper GUI interface to control the quality assessment process for each assessor. The Swiss competition rule was applied for pair selection [9]. We set up 9 tours where stereoscopic image pairs with the same point score were compared in the same tour. The winning pair received one point while the losing pair received no point. Consequently, the cumulative point scores of all image pairs range from 0 to 9 after 9 tours. Before the subjective test, as a regular procedure, the assessors were tested to have normal ocular visual acuity and color vision, and stereopsis and binocular acuity tests according to [18] Annex 1 were also conducted. All the assessors passed these tests.
1602
RUI SONG, HYUNSUK KO AND C.-C. JAY KUO
For each assessor, the actual test time ranged from 12 to 15 minutes, which complies with the recommendation in ITU-R Rec. BT.500 [19]. After the subjective test, we conducted a short interview with the assessor for their evaluation experience. The assessors were students from the University of Southern California in USA. Among the 270 assessors, there were 170 males (63%) and 100 females (37%). In order to investigate the score difference between experts and non-experts, we asked assessors about their familiarity on stereoscopic images. Among them, 34 (or 13%) were experts and 236 (or 87%) were non-experts. The age distribution of the assessors is given in Fig. 5.
Fig. 5. The age distribution of assessors.
We collected 30 opinion scores for each distorted image pair. The subjective test results were further filtered by a screening process [19]. Since the standardization of the screening process for pair comparison results has not been published, and the existing screening method only fits for a specified subjective test method, we checked the test results following the existing specifications as much as possible. In building the MCL3D database, the highest 10% and the lowest 10% scores for each image were treated as outliers and discarded. The final MOS was calculated as the mean of remaining 24 opinion scores. The recommended number of assessors is 15 by ITU [19] and 24 by VQEG [9] for images. Bosc [9] tested the number of assessors for the subjective test for synthesized 3D view and concluded that the minimum number is 32 for ACR and less than 24 for pairwise comparison. Thus, our MOS calculation does meet the requirements of all above recommendations. The final MOS for each stereoscopic image pair in the MCL-3D database is shown in Fig. 6. The averaged MOS with respect to a specific distortion type is shown in Fig. 7, where 1 to 24 are with the distortion only on the texture part, 25 to 48 are with the distortion only on the depth part, 49 to 72 are with the distortion on both parts, and 73 to 76 are results obtained by four different rendering algorithms. The distortion types are arranged from the lowest degree to the highest degree according to the following order: 1) additive noise, 2) Gaussian blur, 3) JP2K compression, 4) JPEG compression, 5) downsampling blur, and 6) transmission loss. In other words, No. 1-4 are with additive noise from the lowest degree to the highest degree. No. 5-8 are with Gaussian blur from the lowest degree to the highest degree, and so on.
MCL-3D: A DATABASE FOR STEREOSCOPIC IMAGE QUALITY ASSESSMENT
1603
Fig. 6. MOS for MCL-3D stereoscopic image pairs.
Fig. 7. Averaged MOS for different distortion types.
It is observed that, when the distortion is on the depth part, the blur-like distortions such as the Gaussian blur, JP2K, JPEG and down-sampling blur (Image #29-44) do not harm image quality much. In contrast, additive white noise (Image # 25-28) and transmission loss (Image #45-48) on the depth image is more critical. They damage the whole rendered image through the DIBR process. When the same distortion level is applied to the texture part and the depth part, the distorted texture image is more obvious to human eyes so that its MOS is lower. A summary of the MCL-3D database is given in Table 5. Table 5. Summary of MCL-3D database. Main Characters Scenes Image resolution Distortion types
Distortion levels Total num. of image pairs Subjective test method No. of assessors Scale of MOS
MCL 3D database 9 6 with 19201080 3 with 1024768 Gaussian blur, Down-sampling blur, Additive white noise, JPEG compression, JP2K compression, Transmission error, Rendering algorithm 4 693 pair comparison 270 0...9
RUI SONG, HYUNSUK KO AND C.-C. JAY KUO
1604
4. PERFORMANCE COMPARISON OF OBJECTIVE QUALITY INDICES In this section, we compare the performance of several objective quality indices against the MCL-3D database. 4.1 Performance of 2D IQA Indices There are quite a few 2D image quality assessment methods proposed in literature [44]. Traditionally, image distortion indices focus on fidelity by measuring the exact difference between the distorted and the reference images; e.g. the mean-squared error (MSE), the Peak Signal to Noise Ratio (PSNR), etc. The fidelity concept has been scrutinized and challenged by researchers recently. New image quality indices were proposed. Examples include the Noise Quality Measure (NQM) [45], the Universal Quality Index (UQI) [46], the Structural Similarity Index (SSIM) [47], the Multi-scale Similarity Index (MS-SSIM) [48], the Feature Similarity Index [49], the visual information fidelity (VIF) [50], the pixel-based VIF (VIFP) [50], the visual signal-to-noise ratio (VSNR) [51], the image fidelity criterion (IFC) [52], PSNR-HVS [53] and C4 [54]. We applied these quality indices to the left- and the right-views of the stereoscopic image pairs and obtained their mean as the quality score. We conducted this test on the MCL-3D database as well as two other stereoscopic image databases; namely, LIVE Phase I [49] and IVC 3D [7]. The Pearson Correlation Coefficient (PCC) and the Spearman rank order correlation coefficient (SROCC) between the MOS and the objective scores are shown in Table 6. We see that both the PCC and SROCC values of these indices are less than 90% against MCL-3D. There is certainly room for further improvement for the algorithms. Table 6. Performance comparison of 2D objective quality indices applied to MCL-3D, LIVE Phase I and IVC databases. Metric
MCL-3D PCC
SROCC
LIVE Phase I PCC
SROCC
IVC PCC
SROCC
C4
0.8683
0.8690
0.9078
0.9144
0.7874
0.7304
IFC
0.7395
0.7398
0.5466
0.9071
0.7051
0.6135
MS_SSIM
0.8656
0.8763
0.7382
0.6093
0.7676
0.6919
NQM
0.8684
0.8694
0.8349
0.8461
0.6816
0.5973
PSNR_HVS
0.8783
0.8857
0.7563
0.8042
0.7089
0.6374
PSNR
0.8320
0.8405
0.6482
0.6529
0.5843
0.5554
SSIM
0.7654
0.7834
0.6977
0.6616
0.6817
0.6478
UQI
0.7372
0.7551
0.9007
0.8974
0.5706
0.5244
VIFP
0.7770
0.7897
0.8266
0.8681
0.7355
0.6869
VIF
0.7762
0.7929
0.8883
0.9002
0.7971
0.7083
VSNR
0.8289
0.8370
0.7317
0.7847
0.6723
0.6110
MCL-3D: A DATABASE FOR STEREOSCOPIC IMAGE QUALITY ASSESSMENT
1605
4.2 Performance of 3D IQA Indices Several IQA indices have been developed to target at stereoscopic image pairs. Campisi [55] conducted a preliminary test on the acuity difference between different eyes and found no apparent difference. Ryu [56] proposed an extended version of the SSIM index based on a binocular model. Their index uses a fixed set of parameters and is not adaptive to asymmetric distortions. Ko [57] introduced the structural distortion parameter (SDP), which varies according to different distortion types. The SDP was employed as a control parameter in a binocular perception model to provide robust QA results for both symmetric and asymmetric distortions. Gorley [58] used the difference of relative contrast between the reference image pair and distorted image pair to derive the quality index. Benoit[7] extracted the disparity maps from both the reference and the distorted image pairs, calculated the distortion between them, and integrated it with other factors to form the final quality index. Sazzad [59] exploited the disparity map and performed several integration methods to derive the quality index. We evaluated four indices against the MCL-3D, the LIVE Phase I, and the IVC databases, i.e., Method A [56], Method B [7], Method C [55], Method D [57]. The PCC and SROCC results are shown in Table 7. We see that these 3D IQA indices do not show much superiority over 2D IQA indices. How to derive a better 3D IQA index is still a challenging problem. Table 7. Benchmarks of 3D quality assessment metrics. Metric Method A Method B Method C Method D
MCL-3D PCC SROCC 0.8419 0.8503 0.7545 0.7672 0.8683 0.8690 0.8910 0.8880
LIVE Phase I PCC SROCC 0.6775 0.6075 0.8174 0.8493 0.9067 0.9133 0.9080 0.9050
IVC PCC SROCC 0.7579 0.6869 0.2851 0.4916 0.7873 0.7295 0.8410 0.8030
5. CONCLUSION AND FUTURE WORK 3D technology is on its way to become a norm, and consumers have a strong demand on high quality 3D contents. The process of 3D content making demands strenuous efforts. One of the key problems is the assurance of perceptual quality. Multi-view video plus depth is regarded as the core technology for the next generation 3D broadcasting system. Nevertheless, the quality metric issues have not been well addressed for this technology. The appearance of rendered stereoscopic images is quite different from that of 2D images. New metrics have to be developed to solve this problem. However, there was no prior image database designed for the DIBR technology. In this work, a detailed description of a stereoscopic image quality assessment database called MCL-3D was given, and the performance benchmarking of several known 2D and 3D image quality metrics using the MCL-3D database were presented. Distortions applied to the texture image or the depth image before stereoscopic image rendering included Gaussian blur, additive white noise, down-sampling blur, JPEG and JPEG-
1606
RUI SONG, HYUNSUK KO AND C.-C. JAY KUO
2000 (JP2K) compression and transmission error. Subjective tests conforming ITU recommendations were conducted, and the paired comparison method was used to obtain reliable mean opinion scores. Furthermore, we evaluated the performance of several 2D and 3D image quality metrics applied to MCL-3D. The MCL-3D database is available to the public for future research and development. It can be used for in-depth study on 3D perception of the human visual system as well as the design and performance evaluation of 3D content delivery systems.
ACKNOWLEDGEMENT This project is funded by the China Scholarship Council, Natural Science Foundation of China under contracts 61401337, Fundamental Research Funds for the Central Universities, the 111 Project (B08038) and the Samsung Advanced Institute of Technology. The author would like to thank Mathieu Carnec [54], Mashhour M. Solh [3, 32, 33] and Seungchul Ryu [56] for providing their codes to test the MCL-3D database. Computation for the work described in this paper was supported by the University of Southern California Center for High-Performance Computing and Communications.
REFERENCES 1. P. Merkle, K. Muller, A. Smolic, and T. Wiegand, “Efficient compression of multiview video exploiting inter-view dependencies based on H.264/MPEG4-AVC,” in Proceedings of IEEE International Conference on Multimedia and Expo, 2006, pp. 1717-1720. 2. C. Fehn, “Depth-image-based rendering (DIBR), compression and transmission for a new approach on 3D-TV,” in Proceedings of SPIE The International Society for Optical Engineering, 2004, pp. 93-104. 3. M. Solh and G. Alregib, “Hierarchical hole-filling for depth-based view synthesis in FTV and 3D video,” IEEE Journal on Selected Topics in Signal Processing, Vol. 6, 2012, pp. 495-504. 4. W. H. A. Bruis, C. Varekamp, R. K. Gunnewiek, B. Barenbrug, and A. Bourge, “Enabling introduction of stereoscopic (3D) video: Formats and compression standards,” in Proceedings of International Conference on Image Processing, 2007, pp. I89-I92. 5. A. K. Moorthy, C. C. Su, A. Mittal, and A. C. Bovik, “Subjective evaluation of stereoscopic image quality,” Signal Processing: Image Communication, Vol. 28, 2013, pp. 870-883. 6. M. J. Chen, C. C. Su, D. K. Kwon, L. K. Cormack, and A. C. Bovik, “Full-reference quality assessment of stereopairs accounting for rivalry,” Signal Processing: Image Communication, Vol. 28, 2013, pp. 1143-1155. 7. A. Benoit, P. L. Callet, P. Campisi, and R. Cousseau, “Quality assessment of stereoscopic images,” EURASIP Journal on Image and Video Processing, Vol. 2008, 2008, pp. 1-13. 8. J. Zhou, G. Jiang, X. Mao, M. Yu, F. Shao, Z. Peng, and Y. Zhang, “Subjective quality analyses of stereoscopic images in 3DTV system,” in Proceedings of Interna-
MCL-3D: A DATABASE FOR STEREOSCOPIC IMAGE QUALITY ASSESSMENT
1607
tional Conference on Visual Communications and Image Processing, 2011, pp. 1-4. 9. E. Bosc, R. Peepion, P. L. Callet, M. Koppel, P. Ndjiki-Nya, M. Pressigout, and L. Morin, “Towards a new quality metric for 3-D synthesized view assessment,” IEEE Journal on Selected Topics in Signal Processing, Vol. 5, 2011, pp. 1332-1343. 10. L. Goldmann, F. D. Simone, and T. Ebrahimi, “Impact of acquisition distortions on the quality of stereoscopic images,” in Proceedings of the 5th International Workshop on Video Processing and Quality Metrics for Consumer Electronics, 2010, pp. 1-6. 11. X. Wang, M. Yu, Y. Yang, and G. Jiang, “Research on subjective stereoscopic image quality assessment,” in Proceedings of SPIE Multimedia Content Access: Algorithms and Systems III, Vol. 7225, 2009, pp. 725509-10. 12. A. Voronov, D. Vatolin, D. Sumin, V. Napadovsky, and A. Borisov, “Methodology for stereoscopic motion-picture quality assessment,” in Proceedings of SPIE-IS and T Electronic Imaging Stereoscopic Displays and Applications XXIV, Vol. 8648, 2013, pp. 864810. 13. ISO/IEC JTC1/SC29/WG11, “Call for proposals on 3d video coding technology, N12036,” in MPEG of ISO/IEC JTC1/SC29/WG11, Geneva, Switzerland, March, 2011. 14. ISO/IEC JTC1/SC29/WG11. “Report on experimental framework for 3d video coding, N11631,” in ISO/IEC JTC1/SC29/WG11, Guangzhou, China, 2010. 15. D. Rusanovskyy, K. Muller, and A. Vetro, “Common test conditions of 3dv core experiments,” in JCT3V-C1100, Joint Collaborative Team on 3D Video Coding Extension Development of ITU-T SG 16 WP 3 and ISO/IEC JTC1/SC29/WG11, 1st Meeting, Stockholm, SE, 2013, pp. 8. 16. ITU, Recommendation ITU-T P.910, “Subjective video quality assessment methods for multimedia applications,” Technical Report, No. ITU-T, Geneva, 1996. 17. M. Urvoy, M. Barkowsky, R. Cousseau, Y. Koudota, V. Ricorde, P. L. Callet, J. Gutierrez, and N. Garcia, “NAMA3DS1-COSPAD1: Subjective video quality assessment database on coding conditions introducing freely available high quality 3D stereoscopic sequences,” in Proceedings of the 4th International Workshop on Quality of Multimedia Experience, 2012, pp. 109-114. 18. ITU-R, “Subjective assessment of stereoscopic television pictures,” Technical Report, No. Rec ITU-R BT.1438, 2000. 19. ITU, “Methodology for the subjective assessment of the quality of television pictures,” Technical Report, No. BT.500-11, 2002. 20. Video Quality Expert Group (VQEG), “Final report from the video quality experts group on the validation of objective models of video quality assessment, phase I,” http://www.its.bldrdoc.gov/vqeg/projects/frtv-phase-i/frtv-phase-i.aspx, 2000. 21. Video Quality Expert Group (VQEG), “Final report from the video quality experts group on the validation of objective models of video quality assessment, phase II,” http://www.its.bldrdoc.gov/vqeg/projects/frtv-phase-ii/frtv-phase-ii.aspx, 2003. 22. S. Izadi, D. Kim, O. Hilliges, D. Molyneaux, R. Newcombe, P. Kohli, J. Shotton, S. Hodges, D. Freeman, A. Davison, and A. Fitzgibbon, “Kinect fusion: real-time 3d reconstruction and interaction using a moving depth camera,” in Proceedings of the 24th Annual ACM Symposium on User Interface Software and Technology, 2011, pp. 559-568.
1608
RUI SONG, HYUNSUK KO AND C.-C. JAY KUO
23. H. Du, P. Henry, X. Ren, M. Cheng, D. B. Goldman, S. M. Seitz, and D. Fox, “Interactive 3D modeling of indoor environments with a consumer depth camera,” in Proceedings of the 13th International Conference on Ubiquitous Computing, 2011, pp. 75-84. 24. M. Tanimoto, T. Fujii, K. Suzuki, N. Fukushima, and Y. Mori, “Depth estimation reference software (DERS) 5.0,” Technical Report No. ISO/IEC JTC1/SC29/WG11 M16923, Lausanne, Switzerland, 2009. 25. G. Bradski, “The OpenCV library,” Dr Dobb’s Journal of Software Tools, Vol. 25, 2000, pp. 122-125. 26. C. Fehn, P. Kauff, S. Cho, H. Kwon, N. Hur, and J. Kim, “Asymmetric coding of stereoscopic video for transmission over T-DMB,” in Proceedings of 3DTV Conference, 2007, pp. 1-4. 27. A. Vetro, “Depth reconstruction filter and down/up sampling for depth coding in 3-D video,” IEEE Signal Processing Letters, Vol. 16, 2009, 747-750. 28. Q. Liu, Y. Yang, R. Ji, Y. Gao, and L. Yu, “Cross-view down/up-sampling method for multi-view depth video coding,” IEEE Signal Processing Letters, Vol. 19, 2012, pp. 295-298. 29. D. Taubman, “Kakadu software 6.4,” in http://www.kakadusoftware.com/index.php? option=com_content&task=view&id=26&Itemid=22. 2012. 30. D. Tian, P. L. Lai, P. Lopez, and C. Gomila, “View synthesis techniques for 3D video,” in Proceedings of SPIE, Applications of Digital Image Processing XXXII, Vol. 7443, 2009, pp. 74430T. 31. A. Telea “An image inpainting technique based on the fast marching method,” Journal of Graphics Tools, Vol. 9, 2004, pp. 23-34. 32. M. Solh and G. AlRegib “Depth adaptive hierarchical hole filling for DIBR-based 3D videos,” in Proceedings of SPIE The International Society for Optical Engineering, Vol. 8290, 2012, pp. 829004. 33. M. Solh and G. AlRegib, “Hierarchical hole-filling (HHF): Depth image based rendering without depth map filtering for 3D-TV,” in Proceedings of IEEE International Workshop on Multimedia Signal Processing, 2010, pp. 87-92. 34. ITU-R, “Recommendation ITU-R BT.2021: Subjective methods for the assessment of stereoscopic 3DTV systems,” http://www.itu.int/rec/R-REC-BT.2021-1-201502-I, 2012. 35. T. Tominaga, T. Hayashi, J. Okamoto, and A. Takahashi, “Performance comparisons of subjective quality assessment methods for mobile video,” in Proceedings of the 2nd International Workshop on Quality of Multimedia Experience, 2010, pp. 82-87. 36. M. D. Brotherton, Q. Huynh-thu, D. S. Hands, and K. Brunnstrom “Subjective multimedia quality assessment,” IEICE Transactions on Fundamentals of Electronics, Communications and Computer Sciences, Vol. E89-A, 2006, pp. 2920-2932. 37. N. Ponomarenko, V. Lukin, A. Zelensky, K. Egiazarian, M. Carli, and F. Battisti, “Tid-2008-a database for evaluation of full-reference visual quality assessment metrics,” Advances of Modern Radioelectronics, Vol. 10, 2009, pp. 30-45. 38. R. A. Doherty, A. C. Younkin, and P. J. Corriveau, “Paired comparison analysis for frame rate conversion algorithms,” in Proceedings of the 4th International Workshop on Video Processing and Quality Metrics for Consumer Electronics, 2009. 39. J. S. Lee, L. Goldmann, and T. Ebrahimi, “Paired comparison-based subjective qual-
MCL-3D: A DATABASE FOR STEREOSCOPIC IMAGE QUALITY ASSESSMENT
40. 41. 42. 43. 44. 45.
46. 47.
48.
49.
50. 51.
52.
53.
54.
55.
56.
1609
ity assessment of stereoscopic images,” Multimedia Tools and Applications, Vol. 67, 2012, pp. 31-48. S. Voran and A. Catellier, “Gradient ascent subjective multimedia quality testing,” EURASIP Journal on Image and Video Processing, Vol. 2011, 2011, pp. 1-14. H. A. David, The Method of Paired Comparisons, Hafner Publishing Company, NY, 1963. R. A. Bradley and M. E. Terry, “Rank analysis of incomplete block designs: I. The method of paired comparisons,” Biometrika, Vol. 39, 1952, pp. 324-345. R. A. Bradley, “Rank analysis of incomplete block designs: II. Additional tables for the method of paired comparisons,” Biometrika, Vol. 41, 1954, pp. 502-537. W. Lin and C.-C. Jay Kuo, “Perceptual visual quality metrics: A survey,” Journal of Visual Communication and Image Representation, Vol. 22, 2011, pp. 297-312. N. Damera-Venkata, T. D. Kite, W. S. Geisler, B. L. Evans, and A. C. Bovik, “Image quality assessment based on a degradation model,” IEEE Transactions on Image Processing, Vol. 9, 2000, pp. 636-650. Z. Wang, A. C. Bovik “A universal image quality index,” IEEE Signal Processing Letters, Vol. 9, 2002, pp. 81-84. Z. Wang, A. C. Bovik, H. R. Sheikh, and E. P. Simoncelli, “Image quality assessment: from error visibility to structural similarity,” IEEE Transactions on Image Processing, Vol. 13, 2004, pp. 600-612. Z. Wang, E. Simoncelli, and A. Bovik, “Multi-scale structural similarity for image quality assessment,” in Proceedings of the 37th Asilomar Conference on Signals, Systems and Computers, Vol. 2, 2003, pp. 1398-1402. L. Zhang, L. Zhang, X. Mou, and D. Zhang, “FSIM: a feature similarity index for image quality assessment,” IEEE Transactions on Image Processing, Vol. 20, 2011, pp. 2378-2386. H. R. Sheikh and A. C. Bovik, “Image information and visual quality,” IEEE Transactions on Image Processing, Vol. 15, 2006, pp. 430-444. D. M. Chandler and S. S. Hemami, “VSNR: a wavelet-based visual signal-to-noise ratio for natural images,” IEEE Transactions on Image Processing, Vol. 16, 2007, pp. 2284-2298. H. R. Sheikh, A. C. Bovik, and G. de Veciana, “An information fidelity criterion for image quality assessment using natural scene statistics,” IEEE Transactions on Image Processing, Vol. 14, 2005, pp. 2117-2128. N. Ponomarenko, F. Silvestri, K. Egiazarian, M. Carli, J. Astola, V. Lukin “On between-coefficient contrast masking of DCT basis functions,” in Proceedings of the 3rd International Workshop on Video Processing and Quality Metrics, Vol. 2007, 2007, pp. 1-4. M. Carnec, P. L. Callet, and D. Barba, “An image quality assessment method based on perception of structural information,” in Proceedings of IEEE International Conference on Image Processing, Vol. 3, 2003, pp. 185-188. P. Campisi, P. Le Callet, and E. Marini, “Stereoscopic images quality assessment,” in Proceedings of the 15th European Signal Processing Conference, 2007, pp. 21102114. S. Ryu, D. H. Kim, and K. Sohn, “Stereoscopic image quality metric based on binocular perception model,” in Proceedings of the 19th IEEE International Conference
1610
RUI SONG, HYUNSUK KO AND C.-C. JAY KUO
on Image Processing, 2012, pp. 609-612. 57. H. Ko, C. S. Kim, S. Y. Choi, and C.-C. J. Kuo. “3D image quality index using SDP-based binocular perception model,” in Proceedings of the 11th IEEE IVMSP Workshop: 3D Image/Video Technologies and Applications, 2013, pp. 1-4. 58. P. Gorley and N. Holliman, “Stereoscopic image quality metrics and compression,” in Proceedings of SPIE The International Society for Optical Engineering, Vol. 6803, 2008, pp. 680305. 59. Z. M. P. Sazzad, R. Akhter, J. Baltes, and Y. Horita, “Objective no-reference stereoscopic image quality prediction based on 2d image features and relative disparity,” Advances in Multimedia, Vol. 2012, 2012, pp. 1-16.
Rui Song (宋锐) received his MS and Ph.D. degree in Signal and Information Processing from Xidian University, Xián, China, in 2006 and 2009 respectively. He is currently an Associate Professor in the State Key Laboratory of Integrate Service Network, School of Telecommunications at Xidian University. His research interests include pre- and post-processing of high definition camera, image and video quality assessment, video coding algorithms, VLSI architecture design for image and video processing, architecture design of video codec IP.
Hyunsuk Ko received the B.S. and M.S. degrees in electrical engineering from Yonsei University, Seoul, Korea, in 2006 and 2009, espectively, and the Ph.D. degree in electrical engineering from the University of Southern California, Los Angeles, in 2015. Since June 2015, he has been a senior researcher at Electronics and Telecommunications Research Institute (ETRI), Daejeon, Korea. His research interests include video compression, stereoscopic image quality assessment/rectification, and machine learning.
C.-C. Jay Kuo received M.S. and Ph.D. degrees from the Massachusetts Institute of Technology, Cambridge, in 1985 and 1987, respectively, all in Electrical Engineering. He is currently Dean’s Professor of Electrical Engineering and Computer Science at USC, and Director of the Multimedia Communication Lab. His research interests are in the areas of multimedia data compression, communication and networking, multimedia content analysis and modeling, and information forensics and security. He has guided 118 students to their Ph.D. degrees and supervised 23 postdoctoral
MCL-3D: A DATABASE FOR STEREOSCOPIC IMAGE QUALITY ASSESSMENT
1611
research fellows. He is co-author of about 220 journal papers, 850 conference papers and 12 books. He delivered around 550 invited lectures in conferences, research institutes, universities and companies. Dr. Kuo is a Fellow of AAAS, IEEE and SPIE. He is Editor-in-Chief for the IEEE Transactions on Information Forensics and Security and Editor Emeritus for the Journal of Visual Communication and Image Representation (an Elsevier journal). He was Editor-in-Chief for the Journal of Visual Communication and Image Representation in 1997-2011. He was on the Editorial Board of the IEEE Signal Processing Magazine in 2003-2004, IEEE Transactions on Speech and Audio Processing in 2001-2003, IEEE Transactions on Image Processing in 1995-98 and IEEE Transactions on Circuits and Systems for Video Technology in 1995-1997.