Measurement based traffic classification in Differentiated Services Marko Luoma and Mika Ilvesm¨aki Helsinki University of Technology, P.O. Box 3000, 02015 HUT, Finland ABSTRACT Internet is moving towards the time of Quality of Service (QoS) networking. This move is taking place through the application of Differentiated Services (DiffServ) architecture. DiffServ offers low overhead tools to implement class based differentiation for the traffic. Decision of differentiation is, however, left as an open matter, to be settled between service provider and customer. Majority of customers are, based on our assumption, not ready to say what should be the quality or class for their traffic. This leaves space for provider intervention - service, to do this classification for the customer. Service provider is dealing with three problems which need to be solved concurrently: (1)Deciding the proper forwarding class for the application data stream (2)Separation of application flows from the packet stream (3)Constructing proper forwarding treatments. If successful with this operation, operator has direct control over the resource utilization within different classes and therefore service level provided to the customer. In order to cope with this service, tools for analyzing network traffic and forming suitable traffic groups are required. We present algorithms and methodologies which do differentiation of traffic based on the activity/traffic characteristics of applications. These values are determined from the flow analysis of packet lengths and inter-sending times. Keywords: Differentiated Services, Integrated Services, Quality differentation, Traffic Classification
1. INTRODUCTION Internet is facing a gigantic change when new QoS based services are being introduced to the wide audience. These QoS based services are applications of IETF Integrated and Differentiated services concepts. For a long time it seemed that Integrated Services (IntServ) 1 would be the way to implement the QoS for new interactive media types. As it has happened with many rigorous networking concepts, IntServ too, seems to have stumbled with the problem of complicated control mechanisms. Therefore, the tides have changed for a more flexible implementation of QoS, namely the Differentiated Services (DiffServ) architecture.2 The difference between the IntServ and the DiffServ concepts is on the level of granularity where the traffic conditioning actions are taken. IntServ, which has a strong connection to the ATM and circuit switched networks, offers a fine level of granularity - actions are taken on per flow basis. This fine granularity makes it possible to have high quality audio and video connections simultaneously with high speed data transfers. From the quality point of view, there exists two major classes: guaranteed service,3 which offers high quality resource reserved connections and the controlled load service,4 which aims to offer emulation of ’lightly loaded best effort service’. These two classes require, in order to operate, user to inform the network about resource requirements of the connection. This informing is done with the resource reservation protocol (RSVP)5 which acts as an agent between the user and the network. This agent translates session characteristics to the traffic and the quality specifications which then are uniformly processed within the network. IntServ provides tools to offer real QoS in an end-to-end manner. However, there are many complications with this end-to-end approach. Network has to be able to maintain information about the resource requirements of each flow and user has to be able to pass resource information to the network. Differentiated Services aims to solve the first problem in the core network by aggregating the flow information. The second problem could be solved with reservation agent, which measures application traffic on the client and provides information for the RSVP. DiffServ offers coarse granularity quality differentiation. Flows are aggregated to make processing as easy as possible in the core network (where the number of individual flows is enormous). All required preprocessing for the aggregation Further author information: (Send correspondence to M.L) M.L: E-mail:
[email protected] M.I: E-mail:
[email protected]
is done on the network edge. Quality, which the DiffServ offers, is dependable on the network provisioning and traffic distribution within the network. Main problem in the DiffServ is forming the aggregates in a way that individual flows still have quality which they need. In this process access points of the DiffServ domain are in major role. If the IntServ access network is feeding the DiffServ core, this problem is readily solved by information transmitted in the RSVP messages. However, if the case is about pure DiffServ domain there is no easy answer. Either the user states the quality requirements by selecting the aggregation class or the network does this as a value added service for the user. First option is problematic both from the user and network perspective. User may select wrong class and by doing so receive non-optimal quality. Also other users may be influenced by the selection of a single user (single high speed data transfer can deteriorate the quality in a class which is meant for the real-time low speed communication). Second option is beneficial both from the network and the user perspective. Classification made by the network has better opportunity to provide better quality throughout the network. Network based classification offers homogenous quality separation on network wide bases. This provides controlled mixture of traffic and has possibility to provide ’real QoS’ in case of aggregate handling. This paper is organized as following. Section 2 states and motivates the questions which come into picture with quality differentiation with technological solutions like Differentiated Services. Section 3 offers a solution for one of the questions stated in Section 2, namely service control and forwarding treatments. Section 4 is used to emphasize measurement based traffic classification. It presents three approaches which may be used alone or with the others to perform network based quality differentiation. Section 5 draws conclusions based on what has been presented. This paper aims to start discussion on the problems which are very well known but hardly ever expressed, i.e. service/quality differentiation in Differentiated Services. How it really can be done without too many complications. Therefore, a broad overview is given without too narrow and deep technical assessment on any particular topic.
2. CONTROL OVER QUALITY As expressed in the Introduction, QoS in the Internet is related to three problems which need to be solved concurrently: 1. Deciding the proper forwarding class for the application data stream 2. Separation of application flows from the packet stream 3. Constructing the proper forwarding treatments The first item is directly connected to the required quality and mechanisms to be used in the decision process and in relaying classification information. We can argue if there are general rules to apply for this decision process, but the bottom line is that there has to be some mechanism which does this. The RSVP and other signaling based methods are developed under the assumption that the user population has ability to choose the right class with the help of communication device. Furthermore, if end-to-end services are offered resource requirements need to be stated at the same time. Resource requirements are in some cases easily derived from the application, like in case of VoIP codecs, which generate similar packet stream irrespective of actual usage. However, this is not the case with TCP based data applications which, in general, produce traffic based on the direct feedback from the network. With the DiffServ the selection of forwarding class is even more problematic. At this point there is no clear picture what is the derived quality in each class nor is the difference between the classes known. This means that the network is in better position to make decisions as it knows more about the load levels within links and also provisional goals of the service provider. However, network does not know requirements of different applications. With this in our mind we can make the first question: Is there any way network could become aware of application requirements ? Second item, separating the traffic flows, is more straight forward to solve. Separation of application flows requires only knowledge of different applications transport protocol and transport protocol port information. Based on this information filters can be made to separate flows belonging to different applications. However, there is still question: How network constructs filters which reflect separation of application flows ? With the IntServ this is clearly again the task of the RSVP, but in case of the DiffServ we need again something else. Third item, construction of forwarding treatments, is matter of selection from the side of service provider. One way to differentiate among service providers is to offer some particular service model to the customers. Service models,
however, connect to some particular forwarding treatment. Internet communication is typically reaching over multiple service providers which, if having different forwarding treatments, may have problems in the QoS interoperability. This calls fora small set of forwarding treatments which are used in a way that guarantees meaningful interoperability. To solve these questions we present a measurement based traffic management paradigm with a service model. This is designed for the pure DiffServ networks or to the networks which have IntServ feeding the DiffServ core without bandwidth broker capabilities. This solution does not guarantee end-to-end services, but it offers rational, homogenous class aggregation based on the traffic characteristics of application identifiers. Application identifier is combination of transport protocol and source port information. Source port information can be bound to application with some level of accuracy. This process is dynamic and therefore measurement process used to identify application has to be coarse to take only general nature of application into account.
3. FORWARDING TREATMENT In our view, the decision of forwarding treatment is bound to the services which are meant to be offered for the customers. Because service structure has to be flexible in evolvement there has to be general rules which set constrains for the selection of forwarding treatment. We call this as a service creation environment. There can be multiple service creation environments but they all provide information about importance of packets in particular service class compared to other service classes and timely requirements of packet delivery in that class. This makes possible to construct DiffServ coding which clearly represents importance and urgency of packets within the network, like in [6].
3.1. Service Creation Environment Protocol Application Forwarding (PAF) is our service creation environment. It allows service provider to build services based on the idea of proportional sharing. We argue that proportional sharing, like in Simple Integrated Media Access,7 is the most flexible and promising way to implement services to the Internet. This is due to frequent changes in application space and user habits. In general the service ideology in PAF is following: 1. User is allowed to send traffic up to the level of the contracted rate with high priority. Excess traffic is delivered with lower priority. 2. Traffic is not treated as a black box. Applications are resolved based on application identifiers and forwarding treatment is bound to this identifier. We assume that when application information is resolved and forwarding treatment is bound to this information, delivered performance will be better compared to the situation when mixing of applications in forwarding classes is random. This is justified by notion which has been made from the current Internet where UDP-based real-time applications and TCP-based data applications interfere one and the other. If real-time applications are separated from the data applications they both should receive better performance. To verify this we made a set of simulations where three groups of applications (VoIP, HTTP and FTP) were used in the network presented in Figure 1. First we used best effort technology to have baseline to which we could compare results when traffic is separated. Best effort simulation, Table 1, shows that there is strong interference between different application groups. VoIP, which has traffic generation rate of 75200 bps, does not achieve this rate i.e. its packets are discarded in the network due to congestion. HTTP, which is modeled based on measurements of Mah,8 has lower aggressivity than FTP and therefore does not suffer as high packet loss percentage as FTP, which is modeled as ’infinite’ file size greedy source. Next we differentiated applications on the level where UDP based VoIP was separated to own class and TCP based still share a common class. Simulation results, Table 2, show at this point that VoIP clients receive approximately resources which they require (mean call duration was 3 minutes and new call was attempted every 30s, this causes empty moments lowering the average rate). Interference between two different types of TCP applications, HTTP and FTP, is still causing overall performance to be less than what could be achieved. This is well known problem that HTTP connections which are very short (operate mainly on slow-start) can cause long living FTP connections problems (long idle times while waiting window to recover after a packet loss) even in cases where average utilization is low.
VoIP C5
VoIP C1 R0
R10 HTTP C3
FTP C1 HTTP S1
R4
FTP S3
R8
VoIP C2
VoIP C6 R1
R11 FTP C3
FTP C2 FTP S1
R6
1.5 Mbps
HTTP S3
R7
15ms
VoIP C7
VoIP C3 R2
15ms 4.5 Mbps
HTTP C1 FTP S2
R12
15ms 4.5 Mbps
HTTP C4
R5
FTTP S4
R9
VoIP C4
VoIP C8 R3
HTTP C2
10ms 10 Mbps
10ms 10 Mbps
FTP C4 HTTP S4
10ms 10 Mbps
10ms 10 Mbps
HTTP S2
R13
VoIP C1 VoIP C2 VoIP C3 VoIP C4
FTP C1 FTP C2 FTP C3 FTP C4
VoIP C5 VoIP C7 VoIP C6 VoIP C8
FTP S4 FTP S3 FTP S2 FTP S1
HTTP C1 HTTP C2 HTTP C3 HTTP C4
HTTP S4 HTTP S3 HTTP S1 HTTP S2
Figure 1. Network model used in the simulation study
Table 1. Throughput results from the best effort simulation VoIP[C5] 1 2 3 4 5 6
Mean 74712 bps 74856 bps 74754 bps 74710 bps 74687 bps 74765 bps
1 2 3 4 5 6
Mean 101674 bps 91623 bps 91950 bps 98852 bps 98353 bps 97397 bps
C95% 208 bps 190 bps 212 bps 209 bps 216 bps 207 bps
HTTP[C3] C95% 3674 bps 3437 bps 3616 bps 3624 bps 3791 bps 3810 bps
VoIP[C6] Mean 74720 bps 74848 bps 74908 bps 74641 bps 74903 bps 74695 bps
C95% 206 bps 191 bps 167 bps 227 bps 166 bps 212 bps
HTTP[C4] Mean 99626 bps 105764 bps 101265 bps 97374 bps 109142 bps 95240 bps
C95% 3654 bps 3851 bps 3666 bps 3738 bps 3826 bps 3690 bps
VoIP[C7] Mean 74734 bps 74901 bps 74865 bps 74688 bps 74851 bps 74716 bps
C95% 209 bps 175 bps 180 bps 213 bps 183 bps 213 bps
FTP[C3] Mean 0 bps 188157 bps 0 bps 0 bps 81676 bps 365953 bps
C95% 0 bps 8962 bps 1 bps 1 bps 8197 bps 6454 bps
VoIP[C8] Mean 74900 bps 74979 bps 74566 bps 74691 bps 74820 bps 74785 bps
C95% 175 bps 157 bps 244 bps 210 bps 190 bps 195 bps
FTP[C4] Mean 30860 bps 45603 bps 306370 bps 87382 bps 0 bps 167884 bps
C95% 7477 bps 7776 bps 6449 bps 14669 bps 3 bps 7160 bps
Table 2. Throughput results from the semi-differentiated applications simulation VoIP[C5] 1 2 3 4
Mean 75120 bps 75158 bps 74963 bps 75090 bps
1 2 3 4
Mean 79433 bps 89026 bps 59950 bps 78699 bps
C95% 214 bps 130 bps 497 bps 260 bps
HTTP[C3] C95% 9095 bps 6763 bps 13771 bps 10500 bps
VoIP[C6] Mean 75117 bps 75159 bps 74949 bps 75093 bps
C95% 213 bps 124 bps 515 bps 253 bps
HTTP[C4] Mean 35957 bps 21227 bps 93856 bps 89300 bps
C95% 7377 bps 5147 bps 14924 bps 9632 bps
VoIP[C7] Mean 75028 bps 75113 bps 74978 bps 75094 bps
C95% 257 bps 136 bps 527 bps 260 bps
FTP[C3] Mean 324113 bps 323069 bps 142428 bps 109924 bps
C95% 23695 bps 19013 bps 37667 bps 25827 bps
VoIP[C8] Mean 75112 bps 75117 bps 74954 bps 75086 bps
C95% 194 bps 125 bps 506 bps 266 bps
FTP[C4] Mean 113824 bps 0 bps 7205 bps 380574 bps
C95% 21905 bps 5 bps 7513 bps 22062 bps
Table 3. Throughput results from the differentiated applications simulation VoIP[C5] 1 2 3 4
Mean 75120 bps 75158 bps 74963 bps 75090 bps
1 2 3 4
Mean 99618 bps 82412 bps 74705 bps 86549 bps
C95% 214 bps 130 bps 497 bps 260 bps
HTTP[C3] C95% 5289 bps 4479 bps 9212 bps 4419 bps
VoIP[C6] Mean 75117 bps 75159 bps 74949 bps 75093 bps
C95% 213 bps 124 bps 515 bps 253 bps
HTTP[C4] Mean 86610 bps 95975 bps 79023 bps 93534 bps
C95% 5058 bps 4656 bps 8606 bps 4807 bps
VoIP[C7] Mean 75028 bps 75113 bps 74978 bps 75094 bps
C95% 257 bps 136 bps 527 bps 260 bps
FTP[C3] Mean 248117 bps 217278 bps 334765 bps 200608 bps
C95% 11883 bps 11467 bps 24958 bps 10705 bps
VoIP[C8] Mean 75112 bps 75117 bps 74954 bps 75086 bps
C95% 194 bps 125 bps 506 bps 266 bps
FTP[C4] Mean 94195 bps 295656 bps 113917 bps 88971 bps
C95% 13694 bps 10585 bps 19710 bps 13711 bps
Last phase was to add differentiation between HTTP and FTP. Simulation results, Table 3, show that applying a small level of differentiation, Assured Forwarding (AF)9 target rates, between HTTP and FTP helps both applications to receive better throughput what they would have received if this had not been done. We can even do more fine grained differentiation, like in Figure 2. We can divide applications first by their transport protocol and then by their nature. This provides total isolation between closed loop controlled (TCP) and open loop controlled (UDP) traffic. However, nature of the applications is not well known for the service provider and therefore mechanisms to detect ’class’ for each application is required, this is investigated in Section 4. Typical ISP is differentiating customers based on their committed information rate or equivalent. This means that customer is allowed to send traffic to the network with a certain intensity. However, customer is allowed to send traffic with rate higher than committed but only for a certain period of time. With this in mind proportionality in sharing is based on the differentiation of allowed sending rates to different classes. Classes by themselves do not form differentiation rather they act as a tool for the service provider to maximize goodput of the network and revenue. DiffServ forwarding treatment, e.q. per hop behavior (PHB), which provides best possibility to offer services which aim this goal, is assured forwarding (AF) PHB.9 AF PHB provides delivery of IP packets in four independently forwarded AF classes. Within each AF class, an IP packet can be assigned one of three different levels of drop precedence. There are no quantifiable timing requirements associated with the forwarding of packets within the AF PHB. When comparing offerings of AF and requirements of typical ISP they are well hand in hand. Number of classes makes it possible to have: 1. Network control class for both TCP and UDP. This contains: DNS, DHCP, SNMP, BGP and other network control functions which have impact to the user performance. 2. Real-time class for the UDP-based applications. These are ones with the most stringent quality requirements. 3. Interactive class for TCP-based applications. This class contains HTTP and terminal applications (Telnet, SSH). 4. Bulk transfer class. This contains email, FTP, news and other low priority traffic.
Traffic Classification
TCP based
Interactive
UDP based
Network Control
Bulk
Real Time
Bulk
Figure 2. Functional division of applications in PAF
4. FORWARDING CLASS SELECTION We use continuous measurement process for the selection of proper forwarding class for each application. This measurement process produces list of application identifiers∗ for each class which are then used in the classification process of the DiffServ access routers. Measurement cycle should be long enough to provide stability in service usage but on the other hand short enough to notice new applications and their features. We have used 30 minutes in this work.
4.1. Measuring information Measurement process which we use runs on access routers of the network. Measurements are used for gathering information about arrivals of packets and classifiable information they carry in headers of IP and transport layer. Necessary elements of header and time-of-arrival is collected for post-processing with statistical and artificial intelligent analysis methods. Measurement information, if collected incorrectly, leads to misclassifications and unwanted resource distribution in the network. Correct collection means that information should be collected as near to the source as possible. In practice this means the access router or the first concentration stage in the network. Reason for this requirement is the possible distortion in the traffic profile, as the traffic gets buffered, fragmented and multiplexed on the way to the measurement point. This is an important aspect on all analysis mechanisms which rely on the time information of arriving packet, see packet arrival distributions of single session in near and far end at the Figure 3. To minimize misclassifications we suggest mechanisms which utilize measurement at the uplink of the access router. This requires additional measurement unit in each router to collect data, to process it and for sending information to the network operation center (NOC). Requirements for such a device should easily be well within implementation constrains of todays low cost technologies.
4.2. Data analysis Traffic analysis is usually based on the aggregated flow analysis with the flow granularity of the fivetuple† . Traffic and flows are analyzed in several dimensions, such as the relative number of flows, the relative number of packets, packet length distribution and/or inter-arrival distribution within a certain classification category. 4.2.1. Packets per flow analysis Packets per flow analysis produces single data point in two-dimensional array representing relative amount of packet and relative amount flows detected for single application identifier over the whole of the measurement data. Due to the (usually) large amount of data points and relatively high uncertainty of behavior of some applications, artificial intelligence mechanism, like k-nearest neighbor method, are needed to resolve which class area individual
IAT distribution of Vocaltec IPphone 0.1
0.45
0.09
0.4
0.08
0.35
0.07
0.3
0.06
% of occurances
% of occurances
IAT distribution of Vocaltec IPphone 0.5
0.25
0.2
0.05
0.04
0.15
0.03
0.1
0.02
0.05
0.01
0
0
50
100
150
200
250 Time (ms)
300
350
400
450
500
0
0
50
(a) Near end - Finland
100
150
200
250 Time (ms)
300
350
400
450
500
(b) Far end - China
Figure 3. Packet inter arrival time distributions for a Vocaltec VoIP connection from Finland to China.
% of flows
HyperText and Terminal emulation Transaction applications
Continuous media applications
% of packets per flow
Figure 4. Conceptual idea of flows packets per flow analysis
Number of flows
Elastic traffic Continuous media traffic Flow time out
Figure 5. Conceptual idea of flows packets per flow analysis in multi class operation Locations of applications over the packets/flows −space − tct
0
10
−1
10
−2
%−flows from all flows
10
−3
10
−4
10
FTP SSH SMTP DNS HTTP IMAP RealAudio VocalTec
−5
10
−6
10
−4
10
−3
10
−2
10 %−packets from all packets
−1
10
0
10
Figure 6. Packets per flow data points for applications and protocols used as reference observations data point belongs to. With Internet traffic this usually tends to form three regions with some overlap when looking the borderline applications. Theses three regions are marked roughly to the Figure 4. In [10] the use of Learning Vector Quantization (LVQ) is introduced to make class area decisions in a flow-based connection-oriented IP router environment. This approach is extended to have multiple application classes in [11]. Multiple application classes are resolved based on the observations that real-time communication typically produces constant packet rate whereas data communication packet rate varies. This causes different forms of flow/timeout figures, presented in Figure 5. To extract this type of information from the packet streams, different time-out values are used in the flow analysis. Short time-out values tend to find interactive flows whereas longer time-outs tend to find also less interactive communication. From the trace gathered from the link between Networking laboratory and HUT backbone, we performed packets per flow analysis, Figure 6. This analysis reveals interesting points of the nature of these applications. VoIP phones are used to communicate between persons so the communication process is very much like that found in the circuit switched telephone networks. This process has mean connection time of 180s and on the average 50% active time. Packet per flow analysis shows that a VoIP client typically produces a small number of flows with high packet count, during a flow. Similar thing, with a slightly lower ratio, is observable with all applications and protocols where a ∗ †
We call these lists in name of network service profile (NSP). Fivetuple is vector of Source address, Destination address, Protocol, Source port and Destination port
Table 4. Application identifiers which contain more than 90% packets shorter than 128 or 256 bytes. Trace is from TCT backbone July 1999. UDP ntp dns query ? icq realaudio
UDP
TCP 123 1025 1076 4000 6970
smtp ? ? ? ? ? ? ansoft−lm−2 ? sunclustermgr ? ? ? ? ? ? ?
25 1017 1019 1020 1021 1024 1082 1084 1089 1097 1105 1107 1115 1119 1121 1125 1140
(a) 128B
? ? ? ? ? ? ? ? ? ? ? ? ? hiq innosys firefox ?
1141 1142 1143 1148 1154 1173 1199 1203 1225 1229 1233 1251 1317 1410 1412 1689 5280
ntp dns query ? icq realaudio vocaltec−phone
TCP 123 1025 1076 4000 6970 22555
smtp ? ? ? ? ? ? ? ansoft−lm−2 ? sunclustermgr ? ? ? ? ? ? ?
25 1017 1018 1019 1020 1021 1024 1082 1084 1089 1097 1105 1107 1115 1119 1121 1125 1140
? ? ? ? ? ? ? ? ? ? ? ? ? hiq innosys firefox ? ?
1141 1142 1143 1148 1154 1173 1199 1203 1225 1229 1233 1251 1317 1410 1412 1689 5280 6000
(b) 256B
human is in direct contact with the communication process (HTTP, SSH, FTP). Extrapolating on this finding we argue that the LVQ algorithm, which we have used in [10,11] to do similar class-based grouping with older data, is able to extract large number of communication classes. The most basic example of this is differentiating user driven real-time, interactive and bulk traffic, like in our service scenarion.
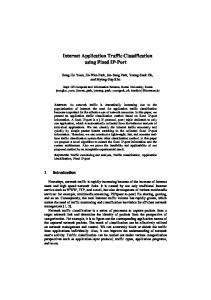
4.3. Packet length analysis Analysis based on the packet length distribution of an application group offers a tool to distinguish sets of applications which have similar characteristics or restrictive operation type. Most straight-forward result from this analysis is the division between real-time and non-real-time nature of an application. Typical real-time application uses a small packet size due to tradeoff between packet size and delay budget in the real time applications. For example; voice communication cannot tolerate more than 150ms of one-way delay. When using packetized voice codec, the delay is a combination of the actual coding and framing. Framing is the time-window which the codec waits for the samples. This time varies with different codecs from 10ms to 30ms. In this time these codecs produce typically maximum of 250 bytes of information. Video communication, where the amount of information is greater, these rules are no longer valid. Video communication utilizes varying set of compression methods which distort packet length distribution heavily. In general, packet length for the video tends to be smaller than 512 bytes. Requirements for voice and video transmission over the packet networks are studied in [12]. We present here results from the analysis of measurements done on the link between Networking laboratory and HUT backbone. These results, in Figure 7, show strong correlation, as expected, between application type and packet length distribution. This would suggest that proposed method of Cheng and Kung in [13,14] works well if classes in general behave as these example applications. We examine these conditions based on the raw statistical analysis of traffic. If more than 90% of the packets in an application identifier are shorter than threshold value, 128 and 256 bytes, application is classified as interactive. Based on this analysis and observations from the Table 4 we claim that packet length is not alone adequate for classifying general behavior of a class. Large amounts of TCP ACKs cause some irrelevant applications to be classified as interactive. Nevertheless, packet length approach shows its usefulness as a first-hand, easily implementable, NSP generator.
4.4. Inter-arrival time analysis With inter-arrival time (IAT) analysis applications can be classified into two classes: real-time and non-real-time. Suggestions for this kind of mechanisms have been proposed in [14].
Length distribution of FTP
0.9
0.9
0.8
0.8
0.7
0.7
0.6
0.6
% of occurances
1
0.5
0.4
0.5
0.4
0.3
0.3
0.2
0.2
0.1
0.1
0
0
200
400
600
800 1000 Packet length (bytes)
1200
1400
1600
0
0
200
400
600
(a) HTTP
800 1000 Packet length (bytes)
1200
(b) FTP Length distribution of Vocaltec IPphone
1
0.9
0.8
0.7
% of occurances
% of occurances
Length distribution of HTTP 1
0.6
0.5
0.4
0.3
0.2
0.1
0
0
200
400
600
800 1000 Packet length (bytes)
1200
1400
1600
(c) Vocaltec
Figure 7. Packet length distribution of various applications or protocols
1400
1600
IAT distribution of FTP 0.1
0.09
0.09
0.08
0.08
0.07
0.07
0.06
0.06
% of occurances
% of occurances
IAT distribution of HTTP 0.1
0.05
0.04
0.05
0.04
0.03
0.03
0.02
0.02
0.01
0.01
0
0
50
100
150
200
250 Time (ms)
300
350
400
450
500
0
0
50
100
150
(a) HTTP
200
250 Time (ms)
300
350
400
450
500
(b) FTP IAT distribution of Vocaltec IPphone
0.5
0.45
0.4
% of occurances
0.35
0.3
0.25
0.2
0.15
0.1
0.05
0
0
50
100
150
200
250 Time (ms)
300
350
400
450
500
(c) Vocaltec
Figure 8. Inter arrival time distributions of various applications and protocols The foundation behind the IAT based classification is the characteristics of applications. Real-time applications typically lack feedback control or at least they tend to keep constant inter sending times of packets during the active period, for instance talk spurts. This produces ’uni-modal’ distribution. Non-real-time applications on the other hand typically use TCP as transport protocol. TCP which uses window based flow/congestion control where a certain amount of data is sent to the network and thereafter an acknowledgment for the transmitted data is required. This kind of two phase operation produces a distorted ’exponential’ inter-arrival time distribution with long tails. This is again examined based on measured traffic trace, see Figure 8. Example applications HTTP and FTP show long tail in their IAT while Vocaltec VoIP has largely two IAT values 60 and 125 ms.
5. CONCLUSIONS We have presented a motivation and a solution for the measurement based traffic management in the QoS aware IP environment. It contains a service creation environment, data analysis mechanisms for the application detection and class decision. We have showed that these mechanisms work in general. To have experimental results from the network which uses this technology, we are now in process of implementing all of these functions. So far we have devised the measurement tool, the data analysis tool and are in process of integrating them to a network management platform. We argue that network based quality mechanisms will be the solution for the QoS Internet and their role
will be even more important than what we have expressed. However, we want to note that in the light of our experience, we see that it is doubtful if any single algorithm is, in the long run, able to do traffic differentiation. This calls for extensive research on this area.
Acknowledgments This work was funded by Academy of Finland under contract for project MI2 TTA and TEKES under contract for project IMELIO.
REFERENCES 1. J. Wroclawski, “The use of RSVP with IETF integrated services,” RFC 2210, IETF, September 1997. 2. Y. Bernet, J. Binder, S. Blake, M. Carlso, S. Keshavn, E. Davies, B. Ohlman, D. Verma, Z. Wang, and W. Weiss, “A framework for differentiated services,” draft-ietf-diffserv-framework-02.txt, IETF, February 1999. 3. S. Shenker, C. Partridge, and R. Guerin, “Specification of guaranteed quality of service,” RFC 2212, IETF, September 1997. 4. J. Wroclawski, “Specification of the controlled-load network element service,” RFC 2211, IETF, September 1997. 5. R. Braden, L. Zhang, S. Berson, S. Herzog, and S. Jamin, “Resource reservation protocol (RSVP) - versions 1 functional specification,” RFC 2205, IETF, September 1997. 6. K. Kilkki and J. Ruutu, “Interoperability PHB group,” draft-kilkki-diffserv-interoperability-00.txt, IETF, October 1999. 7. K. Kilkki, “Simple integrated media access,” draft-kalevi-simple-media-access-01.txt, IETF, June 1997. 8. B. Mah, “An empirical model of HTTP network traffic,” in Proceedings of INFOCOM’97, vol. 2, pp. 592–600, IEEE, April 1997. 9. J. Heinanen, F. Baker, W. Weiss, and J. Wroclawski, “Assured forwarding PHB group,” RFC 2597, IETF, June 1999. 10. M. Ilvesm¨ aki, M. Luoma, and R. Kantola, “Flow classification schemes in traffic-based multilayer IP switching - comparison between conventional and neural approach,” Computer Communications 21(13), pp. 1184–1194, 1998. 11. M. Ilvesm¨aki and M. Luoma, “Performance analysis of multi-class internet traffic classifier in a connection oriented router environment,” in Proceedings of Voice, Video and Data Communications 1999, 1999. 12. K. van der Waal, M. Mandjes, and H. Bastiaansen, “Delay performance analysis of the new internet services with guaranteed QoS,” IEEE Proceedings 85, pp. 1947–1957, December 1997. 13. B. Nandy, N. Seddigh, A. Chapman, and J. H. Salim, “A connectionless approach to providing QoS in IP networks,” in High Performance Networking, H. van As, ed., pp. 363–379, IFIP, Kluwer Academic Publishers, September 1998. 14. A. Chapman and H. Kung, “Automatic quality of service in IP networks,” in Proceedings of the Canadian Conference on Broadband Research, pp. 184–189, April 1997.