Proceedings of the Second Asian Particle Accelerator Conference, Beijing, China, 2001
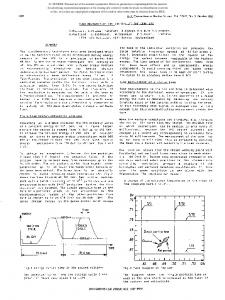
MEASUREMENT OF SOME BEAM PARAMETERS USING TUNE MEASUREMENT SYSTEM FOR HLS * Baogen Sun#, Duohui He, Hongliang Xu, Ping Lu, Junhua Wang Yunfeng Gao, Lin Wang, Jianhong Liu NSRL, University of Science and Technology of China, Hefei, Anhui 230029, P.R.China consists of a stripline BPM, an 1800 hybrid, a BPF amplifier, a mixer, a spectrum analyzer with tracking generator, a power amplifier, an excitation electrode, a PC computer, and a GP-IB card.
Abstract The paper introduces the measurement of some beam parameters using tune measurement system for Hefei Light Source (HLS), which include the betatron tune, average beta function, natural chromaticity, corrected chromaticity, and central frequency. Additionally, the measurement of the influence on the betatron tune shift by DC clearing electrodes is also described. Some measurement results are given. The measurement results are compared with the theoretical values and shown to be in good agreement.
BPM
frf
V1
V2
0
180 Hybrid
Beam
V∆ BPF Amp.
LPF
V4
V3
Spectrum analyzer
Excitation electrode
Power Amp.
Track generator
Beam
GP-IB Bus
1 INTRODUCTION
GP-IB Card
PC Computer
The Hefei Light Source (HLS) consists of an 800MeV electron storage ring and a 200MeV Linac injector. To commission the 800MeV storage ring expediently, and to know more of the storage ring for improving it, it is very important to measure some beam parameters of electron storage ring such as the betatron tune, beta function, natural chromaticity, corrected chromaticity, central frequency, and the influence on the betatron tune shift by DC clearing electrodes. These parameters were measured by frequency domain technique. The swept frequency excitation method was used to measure betatron tune. The beta function is given by the betatron tune shift with quadrupole strength. The dispersion is inferred from the orbit change induced by a shift in the RF frequency. The natural chromaticity is obtained by detecting the variation of the betatron tune as a function the main dipole field strength. The corrected chromaticity is given by the betatron tune shift with RF frequency. The central frequency is obtained by measuring the chromaticity for different sextupole strengths.
Figure 1: Block diagram of tune measurement system The difference signal from the stripline electrodes is demodulated by AM detector. The signal will be analyzed by the spectrum analyzer with tracking generator. The output signal of the tracking generator is amplified by a power amplifier. The excitation electrode is driven by the amplified tracking signal to excite betatron oscillation. The PC computer and GP-IB card are used to acquire data from the spectrum analyzer so that the betatron tune can automatically be measured. The program is written by HP VEE. 0 -10
Amplitude /dbm
1
3
2
4
-20 -30 -40 -50 -60
2 TUNE MEASUREMENT SYSTEM
-70 1.7
Because the beam betatron motion is weak, it is very difficult to measure the beam betatron motion immediately. So, the swept frequency excitation method was used to measure betatron tune[1]. The tune measurement system is shown as Fig.1. This system *
Supported by National Important Project on Science- Phase II of National Synchrotron Radiation Laboratory #
[email protected] 737
1.8
1.9
2.0
2.1
2.2
2.3
2.4
2.5
2.6
2.7
2.8
2.9
Frequency /MHz
Figure2: Frequency spectrum of the beam betatron signal on Spectrum Analyzer
Proceedings of the Second Asian Particle Accelerator Conference, Beijing, China, 2001
∆ν x = −3.09 × 10 −6 VClear −6 ∆ν y = 2.34 × 10 VClear
3 MEASUREMENT OF TUNE 3.1 Measurement result of betetron tune
Comparing equation (4) with equation (3), the measured results are fit close to the calculated results.
Fig.2 shows the typical tune signal on the spectrum analyzer, in which the point 2 and 3 show the frequencies of the horizontal β sideband, and the point 1 and 4 show the frequencies of the vertical β sideband. We may get that the horizontal tune νx and vertical tune νy is respectively 3.5346 and 2.6047. The measurement accuracy is about 1×10⁻⁴.
The simplest beta function measurement is to detect the shift in the betatron tune as the strength of an individual quadrupole magnet is varied. In HLS, four magnets are connected to the same power supply, and then the strengths K i (i = 1, L ,4) of four quadrupoles must be changed simultaneously, all by the same amount ∆K . In this case, the induced betatron tune change is related to the average beta function at the four quadrupoles as[4]
In HLS, there are some DC clearing electrodes with 800V in order to eliminate the ion trapping[2]. We calculate the electric field produced by DC clearing electrodes as[3]
Here,
β x, y
m
∆ν x , y
Length /m
, 25
Vclear The quadrupoles are 0.8eVClear 1 1 e ∂E x = 2 − 2 K x = E ∂x E c b 0 0 0,0 (2) ∂ E y K = e = −K x y E 0 ∂y 0,0 The tune shifts calculated with above focus strength are
∆ν x = −3.12 × 10 −6 VClear −6 ∆ν y = 2.42 × 10 VClear
≈ ±4π
(5) m∆Kl Here, l is the length of the quadrupole, m=4. Fig.4 shows the average beta function measured by above method as compared with the theoretical beta function.
(1)
b ≈ 37.75mm, c ≈ 48.98mm, Rw ≈ 1.14, rw ≈ 4 is voltage of DC clearing electrodes.
MEASUREMENT OF β FUNCTION
4
3.2 Measurement of the influence on the tune shift by DC clearing electrodes
VClear x x − 2 E x = 2 2 2 ln( / ) r R x ( y c ) x ( y b ) + + + + w w V y c y b + + E = Clear y ln(r / R ) x 2 + ( y + c) 2 − x 2 + ( y + b) 2 w w
(4)
0
2
4
6
βx
βx,y /m
10
12
14
16
Theoretical Curve of βx Measured Value of βx Theoretical Curve of βy Measured Value of βy
20
βy
15
8
10 5 0 Q1
(3)
-5
Q2
Q4 SF
B1 SD Q3
SF Q5
B2
Q8
Q6SD B3
Q7
Figure4: Comparing the measured average beta function with the theoretic beta function
0.003 0.002 0.001 0.000
∆νx,y
Additionally, we also measured the beta functions at Q7W and Q8N by the beam-based alignment system[5]. Comparing the measured beta functions at Q7W and Q8N with the theoretic value is shown by table 1. According to the experimental results, the measured beta functions are close to the theoretical curve in HLS.
Measured value of ∆νx Linear Fit of ∆ν x Measured value of ∆νy Linear Fit of ∆ν y
-0.001 -0.002
Table 1 Comparing the measured beta functions at Q7W and Q8N with the theoretic value
-0.003 -0.004 -200
0
200
400
600
800
1000
βx (m)
1200
VClear / V
Theoretic value
Measured value
Theoretic value
Measured value
Q7W
9.69
7.91
9.88
7.55
Q8N
20.75
22.09
3.24
3.57
Figure 3: The tune shift as a function of the change in VClear Fig.3 shows the tune shift as a function of the change in voltage of DC clearing electrodes. According to the experimental results, we get
738
βy (m)
Proceedings of the Second Asian Particle Accelerator Conference, Beijing, China, 2001
5 MEASUREMENT OF CHROMATICITY
5.2 Corrected chromaticity
In an electron storage ring, the chromaticity is characterized by the energy dependence of the tune, which is denoted ξ. Without the chromaticity correction, the natural chromaticity is a negative value, the head-tail instability[2] will occur. The natural chromaticity is usually corrected by means of two or more sextupole families. The corrected chromaticity should be slightly positive to avoid the head-tail instability.
The corrected chromaticity can be determined by measuring the tune shift as a function of the RF frequency[4]
(ξ x , y ) corr ≈ −α c
The natural chromaticity is obtained by detecting the variation of the betatron tune as a function the main dipole field strength,it is given by[4]
(ξ x , y ) nat ≈
5.3 Central frequency The central frequency can be determined by Measuring the chromaticity for different sexupole strengths. When the beam passes (on average) through the center of the sextupoles and quadrupoles at the central frequency, the tune doesn’t vary as the change of sexupole strength. The measurement result of the central frequency is shown in Fig.7. Here, the central frequency is about 204.03225±0.00089MHz.
(6)
∆I / I
Fig.5 shows the variation of the tune as a function of the main dipole field strength. 0.006
Measured value of ∆νx Linear Fit of ∆νx Measured value of ∆νy Linear Fit of ∆νy
0.004
∆νx,y
0.002
3.543
ξx=-1.16 3.542
0.000
ξx=0.25
νx
3.540
-0.004
ξx=0.85 3.539
ξx=1.72
3.538
-0.006 851.0
851.5
852.0
852.5
853.0
853.5
854.0
Bending magnet current /A
3.536 204.020
-0.001 -0.002 -0.003 -6
-4
-2
0
2
4
6
8
10
204.040
204.045
204.050
[1] B.G. Sun, D.H. He, et al. Tune Measurement System for HLS. Nuclear Techniques, Vol.24, No.1, January 2001, 47-51 [2] L.K. Chen, B.G. Sun, et al. Single Bunch Instabilities in HLS Ring. Proceedings of the Workshop on Beam Instabilities in Storage Rings, Hefei, China, July, 1994, 65-71 [3] B.G. Sun, P. Lu, et al. Research and measurement of the influence on the beam parameters by DC clearing electrodes. High Power Laser and Particle Beams, Vol. 13, No. 1, 2001.1, 108-112 [4] F. Zimmerman. Measurement and Correction of Accelerator Optics. Proceedings of the Joint USCERN-Japan-Russia School on Particle Accelerators, Montrux, 1998, 21-107 [5] B.G. Sun. Ph. D thesis. University of Science and Technology of China, 2000
0.000
-8
204.035
REFERENCES
Measured value of ∆νx Linear Fit of ∆νx Measured value of ∆νy Linear Fit of ∆νy
0.001
204.030
Figure7: The measurement of the central frequency
0.004
0.002
204.025
frf /MHz
According to equation (6), the natural chromaticity in horizontal and vertical is respectively –6.059 and – 2.634, whereas the design value is respectively -6.13 and 2.41. The measured results are fit close to the design values. 0.003
ξx=2.43
3.537
Figure5: Tune variation as a function of the change in bending magnet current
∆νx,y
ξx=-0.34
3.541
-0.002
-0.004 -10
(7)
∆f rf / f rf
Fig.6 shows the variation of the tune as a function of the RF frequency change. According to equation (7), the corrected chromaticity in horizontal and vertical is respectively 0.268 and 3.057.
5.1 Natural chromaticity
∆ν x , y
∆ν x , y
12
∆frf /kHz
Figure6: Tune variation as a function of the change in RF frequency
739