Danube sands compose an important segment of these soils and present the ... simple shear test, dynamic soil behavior, dynamic soil testing, Danube sand.
Measuring and modeling the dynamic behavior of Danube Sands Mesure et modélisation du comportement dynamique des sables du Danube Ray R.P., Szilvágyi Zs. 6]pFKHQ\L�,VWYiQ�8QLYHUVLW\��*\ĘU��+XQJDU\�
ABSTRACT: The adaptation of Eurocode 8 and development of high speed rail system in Hungary has created a greater need to define dynamic behavior of local soil groups. Danube sands compose an important segment of these soils and present the geotechnical engineer with several design challenges. The soils are present at river crossings and major development parcels throughout Hungary. Although the engineering behavior of these sands can vary over a wide range, they retain some common characteristics that will help the engineer to make decisions about geotechnical and structural designs. Samples of Danube sands were brought in the laboratory for dynamic testing, which included resonant column and torsional simple shear testing. This paper summarizes the dynamic behavior of this typical local soil group with emphasis on the dynamic properties themselves. Researches will find the methods and approach to evaluating properties helpful in their work while design engineers will understand how these properties are applied. RÉSUMÉ : A cause de l’entrée en vigueur de l’Eurocode 8, et aussi du développement des lignes ferroviaires à grand vitesse, il était plus en plus important de connaître le comportement dynamique des sols typiques du pays. Un partie de ces sols typiques sont des sols alluviaux granulaires du Danube. Bien que les caractéristiques de ces sols varient très largement, ils ont des caractéristiques communes aussi et leur connaissance peut aider fortement dans le dimensionnement des projets géotechniques et de structures. Des échantillons de sables du Danube ont été testés en laboratoire, à la colonne de résonnance et à l’appareil de cisaillement simple en torsion. Dans cette étude, nous résumons les propriétés dynamiques de ce sol typique. Les chercheurs porront trouver les méthodes d’évaluation du comportement des sols et les ingénieurs de projets géotéchniques pourront comprendre comment utiliser ces propriétés. KEYWORDS: resonant column test, torsional simple shear test, dynamic soil behavior, dynamic soil testing, Danube sand
1
INTRODUCTION
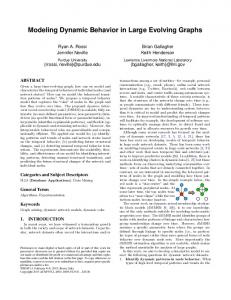
In the last couple of decades the importance of numerical modeling in Geotechnics has increased greatly and not only in research, but in everyday practice as well. On the one hand this is a result of the rapid and continuous progress of computer technology; on the other hand the many advantages of achieving more accurate and economical solutions help these approaches to become more widespread. These calculation methods have the great benefit of using advanced material models, which, if used carefully and properly, allow for better modeling. Many studies have shown that the accurate modeling of stiffness degradation with strain (and stress) is a key aspect in many dynamic as well as static geotechnical numerical calculations (e.g. earthquake vibrations, high speed railway induced vibrations, settlement calculations around retaining walls or tunnels etc.). It has been recognized, that soils behave linear-elastically only at very low strains (~10-4 %) and as the strains (and stresses) increase, the initially constant shear stiffness (Gmax) decreases gradually while the damping or hysteretic behavior becomes more pronounced (Figure 1). Modulus reductions to 5-10% of the original, low-strain value are common. Shown in Figure 1 are curves from Seed and Idriss (1970) for sand and Vucetic and Dobry (1989) for clay (PI=0). The level, at which this stiffness degradation starts is called threshold level and depends on soil type. If the strains in the soil increase above this level, non-linear behavior can be observed. Several complex soil models have been developed to capture this behavior of soils (Jardine 1980, Ramberg-Osgood 1948, Benz 2008). In general these models define a modulus reduction curve and a damping curve, and they can only produce accurate
results, if sophisticated laboratory and field test are used to determine these key soil parameters.
Figure 1. Stiffness degradation and damping increase with shear strain for sand and clay.
2 LABORATORY MEASUREMENT OF MODULUS DEGRADATION 2.1
Resonant Column – Torsional Simple Shear (RC-TOSS) Device Hardware
The device used in this study at Széchenyi István University GyĘr has been built and used for earlier researches by the author (Ray 1984, 2010; Ray and Woods 1987). In the last year, the device has been rebuilt and calibrated in GyĘr and it is now
1575
Proceedings of the 18th International Conference on Soil Mechanics and Geotechnical Engineering, Paris 2013
capable of loading and measuring at higher torques and wider strain ranges. It is a combined resonant column (RC) and torsional simple shear (TOSS) device. The device can drive a cylindrical specimen (ID=4.0 cm, OD=6.0cm, L=14cm) in torsion with the use of permanent magnets and electric coils. The specimens are covered by latex memebranes inside and out and are fixed at the base and free to rotate at the top, where the drive head is attached. The drive head consists of a coil and magnet system where there is open space between the magnet and coils. An accelerometer is used for measuring displacement during RC testing; the nature of acceleration measurement allows for very high accuracy at low amplitudes (Ȗ=10-4%). Proximitors measure the gap distance between their targets and are used for measuring rotation (strain) during TOSS tests. Since they are DC output devices, there is no low-frequency roll-off as in accelerometer measurements. An LVDT measures vertical displacement of the drive head. Its inner core is connected by a rigid threaded rod to the drive head. The other end of the rod is suspended on a spring, providing a counterforce to the drive head’s weight without impeding the RC measurements (Figure 2).
The RC test is capable of measuring the damping ratio as a function of strain amplitude by either the logarithmic decrement or half-bandwidth method. For low strain amplitudes, the halfbandwidth method works well. At higher amplitudes, it is often difficult to get stable readings and the log-decrement method generally works better. By using a cutoff switch that turns the coils into open circuits there is very little coil-generated damping during log decrement measurements. Additionally, the drive system can be given an offset DC voltage to apply static stress/strain then resonated with a low-amplitude signal to examine effects of different stress ratios (ı1/ı3) and static shear stress/strain (IJstatic,Ȗstatic) on shear modulus. With use of the data acquisition system and computer, various cyclic and arbitrary load histories can be applied. Hysteresis and secant/tangent moduli can then be computed from the aquired data. The unique design of the testing device allows for both RC and TOSS tests to be run on the same specimen any number of times and in any sequence. A particularly useful sequence is to perform low-amplitude RC between different stages of TOSS testing to evaluate the effects of each TOSS stage on the “fundamental” property Gmax. The baseline value of Gmax allows data to be normalized by reference strain (Ȗref) or other quantities. The same values for Gmax have been produced in bender element tests on triaxial specimens of the same soil. The drive system uses a 500-watt DC power amplifier that can be current-controlled. Under current (rather than voltage) control, the device can consistently deliver the same stress level during a test, even if the coils heat up. Using neodymium magnets, the device can generate shearing stresses greater than IJ = 200 kPa. Driving a specimen at resonance would increase the available force by a factor of 2-3x. 2.2
RC-TOSS Software
The device is controlled via Visual Basic for applications (VBA) within Excel. Resonant column testing is normally performed manually by seeking resonance with a frequency oscillator, oscilloscope, and precision digital multi-meter. However, the computer can perform frequency sweeps and measure accelerometer RMS output and period to capture resonance as well. More importantly, the TOSS testing can be performed as stress- or strain-controlled using a variety of waveforms. Most commonly, triangle wave loading is used for uniform cyclic loading or cyclic loading with static offset. Data acquisition of 200 different cycles, 200 data points per cycle are routine. The number of data points and recorded cycles is limited only by software memory. Arbitrary loading hisories can be used as well, most often to study effects of past load history and verify Masing criteria. Data is reduced and plotted through VBA and Excel Macros. Further data analysis can be performed later within Excel. Figure 2. RC-TOSS device with hollow-cylinder specimen, coils, magnets, accelerometer, proximitor targets and LVDT.
The upper and lower specimen ring have a porous interface and can provide saturation to the specimen. Pore pressures are measured at the confining cell’s outer port. Due to the extensive electronics, the confining medium is air. The driving system allows for individual control of the applied shear stresses as well as the cell pressure (with use of a pressure chamber) and the hollow cylindrical specimens have the great advantage of having nearly-uniform shear stress distribution throughout its cross-section. For the RC tests, the specimen is driven in a harmonic manner back and forth in torsion at very low strain amplitudes with varying frequencies in order to find resonance. From the obtained resonance frequency, the shear wave velocity and the shear modulus can be obtained.
1576
3
TESTING DANUBE SANDS
Candidates for initial testing were sands of various gradations found along the main channel and floodplain of the Danube River. These sands are of particular interest and importance due to building development along the Danube throughout Hungary, the widely varying in-situ conditions of the sands, and the potential for drastic strength reductions and liquefaction during seismic events. 3.1
Testing Sequence
Initial testing performed on the sands was as much to verify device performance as it was to establish dynamic properties. In order to verify proper operation of the equipment, most tests
Technical Committee 203 / Comité technique 203
were performed under regulated vacuum confinment of about 95 kPa. A typical testing sequence was as follows: 1. Prepare sample by pluviating through tube into split mold and membranes. Assemble remaining parts of device while under vacuum, then remove inner and outer split molds. 2. Perform low-amplitude RC (Ȗ§10-4%) versus time (1,2,5,10,20 min...) to asses duration-of-confinement effects, if any. 3. Perform TOSS uniform cyclic test at low amplitude (IJ=10 kPa) for 200 cycles of loading. Record and inspect hysteresis loops. 4. Perform low amplitude RC to asses any changes to Gmax due to TOSS loading. 5. Repeat (3),(4) by increasing TOSS stress level until specimen fails or device reaches maximum displacement. Usually steps of ǻIJ=10kPa were chosen. For an irregular loading history, the same sequence was followed where the absolute value of peak stress was gradually increased for each stage. 3.2
Figure 3. Modulus reduction and damping for two RC tests on Danube Sand.
Test Results
Preliminary tests have examined several behavior phenomena discussed in the literature. Among the aims of these tests were to shed light on several questions. 1. Can very different sorts of tests yield similar fundamental properties, namely shear wave velocity? Results from many tests have shown that the low amplitude shear wave velocity measured from RC tests and bender element tests in a triaxial cell are identical (Anka 2012). 2. How do TOSS and RC results compare vs. strain level? The testing so far has shown that, in the strain range where both are effective and accurate, they produce the same results. RC tests can measure modulus as much lower strain levels than TOSS. At very high strains, TOSS measurements of damping are much easier to obtain, as resonance is difficult to maintain at strains near failure. Since the TOSS device can be straincontrolled, the operator may closely monitor behavior near failure and avert collapse. Examples or RC test results are shown in Figure 3 where two sets of modulus reduction and damping sequences are shown. Data can be further processed to include reference strain. The advantage of using a dimensionless strain is that confinement effects are eliminated. Shown in Figure 4 are four such tests where confining stresses ranged from 50 to 200 kPa. Results of a TOSS cyclic test are shown in Figure 5. Each loop corresponds to a different peak shear stress level. Note the changes in secant modulus as the strain levels increase. Additionally hysteretic damping also increases with increasing strain, indicated by the larger areas of the stress-strain loops. 3. Do number of loading cycles have an impact on stressstrain behavior? For most of the testing performed so far, there is a definite effect. However, the cyclic behavior tends to stabilize after 100-200 cycles. Since these tests have been performed on dry soil, no pore pressure behavior has been examined yet. Figure 6 shows selected hysteresis loops of a TOSS test performed for 200 load cycles. The soil is stiffening with each cycle as shown by the more vertically inclined loops. Damping is decreasing, evidenced by the narrowing of the loop area.
Figure 4. Modulus reduction vs. dimensionless strain, Ramberg-Osgood curve fitted to the test data.
Figure 5. TOSS results for four different stress levels. This is cycle no. 200 for each stage of the test.
4. Do irregular load histories behave as predicted by soil models? This is a question that cannot be fully answered here since discussion of soil models and cylic loading criteria is rather complex. However, based on preliminary data, one can predict behavior under arbitrary loading histories if the G/Gmax vs. Ȗ curve is defined by RC or TOSS (or more typically, both) test data. One irregular load history was used to “track” the progress of the stress-strain curve across the initial backbone curve of the test. Contrary to the theory according to Pyke (1979) the stress strain curve does not follow the backbone curve at the time of crossing. Several tests have been performed and this particluar effect is yet to be seen.
1577
Proceedings of the 18th International Conference on Soil Mechanics and Geotechnical Engineering, Paris 2013
perform over the entire strain range. The device is capable of measuring pore pressure and vertical deflection as well, allowing for estimates of volume change. Measurements of shear wave velocity (leading to computation of shear modulus) have been consistent between the RC and TOSS methods for the same specimen and same strain level. Measurements using bender elements have confirmed the data as well. In the future further cyclic and irregular tests will be performed with the RC-TOSS device in order to study the effects of confining pressure, density and different irregular load histories. Due to the nature of the control system almost any sort of irregular loading can be studied; uniform cycles, uniform with offset, varying amplitudes or even totally irregular (e.g. any arbitrary earthquake time history). Other soils will also be tested and test results are planned to be compared to in-situ measurement results.
Figure 6. Effect of cycle number on hysteresis loops in a TOSS test.
Typical irregular loading results are shown in Figure 7 where both the load history and respose are presented. RambergOsgood models with an extended Masing criteria have been applied to the input stress history and yielded satisfactory results. Strain-rate effects will be evaluated as well, however for these sands, there seems to be little effect. Other soils planned for testing include soft and stiff clays found throughout the floodplain and beneath younger sediments along the Danube.
5
ACKNOWLEDGEMENTS
The authors acknowledge the financial support of the Széchenyi István University within the framework of TáMOP 4.2.2/B10/1-2010-0010 application. 6
REFERENCES
Anka M. 2012. Szemcsés talaj feszültségállapot-változásainak és feszültségtörtenetének hatása a nyíróhullámok terjedési sebességére BSc Diplomamunka. Széchenyi István Egyetem. 97pp. Benz T. 2006. Small Strain Stiffness of Soils and its Numerical Consequences. Ph.D. Dissertation. Institut für Geotechnik der Universität Stuttgart. 1-209. Jardine R.J., Potts D.M., Fourie A. B., Burland J. B. 1986. Studies of the influence of non-linear stress-strain characteristics in soilstructure interaction. Géotechnique 36, No.3, 377-396. Pyke, R.M. 1979. Nonlinear soil models for irregular cyclic loading. J. Geotech. Eng. Div., ASCE, 105(6), 715-726. Ramberg W. and Osgood W.R. 1948. Description of Stress Strain Curves by Three Parameters. Technical Note No. 902 National Advisory Committee for Aeronautics. 1-28. Ray R.P. 1983. Changes in Shear Modulus and Damping in Cohesionless Soil due to Repeated Loadings, Ph.D. dissertation, University of Michigan, Ann Arbor, MI., 417 pp. Ray R.P. and Woods R.D. 1987. Modulus and Damping Due to Uniform and Variable Cyclic Loading. Journal of Geotechnical Engineering, Vol. 114, No. 8. ASCE, 861-876. Ray R.P. 2010. Testing and analysis of deep sediments in Charleston SC. NEHRP Report. Columbia, South Carolina, 1-110. Seed H.B. and Idriss I.M. 1970. Soil Moduli and Damping Factors for Dynamic Response Analyses. Report No. EERC 70-10, University of California, Berkeley 1-70. Szilvágyi Zs. 2012. Dinamikus talajparaméterek meghatározása. Tavaszi Szél 2012 Konferenciakötet. DOSZ, Budapest, 458-465. Vucetic M. and Dobry R. 1991. Effect of Soil Plasticity on Cyclic Response. Journal of Geotechnical Engineering, Vol. 117, No. 1. ASCE. 89-107.
Figure 7. Irregular load history and test result.
4
CONCLUSION, FURTHER RESEARCH PLANS
The RC-TOSS system has shown itself to be a robust, accurate and reliable testing device. It can perform tests over a strain range from Ȗ = 10-4% to 1% for RC testing and 5x10⁻³%-1% for TOSS. Shearing stresses can exceed 200 kPa for TOSS and 400-600 kPa for RC. The magnet-coil system is very sturdy and produces sustained, static torque with only moderate heating. Resonance testing generally requires much less power and can
1578