Network traffic analysis is one option to evaluate distributed systems performance [2] ... Hadoop, an open source implementation of MapReduce. In this work we ...
!000111! IIIEEEEEEEEE 111888ttthhh IIInnnttteeerrrnnnaaatttiiiooonnnaaalll CCCooonnnfffeeerrreeennnccceee ooonnn PPPaaarrraaalllllleeelll aaannnddd DDDiiissstttrrriiibbbuuuttteeeddd SSSyyysssttteeemmmsss
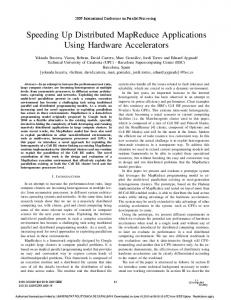
Measuring Distributed Applications Through MapReduce and Traffic Analysis Thiago Vieira, Paulo Soares, Marco Machado, Rodrigo Assad, Vinicius Garcia Federal University of Pernambuco (UFPE) – Recife, Pernambuco, Brazil {tpbv,pfas,masm,rea,vcg}@cin.ufpe.br File System (HDFS), for batch processing through Hadoop. Sniffer creates and executes monitoring plans with specification of places, time and amount of data to be captured. The desired network traffic is captured through Tcpdump, which saves network traffic in binary files, known as pcap files. The collected traffic is split into files with defined size, saved at the local SnifferServer filesystem, and transferred to HDFS. HDFS is optimized to store large files, but internally each file is split into blocks with a defined size. To store network traffic into HDFS it is necessary to avoid splitting these files, using files less than HDFS block size, or by providing for Hadoop an algorithm to split pcap files. Due the file splitting demands additional time and increases the complexity of the system, we save the traffic in files less than HDFS block size, through the split functionality provided by Tcpdump.
Abstract—Monitoring and evaluating distributed systems at runtime is a difficult effort. Network traffic analysis may be used to analyse distributed systems, but the capacity to analyse large amount of traffic is a challenge. This work proposes the use of MapReduce for deeply inspecting distributed systems network traffic, evaluating the effectiveness and the processing capacity of MapReduce for this inspection. Keywords-MapReduce; Network Traffic Analysis; Deep Packet Inspection; Distributed Systems.
I. I NTRODUCTION Distributed systems analysis, detection of root causes, and error reproduction are challenges that motivates efforts towards development of less intrusive mechanisms for profiling and monitoring distributed applications at runtime [1]. Network traffic analysis is one option to evaluate distributed systems performance [2], although there are limitations on the capacity of this analysis to process large amounts of network traffic in a short time [2], and on the scalability to process network traffic over the variations of resource demands. An approach to process large amounts of network traffic using MapReduce [3] was proposed by Lee et al [4], this approach splits network trace into packets to process each one individually and extract indicators from IP, TCP, and UDP. Lee et al did not consider using MapReduce for deep packet inspection and for measurement of distributed applications, which requires reassembly of more than one packet to retrieve information about the application’s session and state. We propose a solution based on MapReduce to perform deep inspection of distributed applications traffic, for evaluate the behavior of distributed systems at runtime, using commodity hardware, in a minimally intrusive way, through a scalable and fault tolerant approach based on Hadoop, an open source implementation of MapReduce. In this work we evaluated the effectiveness of MapReduce for a deep packet inspection algorithm and its processing capacity to measure a JXTA-based application.
Figure 1.
Figure 2 shows the architecture to process distributed applications traffic through MapReduce, implemented by AppAnalyzer, which is deployed at Hadoop nodes, and managed by Manager. AppAnalyzer is composed by protocol parsers, Mappers and Reducers for specific applications protocol. To evaluate JXTA-based application traffic, the Jnetpcap-jxta was developed, which parses network traffic into JXTA messages, along with the JxtaPerfMapper and JxtaPerfReducer, which extract performance indicators from the JXTA Socket communication layer. The JxtaPerfMapper receives as input a path of a pcap file stored in HDFS. Then its content is processed to evaluate the round-trip time of each content transmitted over a JXTA Socket, and to extract the number of connection requests and message arrivals at a peer. Manager is an agent that schedules the execution of MapReduce jobs and stores the results in a database.
II. T HE S OLUTION A RCHITECTURE In this section we present the architecture of the solution to capture and process network traffic of distributed applications. Specifics point of a datacenter must be monitored to capture the desired application traffic, Figure 1 shows the architecture of SnifferServer, which captures network traffic from specifics points and stores it into Hadoop Distributed !555222!---999000999777///!222 $$$222666...000000 ©©© 222000!222 IIIEEEEEEEEE DDDOOOIII !000...!!000999///IIICCCPPPAAADDDSSS...222000!222...!000444
Architecture to capture and store network traffic
777000444
500
CompletionTime - 16Gb CompletionTime - 34Gb
450
400
Time(s)
350
300
250
200
150
100 2
4
6
8
10
12
14
16
18
20
Nodes
Figure 2.
Architecture to process network traffic using MapReduce
Figure 3.
MapReduce usually splits blocks into records to be used as input for Map functions, we adopt whole files as input for Map tasks, to reassemble JXTA messages that had their content divided into some TCP packets. If a JXTA message is less than the PDU size, one TCP packet can transport one or more JXTA messages, but if a JXTA message is greater than the PDU size, the message is split into a number of TCP packets. Thus, it is necessary to evaluate the full content of some TCP segments to recognize JXTA messages.
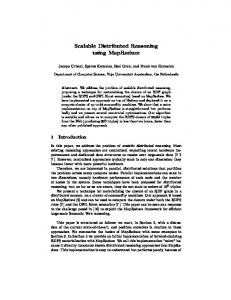
Job completion time processing 16Gb and 34Gb
nodes, in small clusters, and less significant gains with the increase in the number of nodes in the cluster. IV. C ONCLUSION We proposed the use of MapReduce to deeply inspect distributed applications traffic and we performed experiments to show the effectiveness and efficiency of our proposal. We showed that MapReduce can express algorithms for deep packet inspection of application traffic, through a case that extracted indicators from a JXTA application traffic. We processed whole files as input, without splitting, to avoid the cost of splitting and to be able to reassemble JXTA messages divided in some packets. We analysed the processing capacity and scalability of a small Hadoop cluster, showing that it is possible to use commodity hardware, or cloud computing services, to inspect application traffic and evaluate, in a minimally intrusive way, the behavior of distributed applications.
III. E VALUATION M ETHODOLOGY AND R ESULTS We performed two sets of experiments, with variation of input size and number of nodes, to evaluate the MapReduce processing capacity, scalability and effectiveness for application traffic analysis. We used as input a network traffic captured from a JXTA Socket communication between some peers, saved into datasets of 16Gb and 34Gb, split into 35 and 79 files, respectively. For each experiment set, we measured the completion time and capacity to process application network traffic. All experiments were performed at Amazon EC2, with nodes running Linux kernel 3.0.0-16, Hadoop version 0.20.203 and block size of 64MB, with 2 virtual cores, 2.5 EC2 Compute Units and 1.7GB of RAM. From the JXTA traffic analysed, we extracted indicators of the number of connection requests, reception of data and the round-trip time between content arrival from a client and server reply with an acknowledgement. With these data it is possible to evaluate the behavior of the system, to extract information about its performance, and to provide a better understanding of the behavior of a JXTA-based application. A maximum processing capacity of 259.40 Mb/s in a cluster with 19 nodes processing 34Gb was achieved. The completion time decreases with node addition into the cluster, but not in a linear function, because node addition increases the cost to manage the data replication, the task scheduling, and the cost with shuffling and sorting. The Figure 3 shows how node addition reduces the completion time and how the processing capacity scalability is achieved to process 16Gb and 34Gb of application traffic. In both graphics, the behavior of the scalability is similar, with more significant scalability gains, through addition of
V. ACKNOWLEDGMENTS This research was supported by National Institute of Science and Technology for Software Engineering (INES1 ), funded by CNPq and FACEPE, grants 573964/2008-4, and APQ-1037-1.03/08.
R EFERENCES [1] M. Armbrust, A. Fox, R. Griffith, A. D. Joseph, R. Katz, A. Konwinski, G. Lee, D. Patterson, A. Rabkin, I. Stoica, and M. Zaharia, “A view of cloud computing,” Commun. ACM, vol. 53, pp. 50–58, Apr. 2010. [2] A. Callado, C. Kamienski, G. Szabo, B. Gero, J. Kelner, S. Fernandes, and D. Sadok, “A survey on internet traffic identification,” Communications Surveys Tutorials, IEEE, vol. 11, no. 3, pp. 37 –52, quarter 2009. [3] J. Dean and S. Ghemawat, “Mapreduce: simplified data processing on large clusters,” Commun. ACM, vol. 51, pp. 107– 113, Jan. 2008. [4] Y. Lee, W. Kang, and Y. Lee, “A hadoop-based packet trace processing tool,” in Proceedings of the Third international conference on Traffic monitoring and analysis, ser. TMA’11. Berlin, Heidelberg: Springer-Verlag, 2011, pp. 51–63. 1 www.ines.org.br
777000555