The Astronomical Journal, 152:201 (15pp), 2016 December
doi:10.3847/0004-6256/152/6/201
© 2016. The American Astronomical Society. All rights reserved.
MEASURING STRUCTURAL PARAMETERS THROUGH STACKING GALAXY IMAGES Yubin Li1,2, Xian Zhong Zheng1, Qiu-Sheng Gu3,4, Yi-Peng Wang3,4, Zhang Zheng Wen1,2, Kexin Guo1, and Fang Xia An1,2 1
Purple Mountain Observatory, Chinese Academy of Sciences, 2 West Beijing Road, Nanjing 210008, China;
[email protected] 2 University of Chinese Academy of Sciences, 19A Yuquan Road, Beijing 100049, China 3 School of Astronomy and Space Science, Nanjing University, Nanjing 210093, China 4 Key Laboratory of Modern Astronomy and Astrophysics, Nanjing University, Ministry of Education, Nanjing 210093, China Received 2015 August 25; revised 2016 September 27; accepted 2016 September 27; published 2016 December 2
ABSTRACT It remains challenging to detect the low surface brightness structures of faint high-z galaxies, which are key to understanding the structural evolution of galaxies. The technique of image stacking allows us to measure the averaged light profile beneath the detection limit and probe the extended structure of a group of galaxies. We carry out simulations to examine the recovery of the averaged surface brightness profile through stacking model Hubble Space Telescope/Advanced Camera for Surveys images of a set of galaxies as functions of theSérsic index (n), effective radius (Re) and axis ratio (AR). The Sérsic profile best fitting the radial profile of the stacked image is taken as the recovered profile, in comparison with the intrinsic mean profile of the model galaxies. Our results show that, in general, the structural parameters of the mean profile can be properly determined through stacking, though systematic biases need to be corrected when spreads of Re and AR are counted. We find that theSérsic index is slightly overestimated and Re is underestimated at AR < 0.5becausethe stacked image appears to be more compact due to the presence of inclined galaxies; the spread of Re biases the stacked profile to have a higher Sérsic index. We stress that the measurements of structural parameters through stacking should take these biases into account. We estimate the biases in the recovered structural parameters from stacks of galaxies when the samples have distributions of Re , AR and n seen in local galaxies. Key words: galaxies: photometry – Galaxy: evolution – Galaxy: structure It is technically challenging to measure the brightness profiles toward large radius for typical (L*) and low-mass galaxies at high redshifts, even with deep imaging of the Hubble Space Telescope (HST; Szomoru et al. 2012). The size of galaxies may be underestimated if the extended structure of low surface brightness is not detected (e.g., Ferguson & Binggeli 1994; Naab et al. 2007, 2009; Bezanson et al. 2009; Mancini et al. 2010). Stacking is a powerful tool to suppress background noise and detect fluxes beneath the detection limit for individual objects. It has been applied successfully in studies with optical (e.g., Zibetti et al. 2004; van der Wel et al. 2008; van Dokkum et al. 2010), infrared (e.g., Zheng et al. 2006; Lee et al. 2010; Bourne et al. 2012; Guo et al. 2013), and radio (e.g., White et al. 2007; Garn & Alexander 2009; Hancock et al. 2011) imaging data. van Dokkum et al. (2010) examined the systematical effects in parameterizing the mean structure of massive galaxies via stacking ground-based images, finding that the averaged size and Sérsic index can be recovered when each of the stacked galaxies is characterized by a single Sérsic profile. In practice, galaxies tend to have multiple components (e.g., bulge+disk) with different surface brightness profiles; galaxies of similar stellar masses have aneffective radius and/or axis ratio (AR; or inclination angle) spanning over a range (Shen et al. 2003; Hao et al. 2006; Padilla & Strauss 2008). Further investigation is demanded to address how the scatter in effective radius, AR,and Sérsic index affects the recovered structural parameters from the stacked images and to what extent the results of stacking are accurate and robust. In this paper, we present the results of our simulation to characterize the dependences of the averaged structural parameters of faint galaxies derived from stacking on effective radius (Re ), AR, index of Sérsic profile (n), and the
1. INTRODUCTION The evolution of galaxies is found to both theoretically and observationally correlate with stellar mass (e.g., Kauffmann et al. 2003; Bundy et al. 2006; Dekel & Birnboim 2006; Guo & White 2008; Peng et al. 2010), yielding fundamental relationships between stellar mass and color (Baldry et al. 2004), size (Shen et al. 2003), metallicity (Tremonti et al. 2004), and star formation rate (Brinchmann et al. 2004) among local galaxies (see Blanton & Moustakas 2009for a review). These relationships evolve significantly out to high redshifts (e.g., Erb et al. 2006; Zheng et al. 2007; Wuyts et al. 2010, 2011; Brammer et al. 2011; Shapley 2011, and references therein). Much effort has been made to characterize the structural properties of galaxies at different cosmic epochs in order to dissect different physical processes regulating galaxy evolution (Conselice 2014). The size of massive galaxies has been found to increase on average by a factor of approximately three to fivesince z ~ 2 (e.g., Trujillo et al. 2006, 2007; Toft et al. 2007; Zirm et al. 2007; van der Wel et al. 2008; Mancini et al. 2010; Damjanov et al. 2011; Newman et al. 2012; Krogager et al. 2013; Belli et al. 2014; van der Wel et al. 2014). van Dokkum et al. (2010) found that an extended stellar halo around massive galaxies was gradually built up over cosmic time, suggesting that accretion of satellite galaxies plays a key role in governing the size growth of the massive galaxies (Naab et al. 2009; Oser et al. 2010). While physical interpretations of the dramatic size evolution are still under debate (e.g., Hopkins et al. 2010), the spatially resolved brightness profile as a function of redshift turns out to be crucial to unveiling the assembly histories of galaxies (e.g., Trujillo et al. 2011; Hilz et al. 2013). In particular, the brightness profiles of low-mass galaxies at high-z are poorly explored. 1
The Astronomical Journal, 152:201 (15pp), 2016 December
Li et al.
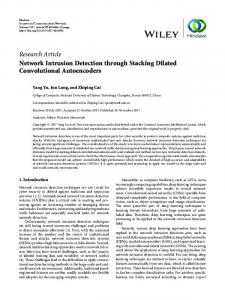
Figure 1. Comparison of surface brightness profiles with different n and Re. Cyan thick lines are the PSF profile arbitrarily shifted downward for clarity.
distributions of these parameters. We describe our methodology in Section 2. In Section 3,we present the simulation results. We discuss our results and summarize them in Section 4. We assume a cosmology with H0=70 km s−1 Mpc−1, WM =0.3, and WL =0.7 throughout this paper.
in analog-digital units for galaxy ranges from 24 to 24.75 mag (i.e., a factor of threespread in flux) in the HST images from COSMOS. We adopt a faint-end slope of −0.47 for early-type galaxies and −1.37 for late-type galaxies to determine the distribution of magnitude of the galaxies (Tomczak et al. 2014), and we add photon noise and background noise to match the noise level in the HST images of COSMOS in order to address the effect of noise. An IDL code SIMULATE_GALAXY. PRO5 (see Häussler et al. 2007, for more technical details) is used to create a galaxy model image at given n, Re,and AR. We also randomly locate the center of a model galaxy within a pixel to match observations. A set of galaxy model images is shifted and aligned to the same center before stacking. Due to the noises, the measured center of a model galaxy slightly differs from the actual center. We will discuss the effects of this issue on the final conclusions in Section 3.7. In practice, the structural parameters are barely known for individual faint high-z galaxies; the stacked image is often obtained by directly co-adding the aligned galaxy images without corrections for inclination, orientation, and size (but see, e.g., Zibetti et al. 2005); the stacked surface brightness profile is usually derived from the stacked image using circular apertures. We generate galaxy models with structural parameters spanning over sufficiently wide ranges: 1 n 6, 0. 05 Re 0. 75, and 0.1 AR 1.0. First, we examine the measurement of surface brightness profiles derived using circular apertures from a single model image in relations to each of structural parameters n , Re ,and AR. Second, we test the recovery of the mean surface brightness profile when a set of stacked galaxies has two parameters fixed and the third parameter following a certain distribution. Each set contains 700 model images, which is representative of practical cases for stacking. We divide galaxy models into late-type (1 n 2.5) and early-type (2.5 < n 6) because the two populations are distinct in structure (Blanton & Moustakas 2009). We adopt the log-normal distributions of Re for the two populations from Shen et al. (2003). The log-normal distribution of Re is described by the scatter sln (Re) and the median áReñ. More
2. METHODOLOGY 2.1. Galaxy Models The existing deep optical and near-infrared imaging data from large surveys with HST, including GEMS (Rix et al. 2004), COSMOS (Scoville et al. 2007), and CANDELS (Grogin et al. 2011; Koekemoer et al. 2011), provide the basis for a stacking analysis of faint high-z galaxies. In particular, the HST/Advanced Camera for Surveys (ACS) imaging of COSMOS over 1.48 deg2 (Koekemoer et al. 2007) through the F 814W (i) filter allows for morphological examination for large samples of galaxies. In our simulations, we adopt a pixel size of 0. 05 (same as HST/ACS pixel size) and ACS pointspread function (PSF) in the i band to generate galaxy model images. A physical scale of 100 kpc then corresponds to [280, 250, 239] pixels at z=[0.7, 1, 2]. A size of 351×351 pixels is chosen for the model images to have the radial surface brightness profile extended to R=50 kpc and have background estimation out to R=70 kpc for galaxies at z > 0.7. Three structural parameters are used to characterize the twodimensional model image of a galaxy: index of Sérsic profile (n), effective radius (Re) and AR. Position angle is randomly chosen between 0° and 180° for AR < 1. The Sérsic profile is described by I (r ) = I0 exp {- bn [(r re )1
n
- 1]}.
(1 )
The AR, defined as the ratio of minor axis b over major axis a, measures the elongation in morphology for early-type galaxies or the inclination for late-type galaxies. The model galaxy is centered at the centroid of the image, which is then convolved with the empirical PSF derived from HST/ACS i-band images using a number of isolated bright stars. The full width at half maximum of the PSF is RPSF = 0. 11 or 2.2 pixels. The total brightness of the model image is scaled to match the total flux
5
2
http://www.mpia.de/GEMS/fitting_utilities/simulate_galaxy.pro
The Astronomical Journal, 152:201 (15pp), 2016 December
Li et al.
Table 1 Structural Parameters of Galaxy Models
2.2. Stacking Galaxy Images A set of model images for stacking have the same size of 351×351 pixels, with photon noise and background noise counted. Before stacking a set of model galaxy images, we first measure the positions of the galaxies using sextractor (Bertin & Arnouts 1996) and shift them to the same position in all images. We note that the measurement errors of positions and shifting of images introduce uncertainties into the stacked profile. We also stack model images free from noise and offsets in position to quantify the corresponding uncertainties due to the noises and errors in aligning the galaxies. Each set contains 700 galaxy model images and is combined using the averaging algorithm. Because the position angle of model galaxies is randomly distributed, the averaged profile is rotationally symmetric. The radial surface brightness profile is thus sufficient to characterize the averaged profile. The radial profile is derived from the stacked image using 21 circular apertures with radii from 0.5 to 140 pixels evenly split in logarithm. The software tool aper.pro from the IDL Astronomy User’s Library6 is used to perform aperture photometry. We use an annulus of r = 6. 24 to r = 8. 74 (about 50–70 kpc at z ~ 1) for sky background estimation.
Single-profile Models n Re AR
1, 1.5, 2.5, 4, 6 1.0, 2.5, 5.0, 10.0, 15.0 0.10, 0.17, 0.34, 0.50, 0.64, 0.76, 0.86, 0.93, 0.98, 1.00
Models Involving AR Spread n Re
1, 1.5, 2.5, 4, 6 1.0, 2.5, 5.0, 10.0, 15.0
Models Involving Re Spread n Re,0 AR
1, 1.5, 2.5, 4, 6 1.0, 2.5, 5.0, 10.0, 15.0 1.0
Models Involving AR and Re Spreads n Re,0
1, 1.5, 2.5, 4, 6 1.0, 2.5, 5.0, 10.0, 15.0
Models Involving n Spread
ánñ Re AR
1.5, 3.5 1.0, 2.5, 5.0, 10.0, 15.0 1.0
2.3. The Intrinsic Surface Brightness Profile A measured surface brightness profile usually needs to correct for the PSF effect in order to obtain the intrinsic profile. Instead, we follow Szomoru et al. (2012) to fit the onedimensional (1D) radial surface brightness profile of a stacked image with a library of 1D Sérsic profiles convolved by the same PSF. The library is created in the same way as we generate galaxy models and extract their radial profiles using circular apertures, covering 0. 01 Re 1. 00 in a step of 0. 01 and 0.1 n 8 in a step of 0.1. The method of least squares is used to select the best fitting and the corresponding Sérsic profile is taken as the intrinsic profile for the stacked image. Similarly, the decomposition of a 1D surface brightness profile into bulge+disk components can be done by best fitting the profile with the combination of two distinct Sérsic profiles.
Models Involving AR, Re, and n Spreads
ánñ Re,0
1.5, 3.5 1.0, 2.5, 5.0, 10.0, 15.0
Note. (1) The effective radius Re is given in units of pixels (0. 05 per pixel). Here Re = 15 pixels corresponds to a physical scale of 5.4, 6.0, and 6.3 kpc at z = [0.7, 1, 2], respectively. (2) The given values of the axis ratio AR correspond approximately to the inclination anglesof 90, 80, 70, 60, 50, 40, 30, 20, 10, and 0 for a disk galaxy. A minimum AR=0.1 is chosen when the galaxy is edge-on. (3) Re,0 refers to the median of a log-normal distribution of Re.
massive galaxies have larger áReñ. The AR distribution of latetype galaxies comes from Padilla & Strauss (2008) and that of early-type galaxies from Hao et al. (2006) is adopted. At a given AR distribution, the other two parameters n and Re vary across the corresponding parameter space. When n falls into 1 n 2.5 and 2.5 < n 6, the AR distribution of the latetype and of the early-type galaxies are used, respectively. Furthermore,Re ranges from 0. 05 to 0. 75 (1–15 pixels), corresponding to a physical scale of 0.5–6.0 kpc at z=1. Similarly, we generate each set of model images for stacking at a fixed n and AR=1.0 with Re following the given distribution. Third, we let AR and Re follow the corresponding distributions and generate models as functions of n and áReñ to see the integrated effect of the spreads of these parameters. Finally, we let AR and Re follow the distributions as described above, and Sérsic index n follows a uniform distribution between one and two for late-type galaxies, and three and four for early-type galaxies. This simulates the case that faint galaxies are usually selected by color (or type) and mass (or luminosity), and their AR, Re, and n often spread over a certain range. Table 1 lists the structural parameters of galaxy models adopted in our simulations. Figure 1 demonstrates the surface brightness profiles of these single-profile models with AR=1 for comparison.
3. ANALYSIS AND RESULTS 3.1. The Elongation/Inclination Effects The elongation (or inclination for disk galaxies) of individual stacked galaxies is usually not corrected in stacking. Here we examine how the elongation/inclination affects the recovery of the structural parameters of a Sérsic profile. We extract the radial surface brightness profiles using circular apertures from the single-profile galaxy model images listed in Table 1. We note that these model images are convolved with ACS PSF. Figure 2 shows the single Sérsic profiles as functions of n, Re,and AR. The PSF profile is also presented with an arbitrary normalization for clarity. Red and blue lines show AR=0.34 and 0.68 in each panel. We can see that the surface brightness profile of a galaxy appears to be more compact at edge-on than at face-on when circular apertures are adopted. The bias becomes larger for late-type galaxies with larger Re. We measure the structural parameters from a radial surface brightness profile using the method described in Section 2.3. Figure 3 shows the effects of the elongation/inclination on the 6
3
http://idlastro.gsfc.nasa.gov/
The Astronomical Journal, 152:201 (15pp), 2016 December
Li et al.
Figure 2. Comparison of the surface brightness profiles extracted using circular apertures from model galaxies of given axis ratios (AR). Black lines show the galaxy models with AR=1 (face-on). Red lines represent AR=0.34 and blue lines represent AR=0.68. Gray thick lines show the PSF profile arbitrarily shifted downward for clarity.
with n=6 and Re = 15 pixels. This indeed leads to the oversubtraction of background in our measurements, and consequently totheunderestimate of both Sérsic index n and effective radius Re for early-type galaxies. We note that the underestimate of Sérsic index due to background oversubtraction can be corrected once a larger annulus is adopted for thebackground estimate. For a model galaxy with n=6 and Re = 15 pixels, thebackground estimate from outer regions of R > 465 pixels (186 kpc at z = 1) may suppress light contamination from the galaxy to 2.5) from Hao et al. (2006). These images are stacked together and a radial surface brightness profile is then obtained. The intrinsic parameter of the mean profile is given by (n, Re). Figure 5 shows the results of our simulation when AR is spread according to a realistic distribution rather than fixed. The two empirical AR distributions are shown in the inner panels. The left plot gives the difference between recovered Re and input Re as a function of the input Re and the right plot presents the deviation of recovered n from input n as a function of the input n. The recovered Re is systematically smaller by 12%–27% over 1 Re 15 pixels. For late-type galaxies, the degree of theunderestimate in Re does not depend on Re itself, suggesting that the AR distribution is responsible for the underestimate. However,for early-type galaxies, the degree of underestimate in Re increases as the Re increases. Given that the oversubtraction of background becomes more serious for earlytype galaxies of larger size, it is reasonable to attribute the increase of the degree of underestimate in Re to the oversubtraction of background. Apparently, the estimate of Re is more biased for late-type galaxies due to the highly inclined ones (AR < 0.5), which are absent in the early-type galaxies when the effective radius is not very large. Similarly, n is overestimated by up to 20% for late-type galaxies because of the inclination effect due to those with AR < 0.5. Again, the overestimate of n does not rely on Re significantly. For earlytype galaxies, n can be underestimated by up to 15%, and the underestimation of n increases as n increases. As most of them are with AR > 0.5 in terms of the AR distribution from Hao et al. (2006), the overestimation of n can be ignored for earlytype galaxies, thus the oversubtraction of background dominates the estimation of n and makes n underestimated, especially for galaxies with larger n,which have amore extended halo in the outskirts. As shown in Figure 3, the recovery of n is marginally biased by inclination/elongation effects at AR > 0.5. These results denote that the function of the AR distribution regulates the deviation of the recovered Re and n from the original values for late-type galaxies, and the estimation of background affects the estimation of structural parameters for early-type galaxies. Differing from the claim in van Dokkum et al. (2010) that the recovery of structural parameters is not sensitive to the distribution of AR, we show that the AR distribution may significantly bias the recovery of Re and n, dependent on the fraction of highly inclined or elongated ones; the stacked profile appears to be more compact (i.e., with smaller Re and higher n at the same time) if the elongation/inclination effect is not corrected.
Figure 3. Recovery of structural parameters Sérsic index n and effective radius Re as a function of axis ratio AR. Black squares (barely seen behind blue circles for late-type galaxies) mark the starting points at given (n, Re). Color-coded circles represent the recovered (n, Re) at corresponding AR from the starting points (black squares).
Figure 4. Fraction of light out of R=125 pixels as a function of Sérsic index n and effective radius Re. We can see that the light in the outer regions is marginal for late-type galaxies, but increases as the Re increases for early-type galaxies.
decreasing AR. The recovered Re deviates from the intrinsic value by up to 50% at the minimal AR; and the deviation does not strongly depend on Re and n. We conclude that elongation/inclination (AR) influences the estimate of structural parameters n and Re when the radial surface brightness profile is extracted from a galaxy image using circular apertures. The galaxy would appear to be more compact, i.e., with larger n and smaller Re, at decreasing AR, if the elongation/inclination is ignored. We point out that the bias in recovering structural parameters through stacking from elongation effects is negligible for early-type galaxies (n > 2.5) because the early-type galaxies usually have AR > 0.5 (at least in the local universe, Hao et al. 2006), and the main source of bias is from background estimation. For late-type galaxies (n 2.5), the inclination leads to theoverestimate of n and theunderestimate of Re. The next step is to test the measurement of the mean surface brightness profile from the stacked image of individual galaxy
3.3. Effects of Re Spread Figure 6 shows our simulation results of stacking model galaxies with a fixed n but Re following a log-normal distribution. Here AR=1 is adopted to get rid of the AR 5
The Astronomical Journal, 152:201 (15pp), 2016 December
Li et al.
Figure 5. Recovery of effective radius Re and Sérsic index n through stacking in which the stacked model galaxies spread in AR. Left panel shows the deviation of the recovered effective radius Re,r relative to the input effective radius Re,i as functions of Re,i and n. Right panel shows the deviation of the recovered Sérsic index n r relative to the input Sérsic index n i as functions of n i and Re. The inner panels show the adopted AR distribution of early-type galaxies (n > 2.5) from Hao et al. (2006) and of late-type galaxies (n 2.5) from Padilla & Strauss (2008).
Figure 6. Recovery of median effective radius áReñ and Sérsic index n by stacking model galaxies with Re satisfying the log-normal distribution from Shen et al. (2003). Left plot shows the deviation of the recovered effective radius áReñr relative to the input median Re,0 as functions of Re,0 and input Sérsic index n i . Right plot shows the deviation of the recovered Sérsic index n r relative to n i as functions of n i and Re,0 . Here AR is fixed to unity (face-on).
effect. The log-normal distribution is described by the median Re,0 and scatter sln (Re). We adopt sln (Re) = 0.3 dex for early-type galaxies and sln (Re) = 0.5 dex for late-type galaxies from Shen et al. (2003). As shown in the left panel of Figure 6, the input median effective radius Re,0 is well recovered through stacking for late-type galaxies and early-type galaxies with small effective radius, but for early-type galaxies with large radius, the underestimation of Re can be up to 15% due to the oversubtraction of background. However, n is increasingly overestimated by up to 60% at decreasing n. This tendency has no dependence on the median of the log-normal distribution of Re. For early-type galaxies, the n can still be underestimated due to the oversubtraction of background. One can infer from Figure 6 that the median of a log-normal distribution of Re can be properly measured from the stacked profile of galaxies; but the spread of Re leads to an overestimate of n for late-type galaxies (n 2.5).
spreads in stacking and examine their effects on the recovery of the structural parameters. Again, AR and Re follow distinct distributions for early- and late-type galaxies as mentioned before. We note that the effects of the two spreads are not correlated with the median Re,0 . Figure 7 shows the results of stacking with both the AR and Re spreads involved. We also overplot the results from Figures 5 and 6 for comparison. We can see that the mixture of AR and Re spreads biasesthe estimates of median Re,0 and n in the same way as the effects of the two spreads combine linearly together. The median Re,0 is underestimated by 20%– 27% and 10%–20% for late-type and early-type galaxies, depending on the Re of the galaxies, respectively, caused by the AR spread and the estimation of background; and n is increasingly overestimated by up to 70% at decreasing n, equal to a linear combination of the deviations caused by each of the two spreads. In summary, our simulations manifest that the measured size (Re) and Sérsic index (n) of the averaged profile by stacking a set of galaxies deviate from the input values when the stacked galaxies disperse in AR and/or thehalf-light radius (Re). The deviations depend on the type of stacked galaxies (n) and distribution functions of AR and Re. The stacked profile tends to be more compact for late-type galaxies, and the oversubtraction of background dominates the estimation of structural parameters for early-type galaxies and causethe
3.4. Effects of AR and Re Spreads We have shown that the spread of AR biases the estimates of structural parameters of the mean profile through stacking, leading the stacked profile to be more compact, say with smaller Re and higher n; and the spread of Re does not influence the estimate of median Re but deviates n to be higher. The effects of the two spreads are significant only for thestacking of late-type galaxies (n 2.5). Now we include both the two 6
The Astronomical Journal, 152:201 (15pp), 2016 December
Li et al.
Figure 7. Recovery of structural parameters Re and n through stacking model galaxies with AR and Re spreads counted. Left plot shows the deviation of recovered mean áReñr relative to the input median Re,0 as a function of Re,0 . Right plot shows the deviation of recovered Sérsic index n r relative to the input n i as a function of n i . Squares represent the results when the two spreads are involved. Circles mark the results from Figure 5in which only the AR spread is counted. Triangles show the results when the Re spread is included (from Figure 6). Blue and red colors correspond to n 2.5 and n > 2.5, respectively.
Figure 8. Recovery of structural parameters Re and n through stacking galaxies with Sérsic index n uniformly distributed between 1 to 2for late-type galaxies and three to four for early-type galaxies. The effective radius is fixed at agiven value in each stacking set and the axis ratio AR=1 is chosen for all sets. The left panel shows the deviation of the recovered effective radius Re,r relative to the input value Re,i as a function of Re,i for the two types of galaxies. The right panel shows the deviation of the recovered Sérsic index n r relative to the median input n i as a function of the effective radius Re,i .
profile to be smaller in both Re and n. With given distributions of AR and/or Re, the deviations in estimates of Re and n can be quantitatively determined and thus corrected accordingly. It is worth noting that the effects caused by the spread of n depend strongly on the distribution function of n. The averaged profile of a set of Sérsic profiles with fixed Re and AR=1 is much closer to the median one. The derived n from stacking are rather reliable with uncertainties of 2.5 leads to an underestimate of 12% in áReñ and little influence on the estimate of n . 4. The spread in Re plays a different role from that of the spread in AR, which leads the mean-stacked profile of galaxies to be more concentrated. Taking the log-normal distribution of Re from Shen et al. (2003) into account, áReñ is not biased for either early-type or late-type galaxies, and Sérsic index n is overestimated by 50% for the late-type galaxies but not significantly biased for the early-type galaxies. When Re scatters within a spread, the stacked galaxies with a size smaller than the median contribute more to the central part of the integrated light, and those with a size larger than the median contribute more to the extended wing, resulting in a mean-stacked profile with a higher Sérsic index and an effective radius equal to the median of the Re spread. 5. The effects of the spreads in AR and Re are linearly coadded on the estimate of structural parameters of a stacked image. The actual corrections for these effects rely on the spread functions. 6. Accounting for the spread of n with a uniform distribution, we find that the recovered structural parameters remain unchanged compared tothose derived with no spread in n counted, suggesting that the spread of n does not significantly effectthe stacked results. 7. In thestacking analysis, the galaxies are often classified by the stellar mass and type, and the AR, Re and n all have spreads. In this case, we find that the effective radius Re can be underestimated by 20% to 27% for late-type galaxies, and only 10% to 15% for early-type galaxies, due to the AR distribution of galaxies. The Sérsic index n can be well recovered for early-type galaxies, but can be overestimated for late-type galaxies due to both the AR and Re distribution. 8. For faint galaxies, the center we find will have an offset to the real center of galaxies due to the noise. We also test this effect by stacking galaxies,using the real center instead of the center found by Sextractor. We find that for galaxies in the range of24–24.75 mag, the 68% percentile of the centering offset is not more than 1 pixel and does not influence the results. 9. Recovery of structural parameters of bulge+disk galaxies are regulated by the bugle-to-total ratio B T , the Re ratio of the two components and the Sérsic index of the bulge
if the disk is exponential (n = 1). The global Sérsic index nT mainly depends on theSérsic index of the bulge and B T . The global effective radius Re,T can be approximately seen as the light-weighted combination of bulge size Re,B and disk size Re,D . Furthermore, the ratio Re,B Re,D also has influence on nT at a second-order level. The AR and Re spreads of the disks and the Re spread of the bulges lead nT to be increasingly overestimated and Re,T to be increasingly underestimated at decreasing B T . 10. By dual-Sérsic profile fitting to the stacked profile of bulge+disk galaxies, the averaged structural parameters of the bulge and disk components can be determined,thoughthe uncertainties are large. The AR and Re spreads of disks arethe main causes of the increasing overestimate of B T (also Re,B) at decreasing intrinsic B T . The issue of the bulges being pseudo or classical dramatically changes the results of the dual-Sérsic profile fitting for a composite profile. Thecaveat that the measurement of bulge growth in a statistical sense is significantly affected by the AR and Re spreads of the disks and Sérsic index of the bulges in the bulge+disk decomposition through stacking. We thus stress that the interpretation of stacking results should take these biases into account and the corrections for the biases are strongly dependent on the structural parameters of stacked galaxies and their spread functions. We are grateful to the referee for the valuable suggestions, which significantly improved this manuscript. This work is supported by the Strategic Priority Research Program “The Emergence of Cosmological Structures” of the Chinese Academy of Sciences (grant No. XDB09000000), National Basic Research Program of China (973 Program 2013CB834900),and NSFC grant (U1331110). REFERENCES Balcells, M., Graham, A. W., & Palmero, L. D. 2003, ApJ, 582L, 79 Baldry, I. K., Glazebrook, K., Brinkmann, J., et al. 2004, ApJ, 600, 681 Belli, S., Newman, A. B., & Ellis, R. S. 2014, ApJ, 783, 117 Bertin, E., & Arnouts, S. 1996, A&AS, 117, 393 Bezanson, R., van Dokkum, P. G., Tal, T., et al. 2009, ApJ, 697, 1290 Blanton, M. R., & Moustakas, J. 2009, ARA&A, 47, 159 Bournaud, F., Elmegreen, B. G., & Elmegreen, D. M. 2007, ApJ, 670, 237 Bourne, N., Maddox, S. J., Dunne, L., et al. 2012, MNRAS, 421, 3027 Brammer, G. B., Whitaker, K. E., van Dokkum, P. G., et al. 2011, ApJ, 739, 24 Brinchmann, J., Charlot, S., White, S. D. M., et al. 2004, MNRAS, 351, 1151 Bruce, V. A., Dunlop, J. S., Cirasuolo, M., et al. 2012, MNRAS, 427, 1666 Bundy, K., Ellis, R. S., Conselice, C. J., et al. 2006, ApJ, 651, 120 Conselice, C. J. 2014, ARA&A, 52, 291 Damjanov, I., Abraham, R. G., Glazebrook, K., et al. 2011, ApJL, 739, L44 Dekel, A., & Birnboim, Y. 2006, MNRAS, 368, 2 Erb, D. K., Shapley, A. E., Pettini, M., et al. 2006, ApJ, 644, 813 Ferguson, H. C., & Binggeli, B. 1994, A&ARv, 6, 67 Garn, T., & Alexander, P. 2009, MNRAS, 394, 105 Graham, A. W. 2001, AJ, 121, 820 Grogin, N. A., Kocevski, D. D., Faber, S. M., et al. 2011, ApJS, 197, 35 Guo, K., Zheng, X. Z., & Fu, H. 2013, ApJ, 778, 23 Guo, Q., & White, S. D. M. 2008, MNRAS, 384, 2 Hancock, P. P., Gaensler, B. M., & Murphy, T. 2011, ApJL, 735, L35 Hao, C. N., Mao, S., Deng, Z. G., Xia, X. Y., & Wu, H. 2006, MNRAS, 370, 1339 Häussler, B., McIntosh, D. H., Barden, M., et al. 2007, ApJS, 172, 615 Hilz, M., Naab, T., & Ostriker, J. P. 2013, MNRAS, 429, 2924 Hopkins, P. F., Bundy, K., Hernquist, L., Wuyts, S., & Cox, T. J. 2010, MNRAS, 401, 1099 Kauffmann, G., Heckman, T. M., White, S. D. M., et al. 2003, MNRAS, 341, 54
14
The Astronomical Journal, 152:201 (15pp), 2016 December
Li et al.
Koekemoer, A. M., Aussel, H., Calzetti, D., et al. 2007, ApJS, 172, 196 Koekemoer, A. M., Faber, S. M., Ferguson, H. C., et al. 2011, ApJS, 197, 36 Kormendy, J., & Kennicutt, R. C., Jr. 2004, ARA&A, 42, 603 Krogager, J.-K., Fynbo, J. P. U., Ledoux, C., et al. 2013, MNRAS, 433, 3091 Lang, P., Wuyts, S., & Somerville, R. S. 2014, ApJ, 788, 11 Lee, N., Le Floc’h, E., Sanders, D. B., et al. 2010, ApJ, 717, 175 Mancini, C., Daddi, E., Renzini, A., et al. 2010, MNRAS, 401, 933 Naab, T., Johansson, P. H., & Ostriker, J. P. 2009, ApJL, 699, L178 Naab, T., Johansson, P. H., Ostriker, J. P., & Efstathiou, G. 2007, ApJ, 658, 710 Newman, A. B., Ellis, R. S., Bundy, K., & Treu, T. 2012, ApJ, 746, 162 Oser, L., Ostriker, J. P., Naab, T., Johansson, P. H., & Burkert, A. 2010, ApJ, 725, 2312 Padilla, N. D., & Strauss, M. A. 2008, MNRAS, 388, 1321 Peng, Y.-j., Lilly, S. J., Kovač, K., et al. 2010, ApJ, 721, 193 Rix, H.-W., Barden, M., Beckwith, S. V. W., et al. 2004, ApJS, 152, 163 Scoville, N., Aussel, H., Brusa, M., et al. 2007, ApJS, 172, 1 Shapley, A. E. 2011, ARA&A, 49, 525 Shen, S., Mo, H. J., White, S. D. M., et al. 2003, MNRAS, 343, 978 Szomoru, D., Franx, M., & van Dokkum, P. G. 2012, ApJ, 749, 121
Toft, S., van Dokkum, P., Franx, M., et al. 2007, ApJ, 671, 285 Tomczak, A. R., Quadri, R. F., Tran, K.-V. H., et al. 2014, ApJ, 783, 85 Tremonti, C. A., Heckman, T. M., Kauffmann, G., et al. 2004, ApJ, 613, 898 Trujillo, I., Conselice, C. J., Bundy, K., et al. 2007, MNRAS, 382, 109 Trujillo, I., Ferreras, I., & de La Rosa, I. G. 2011, MNRAS, 415, 3903 Trujillo, I., Förster Schreiber, N. M., Rudnick, G., et al. 2006, ApJ, 650, 18 van der Wel, A., Franx, M., van Dokkum, P. G., et al. 2014, ApJ, 788, 28 van der Wel, A., Holden, B. P., Zirm, A. W., et al. 2008, ApJ, 688, 48 van Dokkum, P. G., Whitaker, K. E., Brammer, G., et al. 2010, ApJ, 709, 1018 White, R. L., Helfand, D. J., Becker, R. H., Glikman, E., & de Vries, W. 2007, ApJ, 654, 99 Wuyts, S., Cox, T. J., Hayward, C. C., et al. 2010, ApJ, 722, 1666 Wuyts, S., Förster Schreiber, N. M., van der Wel, A., et al. 2011, ApJ, 742, 96 Zheng, X. Z., Bell, E. F., Rix, H.-W., et al. 2006, ApJ, 640, 784 Zheng, X. Z., Dole, H., Bell, E. F., et al. 2007, ApJ, 670, 301 Zibetti, S., White, S. D. M., & Brinkmann, J. 2004, MNRAS, 347, 556 Zibetti, S., White, S. D. M., Schneider, D. P., & Brinkmann, J. 2005, MNRAS, 358, 949 Zirm, A. W., van der Wel, A., Franx, M., et al. 2007, ApJ, 656, 66
15