See discussions, stats, and author profiles for this publication at: https://www.researchgate.net/publication/259671799
Mechanical and Frictional Properties of Bioelastomers: Part 2: Differences of Strain Characteristics of the Ski.... Article · January 2009 CITATIONS
READS
0
50
4 authors, including: M.F. Kurek
Serge V. Shil’ko
8 PUBLICATIONS 1 CITATION
National Academy of Sciences of Belarus
SEE PROFILE
354 PUBLICATIONS 280 CITATIONS SEE PROFILE
Anichkin V.V. Gomel State Medical University 6 PUBLICATIONS 0 CITATIONS SEE PROFILE
Some of the authors of this publication are also working on these related projects: «Study of nonlinear dynamics of ionic and electronic charge bearers space distribution in polar active thing-layer meso- and nanosized structures» View project Development of fundamental approach to creating wear-resistance extrudable biocompatible polymer nanocomposites for 3D printing of implants with complex geometry View project
All content following this page was uploaded by Serge V. Shil’ko on 02 September 2014.
The user has requested enhancement of the downloaded file.
ISSN 1812-5123. Russian Journal of Biomechanics, 2009, Vol. 13, No. 4 (46): 62–73
MECHANICAL AND FRICTIONAL PROPERTIES OF BIOELASTOMERS. PART 2: DIFFERENCES OF STRAIN CHARACTERISTICS OF THE SKIN IN EPI- AND HYPOGASTRIC ANATOMIC REGIONS M.F. Kurek1, S.V. Shilko2, V.V. Anichkin1, S.B. Anfinogenov2 1
Gomel State Medical University, 5 Lange Street, 246000, Gomel, Belarus, e–mail:
[email protected] V.A. Belyi Metal–Polymer Research Institute of National Academy of Sciences of Belarus, 32а Kirov Street, 246050, Gomel, Belarus, e–mail:
[email protected] 2
Abstract. A problem of a quantitative estimation of strain and strength characteristics of biological elastomers on an example of human skin has been considered. In particular, elastic characteristics of the skin taken from epi- and hypogastric regions of a stomach region for persons of a various sex and age have been determined. It has been established that elastic characteristics of skin essentially change within the above regions that complicates their biomechanical study by carrying out of standard tests for a static tension. Possibility of correlation of an extensibility and contractility of the skin has been analyzed. Key words: bioelastomers, skin, static tension, elasticity, heterogeneity, anisotropy.
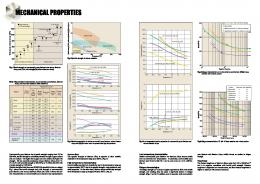
INTRODUCTION Mechanical properties of skin are the important component of its functions. Providing support and protection of internal organs, the skin keeps ability to move and be displaced [11]. From the point of view of plastic surgery, A.A. Limberg allocated 3 basic mechanical properties of skin: contraction, displacement, stretching [3]. Elasticity and hardness are used more often than others concepts in terms of biomechanics for characterization of skin as extremely functional biomaterial. In most cases of clinical practice, the estimation of the specified parametres has qualitative and subjective character. Tool methods are necessary for quantitative determination of strain characteristics of skin. In particular, tests for a static tension which serve some kind of its «functional biopsy» [7] are widely used. Static tests on uniaxial tension allow one to receive dependence of stress on strain «σ–ε» [1, 3, 4, 14, 15] which typical kind is shown in Fig. 1. At skin stretching on a curve «σ–ε», there is the initial stage I when small loading causes a considerable stretching at small stress in the sample. There is a biotissue toughening in stage II, and strain is accompanied by faster growth of stress in the final stage III. It should be noted that if for the stage I elastic strain is characteristic, stages II and III the expressed viscoelastic properties of skin [9] are shown. Such strain behaviour is explained by the orientation and straightening of collagen fibres at a stretching, as is shown in Fig. 1. The majority of researchers consider that a leading role defining mechanical properties of skin plays derma saturated by collagen. Separate biomechanical testing of full-thickness © Kurek M.F., Shilko S.V., Anichkin V.V., Anfinogenov S.B., 2009 Maria F. Kurek, Assistant, Department of Surgery, Gomel Sergey V. Shilko, Head of Laboratory of Mechanics of Adaptive Materials and Biomechanics, Gomel Vladimir V. Anichkin, Vice-Rector in Medical Work, Gomel Sergey Anfinogenov, Senior staff scientist, Lab of Mechanics of Adaptive Materials and Biomechanics, Gomel
Stress
Mechanical and frictional properties of bioelastomers. Part 2
Strain I
II
III
Fig. 1. Characteristic «stress-strain» dependence at skin tension
skin and dermal collagen yield practically identical results [9]. Breaking strength and Young’s modulus in the separate collagen fibres allocated from different tissues differs insignificantly. While many publications are devoted to studying of process of stretching, the properties of contraction of skin are studied insufficiently. Even less research is devoted to question of correlation of stretching and contraction. It is known that biomechanical properties of skin depend on set of internal and external factors and differ even within one organism depending on anatomic region [8, 12, 17]. It is represented that change of strain characteristics of skin even within regions of extended anatomic area takes place, however this question also has received insufficient elucidation in the literature. Revealing of distinctions of biomechanical properties of skin of various regions of one anatomic area on an example of epigastric region and hypogastric region was the aim of the present study. MATERIALS AND METHODS Strain properties were investigated at tension of samples of skin from epi- and hypogastric regions of 30 persons from 23 till 87 years old, from them there were 10 women and 20 men. In the test of contraction for skin of epigastric and hypogastric regions, the samples in the form of skin flap (strips of 80х15 mm) marked by a marker were oriented over length in cranio-caudal direction. Skin was dissected by a scalpel (blade of No. 23) along the marked lines to a hypodermic layer, then skin was separated from the hypoderma. Samples of skin were located in a physiological solution, then tests for static tension in accordance with GOST 11262-80 were conducted by mechanical test machine Instron 5567. The authors analyzed characteristic phases of the received diagrammes «stress–strain», including the moment of the maximum strain preceding failure of flap. Points of transition of phases I, II, and III were determined visually under the diagram, in doubtful cases in addition the calculated factor of growth of stress (rate of growth) – the relative size characterising intensity of change of an indicator for a certain time interval was applied:
ISSN 1812-5123. Russian Journal of Biomechanics, 2009, Vol. 13, No. 4 (46): 62–73
63
M.F. Kurek, S.V. Shilko, V.V. Anichkin, S.B. Anfinogenov
Ai = xi / xi −1 ,
(1)
where Ai is factor of growth of stress at the moment of time i, xi is stress at this moment (MPa), xi-1 is stress at the previous moment of time (MPa). The estimation of normal distribution was determined by means of Shapiro–Wilka criterion. It is possible to consider distribution approximately normal that speaks about influence of set of factors on the phenomena under study. The comparative analysis between groups was conducted with use of nonparametric criteria (Wilkinson test of coincident pairs for the connected groups, Man–Yitni criterion for unconnected groups, Spirmen factor of correlation). A difference of indicators was considered statistically reliable at p ≤ 0.05. As average values, the medians are presented in the text. Statistical data processing was conducted with use of package of applied programs STATISTICA 6.0. RESULTS At skin stretching on a curve «stress-strain», the stage of small strain (stage I) is revealed which depends on thin elastin network. The contribution of the bent collagen fibres at the specified stage of strain can be neglected [9]. Hence, the stage I describes a functional condition of elastin fibres. The tension inherent in skin is shown in contraction of edges of a wound after making an incision and causes some contraction of the sizes of flap after incision and separation of flap from subject tissues. Noted property is caused by network presence of elastin fibres [9, 10]. Proceeding from it, the authors make the assumption that measurement of parametres of strain on stage I of curve «stress-strain» and degrees of contractility of skin flaps after making incisions and separation of skin from subcutis, should yield close results. Tests for skin contraction and stretching have been conducted with that end in view. The test for contraction The test consisted in measurement of skin flaps after making incisions and after separation of flaps from subcutis. The marking was accepted as 100% at the size 8х15 mm. Results are presented in Tables 1 and 2. The difference in contraction of fibres in length and width is caused by direction of Langer lines which first of all reflect direction of collagen fibres [5]. However in the present research, skin contraction by the area is of interest. Statistically significant difference of contraction of the area of skin samples from epi - and hypogastric regions after making incisions is not revealed. Samples after incision, released from tension caused by the next sites of skin, remained connected with underlying tissues that did not allow us to reveal their ability to contraction. To release samples completely from influence of surrounding tissues, the skin was separated from underlying fat and connective tissue intersections between adipocytes. The following results were received after measurement of the sizes of flaps. Degree of skin contraction in hypogastric region has appeared above in comparison with skin from the epigastrium, p = 0.027. Though the noted difference has no clinical value, it is important for characterization of strain behaviour of skin. Distribution in sex and age in the investigated groups is presented in Tables 3 and 4. The length of samples in epigastrium after making of incisions at men has appeared 91.9%, at women – 100% (median), p = 0.02. Statistically significant difference of other indicators, including the area, is not revealed.
64
ISSN 1812-5123. Russian Journal of Biomechanics, 2009, Vol. 13, No. 4 (46): 62–73
Mechanical and frictional properties of bioelastomers. Part 2
Table 1
Parameters
Average
Median
Minimum
Maximum
Bottom quartile
Top quartile
Interquartile interval
Results of test of skin contraction of epi - and hypogastric regions
Length of samples in epigastrium after making incisions, %
93.7
93.8
83.8
112.5
87.5
97.5
10.0
Width of samples in epigastrium after making incisions, %
77.1
73.3
53.3
93.3
73.3
80.0
6.7
The area of samples in epigastrium after making incisions, %
72.3
71.3
50.0
88.8
65.1
80.0
14.9
Length of samples in hypogastrium after making incisions, %
95.5
94.4
87.5
112.5
92.5
98.8
6.3
Width of samples in hypogastrium after making incisions, %
74.2
73.3
60.0
86.7
73.3
80.0
6.7
The area of samples in hypogastrium after making incisions, %
70.9
71.5
55.5
82.5
66.0
75.2
9.2
Length of samples in epigastrium after subcutis separation, %
97.1
94.4
75.0
125.0
90.0
106.3
16.3
Width of samples in epigastrium after subcutis separation, %
68.8
66.7
60.0
80.0
66.7
73.3
6.7
The area of samples in epigastrium after subcutis separation, %
66.6
66.0
54.0
83.3
60.0
70.8
10.8
Length of samples in hypogastrium after subcutis separation, %
95.8
95.6
81.3
112.5
90.0
102.5
12.5
Width of samples in hypogastrium after subcutis separation, %
67.2
66.7
53.3
73.3
63.3
73.3
10.0
The area of samples in hypogastrium after subcutis separation, %
64.4
64.3
52.0
78.8
57.0
70.0
13.0
The overwhelming majority of indicators except for width of samples after separation of skin from the subcutis correlates with the ages. It is seen from Table 4 the increase of the area of skin after contraction with age that testifies the decrease of contractile ability. Results of test for stretching are presented in Tables 5, 6. Average strain in the end of the stage I of «stress–tension» curve was 12.6% in epigastric and 9.8% in hypogastric regions. Average stress of skin in epigastrium in the end of the first stage was 0.225 MPa, in hypogastrium – 0.199 MPa, Young’s module was 0.0188 and 0.0149 MPa accordingly. Statistically significant difference of studied parametres is not revealed. In 15 cases in the end of the first stage, skin strain of epigastric regions has appeared more than strain in hypogastric regions, in 15 cases – on the contrary.
ISSN 1812-5123. Russian Journal of Biomechanics, 2009, Vol. 13, No. 4 (46): 62–73
65
M.F. Kurek, S.V. Shilko, V.V. Anichkin, S.B. Anfinogenov
Table 2
Median
Average
Difference of medians
Difference of averages
Wilkinson criterion
Z-value
Statistic significance
Length of samples after making incisions, % Width of samples after making incisions, % The area of samples after making incisions, % Length of samples after subcutis separation, % Width of samples after subcutis separation, % Area of samples after subcutis separation, %
Average
Parameters
Median
Comparison of results of the test of skin contraction of epi- and hypogastric regions Hypogastric Epigastric region region
93.8
93.7
94.4
95.5
0.6
1.83
74.5
2.16
0.031
73.33
77.1
73.33
74.2
0
2.89
20.5
2.24
0.025
71.29
72.3
71.5
70.9
0.21
1.35
116.5
1.24
0.216
94.4
97.1
95.6
95.8
1.25
1.38
103.5
1.33
0.184
66.7
68.8
66.7
67.2
38.7
1.56
28
1.54
0.124
66
64.4
64.3
64.3
1.67
0.07
88.5
2.21
0.027 Table 3
66
Statistic significance
Fine probability
Length of samples in epigastrium after making incisions, % Width of samples in epigastrium after making incisions, % The area of samples in epigastrium after making incisions, % Length of samples in hypogastrium after making incisions, % Width of samples in hypogastrium after making incisions, % The area of samples in hypogastrium after making incisions, % Length of samples in epigastrium after subcutis separation, % Width of samples in epigastrium after subcutis separation, % The area of samples in epigastrium after subcutis separation, % Length of samples in hypogastrium after subcutis separation, % Width of samples in hypogastrium after subcutis separation, % The area of samples in hypogastriyum after subcutis separation, %
Z-value
Parameters
Man–Yitni criterion
Comparison of results of the test of skin contraction on sex (Man–Yitni criterion)
47.5
–2.3
0.02
0.02
99
–0.044
0.96
0.98
76
–.056
0.29
0.3
63.5
–1.60
0.11
0.1
82
0.79
0.43
0.45
89
–0.48
0.63
0.65
67
–1.45
0.15
0.16
85
–0.66
0.5
0.53
64.5
–1.56
0.12
0.12
75.5
–1.08
0.28
0.29
58.5
–083
0.068
0.07
55.5
–1.96
0.05
0.05
ISSN 1812-5123. Russian Journal of Biomechanics, 2009, Vol. 13, No. 4 (46): 62–73
Mechanical and frictional properties of bioelastomers. Part 2
Table 4
Statistic significance
Correlation of age and length of samples in epigastrium after making incisions, % Correlation of age and width of samples in epigastrium after making incisions, % Correlation of age and area of samples in epigastrium after making incisions, % Correlation of age and length of samples in hypogastrium after making incisions, % Correlation of age and width of samples in hypogastrium after making incisions, % Correlation of age and area of samples in hypogastrium after making incisions, % Correlation of age and length of samples in epigastrium after subcutis separation, % Correlation of age and width of samples in epigastrium after subcutis separation, % Correlation of age and area of samples in epigastrium after subcutis separation, % Correlation of age and length of samples in hypogastrium after subcutis separation, % Correlation of age and width of samples in hypogastrium after subcutis separation, % Correlation of age and area of samples in hypogastrium after subcutis separation, %
Distribution with number of degrees of freedom (N–2)
Parameters
Spirmen rank coefficient of correlation
Correlation analysis of age and skin contraction parameters
0.54
3.39
0.002
0.40
2.32
0.028
0.57
3.63
0.001
0.70
5.12
0.00002
0.38
2.15
0.040
0.64
4.35
0.0002
0.56
3.58
0.001
–0.17
–0.89
0.379
0.38
2.17
0.038
0.64
4.43
0.0001
0.25
1.39
0.176
0.62
4.21
0.0002
Distribution of strains in the end of the first stage on sex and age has appeared identical in both groups, Table 7. The difference in age statistically is not significant, p = 0.41 (Man–Yitni criterion). Thus, it is not revealed statistically significant differences of skin elasticity for epiand hypogastric regions caused by straightening only elastin fibres. The stage II of a curve «stress-strain» reflects process of straightening of casually located collagen fibres which start to be ordered in direction of action of force. Average strain in the end of the second stage in samples of skin from epigastric area has appeared 22% skin from samples hypogastric area, p = 0.041. In the end of the second stage, the average stress of skin in epigastrium also above stress of skin in hypogastric region on 17%, p = 0,0017. Average ultimate strain of skin in epigastric region above skin strain in hypogastric region by 12%, p = 0.02.
ISSN 1812-5123. Russian Journal of Biomechanics, 2009, Vol. 13, No. 4 (46): 62–73
67
M.F. Kurek, S.V. Shilko, V.V. Anichkin, S.B. Anfinogenov
Table 5
Strain parameters
Average
Median
Minimum
Maximum
Bottom кquartile
Top кquartile
Interquartile interval
Results of the test for skin stretching in epi - and hypogastric regions
Stress of skin in epigastric region in the end of phase I, MPa
0.2
0.2
0.0
0.7
0.1
0.3
0.2
Strain of skin in epigastric region in the end of phase I, %
14.1
12.6
2.7
55.6
6.9
17.3
10.4
Stress of skin in epigastric region in the end of phase II, MPa
1.7
1.5
0.6
3.8
1.0
2.2
1.2
Strain of skin in epigastric region in the end of phase II, %
30.7
28.2
9.6
83.3
20.3
39.7
19.4
Strength of skin in epigastric region, MPa
19.6
18.9
9.6
38.1
12.9
25.0
12.1
Ultimate strain of skin in epigastric region, %
118.6
111.1
65.2
201.9
82.2
138.9
56.7
Stress of skin in hypogastric region in the end of phase I, MPa
0.2
0.2
0.0
0.9
0.1
0.3
0.2
Strain of skin in hypogastric region in the end of phase I, %
12.9
9.8
3.8
48.6
6.9
14.7
7.8
Stress of skin in hypogastric region in the end of phase II, MPa
1.3
1.3
0.4
3.1
0.9
1.5
0.6
Strain of skin in hypogastric region in the end of phase II, %
25.3
22.0
8.7
62.5
17.7
28.7
10.9
Strength of skin in hypogastric region, MPa
13.3
12.5
5.6
26.1
9.0
16.7
7.7
Ultimate strain of skin in hypogastric region, %
101.7
98.4
50.8
176.7
83.3
123.8
40.5
Young’s modulus in the end of phase I in epigastric region, MPa
0.026
0.019
0.001
0.097
0.008
0.038
0.031
Young’s modulus in the end of phase I in hypogastric region, MPa
0.026
0.015
0.001
0.102
0.011
0.033
0.022
Young’s modulus in the end of phase II in epigastric region, MPa
0.066
0.058
0.019
0.150
0.032
0.089
0.057
Young’s modulus in the end of phase II in hypogastric region, MPa
0.059
0.050
0.015
0.138
0.040
0.073
0.033
Young’s modulus at the moment of the maximum stress of flaps of skin from epigastric region, MPa
0.182
0.151
0.091
0.446
0.111
0.242
0.131
Young’s modulus at the moment of the maximum stress of flaps of skin from hypogastric region, MPa
0.143
0.127
0.059
0.512
0.098
0.153
0.055
68
ISSN 1812-5123. Russian Journal of Biomechanics, 2009, Vol. 13, No. 4 (46): 62–73
Mechanical and frictional properties of bioelastomers. Part 2
Table 6
Strain parameters
Epigastric region, Median
Hypogastric region, Median
Difference of medians
Statistic significance
Results of the test of skin stretching in epi- and hypogastric regions
Strain in the end of phase I, %
12.6
9.8
22 %
0.42
Stress in the end of phase I, MPa
0.225
0.199
12 %
0.91
Young’s modulus in the end of phase I, MPa
0.0188
0.0149
21 %
0.67
Strain in the end of phase II, %
28.2
22.0
22 %
0.041
Stress in the end of phase II, MPa
1.54
1.28
17 %
0.0017
Young’s modulus in the end of phase II, MPa
0.0579
0.0498
14 %
0.23
Ultimate strain, %
111
98
12 %
0.02
Limit stress, MPa
18.9
12.5
34 %
0.00001
Young’s modulus at the moment of the maximum stress, MPa
0.151
0.127
16 %
0.002
Table 7 Distribution over sex and age in groups with opposite indicators of skin elasticity for epi- and hypogastric regions Strain of skin in epigastric Strain of skin in hypogastric region more than those region more than those Characteristic in hypogastric region in epigastric region Sex Age, years
M
10
10
F
5
5
Average
58.1
53.2
Median
58
52
The analysis of limit of elasticity of investigated samples has shown that the skin in epigastric region on the average maintains more high stress, than skin in hypogastric region by 34%, p = 0,00001. Young’s modulus at the moment of the maximum stress of skin in area of epigastrium has appeared more than in hypogastric region by 16%, p = 0.002. Data of results of the correlation analysis in sex and age are presented in Tables 8 and 9. Negative correlation of age and indicators of ultimate strain of skin in epigastric (p = 0.01) and hypogastric (p = 0.008) regions takes place. It is necessary to notice that in physiological conditions the skin of the stomach does not exhibit similar loading.
ISSN 1812-5123. Russian Journal of Biomechanics, 2009, Vol. 13, No. 4 (46): 62–73
69
M.F. Kurek, S.V. Shilko, V.V. Anichkin, S.B. Anfinogenov
Table 8
Strain parameters
Man–Yitni criterion
Z-value
Statistic significance
Fine probability
Comparison of results of the test for skin stretching over sex (Man–Yitni criterion)
Stress of skin in epigastric region in the end of phase I, MPa
92
–0.35
0.72
0.75
Strain of skin in epigastric region in the end of I phase, %
94
0.26
0.79
0.81
Stress of skin in epigastric region in the end of phase II, MPa
93
–0.31
0.76
0.78
Strain of skin in epigastric region in the end of phase II, %
94
0.26
0.79
0.81
Strength of skin in epigastric region, MPa
91
0.40
0.69
0.71
Ultimate strain of skin in epigastric region, %
98
0.09
0.93
0.95
95
–0.22
0.83
0.85
88
–0.53
0.60
0.62
78
–0.97
0.33
0.35
96.5
–0.15
0.88
0.88
Strength of skin in hypogastric region, MPa
77
1.01
0.31
0.33
Ultimate strain of skin in hypogastric region, %
93
0.31
0.76
0.78
93
–0.31
0.76
0.78
94
–0.26
0.79
0.81
100
0.00
1.00
1.02
94
–0.26
0.79
0.81
89
0.48
0.63
0.65
69
1.36
0.17
0.18
Stress of skin in hypogastric region in the end of phase I, MPa Strain of skin in hypogastric region in the end of phase I, % Stress of skin in hypogastric region in the end of phase II, MPa Strain of skin in hypogastric region in the end of phase II, %
Young’s modulus in the end of phase I in epigastric region, MPa Young’s modulus in the end of phase I in hypogastric region, MPa Young’s modulus in the end of phase II in epigastric region, MPa Young’s modulus in the end of II phase in hypogastric region, MPa Young’s modulus at the moment of the maximum stress of flaps of skin from epigastric region, MPa Young’s modulus at the moment of the maximum stress of flaps of skin from hypogastric region, MPa
70
ISSN 1812-5123. Russian Journal of Biomechanics, 2009, Vol. 13, No. 4 (46): 62–73
Mechanical and frictional properties of bioelastomers. Part 2
Table 9
Strain parametres
Spirmen rank coefficient of correlation
Distribution with number of degrees of freedom (N–2)
Statistic significance
Correlation analysis of test results for skin stretching and age
Age and strain of skin in epigastric region in the end of phase I, %
0.09
0.48
0.634
Age and stress of skin in epigastric region in the end of phase II, MPa
0.22
1.19
0.245
Age and strain of skin in epigastric region in the end of phase II, %
0.05
0.29
0.773
Age and strength of skin in epigastric region, MPa
–0.01
–0.06
0.956
Age and ultimate strain of skin in epigastric region, %
–0.46
–2.71
0.011
Age and stress of skin in hypogastric region in the end of phase I, MPa
–0.23
–1.28
0.211
Age and strain of skin in hypogastric region in the end of phase I, %
0.13
0.72
0.479
Age and stress of skin in hypogastric region in the end of phase II, MPa
0.26
1.40
0.171
Age and strain of skin in hypogastric region in the end of phase II, %
0.09
0.48
0.636
Age and strength of skin in hypogastric region, MPa
–0.07
–0.39
0.701
Age and ultimate strain of skin in hypogastric region, %
–0.48
–2.87
0.008
Age and Young’s modulus in the end of phase I in epigastric region, MPa Age and Young’s modulus in the end of phase I in hypogastric region, MPa Age and Young’s modulus in the end of phase II in epigastric region, MPa Age and Young’s modulus in the end of phase II in hypogastric region, MPa Age and Young’s modulus at the maximum stress of flaps of a skin from epigastric region, MPa Age and Young’s modulus at the maximum stress of flaps of skin from hypogastric region, MPa
–0.03
–0.17
0.866
–0.25
–1.34
0.190
0.12
0.63
0.536
0.05
0.25
0.802
0.31
1.70
0.100
0.16
0.87
0.390
DISCUSSION Results of the given research show that the skin is characterised by elastic contraction mainly in direction parallel to orientation of collagen fibres. So, contraction of skin samples after making incisions and separation from subcutis has on average 5–6% in length and 25% in width or 29–30% in area. These data mismatch quite the Limberg data: free excised flap of skin in all thickness (unlike a thin flap free excited in hypogastric region), and also flaps of skin with hypodermic cellular tissue on one or two feeding legs are reduced not less than on one third of linear sizes in width and length [2]. The received results also differ from data [16], according to which the skin samples in the size of 1 sq. inch were reduced on the average by 9% in direction of Langer lines and by 5% perpendicularly to Langer lines. Apparently, it is connected with the form of flaps and demands the further studying.
ISSN 1812-5123. Russian Journal of Biomechanics, 2009, Vol. 13, No. 4 (46): 62–73
71
M.F. Kurek, S.V. Shilko, V.V. Anichkin, S.B. Anfinogenov
The considerable variation of elastic properties of skin within regions of anatomic areas in the presence of anisotropy is established and the expressed viscoelastic properties were noted, in particular, in [8]. It causes complexity of modelling [13] and necessity of carrying out the further researches in this direction. For scanning extended anatomic regions in vivo, the method of dynamic contact diagnostics of viscoelastic properties of the materials earlier used by authors for biomechanical research of muscles [6] is represented as effective one. Lengthening of the sample of skin in the end of phase I of curve «stretching-strain» was in experiment on the average 13–14%, i.e., about 106% from length of a marking. However in process of stretching of the sample on length owing to contraction of its width in the end of experience of stretching, the area of the sample was practically equal to the initial. According to [10], the skin physiologically exhibits small loading and the basic loaded component is skin elastin; thus, the stress relaxation does not occur. For specification of a question, whether the natural tension of skin only elastin fibres, or elastin and collagen in a complex is provided, it is necessary carrying out experiences on biaxial stretching of skin samples. Negative correlation between the area of samples in hypogastrium after making incisions and ultimate strain of skin in hypogastric regions (Spirmen factor R – 0.38, p = 0.04) is revealed, i.e., the skin was better reduced, the less it was stretched. CONCLUSIONS 1. Biomechanical properties of skin differ not only within a body, but also in borders of one anatomic region, in the present research – epi- and hypogastric regions of the stomach surface. 2. With the years, ability of skin to contraction of the area and in length decreases, and also ultimate ultumate strain decreases. 3. Skin contraction is found to be more in direction of Langer lines, than perpendicularly to them. Contraction degree depends, apparently, on the form and the size of skin flap that demands additional research. 4. Correlation between indicators of tests of contractility and extensibility in the field of elastic strain is not revealed, that does actual experiment carrying out on biaxial loading of skin samples. 5. The presented results confirm that the human skin represents a non-uniform material with the expressed anisotropic viscoelastic properties. For obtaining distribution of viscoelastic characteristics within studied anatomic regions, authors plan to carry out the dynamic contact diagnostics of the integument.
REFERENCES 1. 2. 3. 4. 5.
72
Бегун, П.И. Моделирование в биомеханике / П.И. Бегун, П.Н. Афонин. – М.: Высшая школа, 2004. – 390 с. (in Russian). Лимберг, А.А. Планирование местнопластических операций / А.А. Лимберг. – Л.: Медгиз, 1963. – 590 с. (in Russian). Пейпл, А.Д. Пластическая и реконструктивная хирургия лица / А.Д. Пейпл. – М.: Бином, 2007. – 951 с. (in Russian). Сомкин, П.Б. Обзор аппаратных методов исследования кожного покрова тела человека и его механических свойств / П.Б. Сомкин // Вестник СевКавГТУ, серия «Естественно-научная». – 2003. – Вып. 6. – С. 214–225 (in Russian). Шилько, С.В. Механика адаптивных композитов и биоматериалов / С.В. Шилько, Ю.М. Плескачевский // Материалы, технологии, инструмент. – 2003. – № 4. – C. 5–16 (in Russian).
ISSN 1812-5123. Russian Journal of Biomechanics, 2009, Vol. 13, No. 4 (46): 62–73
Mechanical and frictional properties of bioelastomers. Part 2
6. 7. 8. 9. 10. 11. 12. 13. 14. 15. 16. 17.
Anfinogenov S.B. Mechanical and frictional properties of bioelastomers. Part 1: Description of human skin relaxation under tension / S.B. Anfinogenov, M.F. Kurek, S.V. Shilko, D.A. Chernous // Russian Journal of Biomechanics. – 2008.– Vol. 12, No. 3. – P. 42–48. Belkoff, S.M. Effects of subcutaneous expansion on the mechanical properties of porcine skin / S.M. Belkoff // J. of Surgical Research. – 1995. – Vol. 58, No. 2. – P. 117–123. Fedorov, A.E. On mechanical properties of human skin / A.E. Fedorov, V.A.Samarsev, N.A. Kirillova // Russian Journal of Biomechanics. – 2006.– Vol. 10, No. 2. – P. 28–40. Hendriks, F.M. Mechanical behaviour of human skin in vivo: a literature review / F.M. Hendriks // www.extra.research.philips.com/publ/rep/nl–ur/NL–UR2001–820.pdf, 2001. Lim, K.H. Non-invasive prediction of skin flap shrinkage: a new concept based on animal experimental evidence / K.H. Lim // Journal of Biomechanics. – 2008. – Vol. 41, No. 8. – P. 1668–1674. Lokshin, O. Viscoelasticity and preconditioning of the skin under uni-axial stretch: morphologically-based analysis / O. Lokshin, N. Liron, L. Lanir // Journal of Biomechanics. – 2006. – Vol. 39 (S1). – S. 394. Malm, M. In vivo skin elasticity of 22 anatomical sites. The vertical gradient of skin extensibility and implications in gravitational aging / M. Malm, M. Samman, J. Serup // Skin Research and Technology. – 1995. – Vol. 1, No. 2. – P. 61– 67. Mukherjee, S. Finite element crash simulations of the human body: passive and active muscle modelling / S. Mukherjee // Sadhana. – 2007. – Vol. 32, No. 4. – P. 409–426. Munoz, M.J. An experimental study of the mouse skin behaviour: damage and inelastic aspects / M.J. Munoz // Journal of Biomechanics. – 2008. – Vol. 41, No. 1. – P. 93–99. Pamplona, D.C. Numerical and experimental analysis of the human scalp under expansion / D.C. Pamplona, C.R. Carvalho, H. Radwansk // Proceedings of the 5th World Congress of Biomechanics, Munich, July 29th–August 4th, 2006. – S. 393. Ridge, M.D. The directional effects of skin / M.D. Ridge, V. Wright // Journal of Investigative Dermatology. – 1966. – Vol. 46, No. 4. – P. 341–346. Sasik, C. Characterization of skin morphology and mechanical properties: variations across anatomical sites / C. Sasik // J. of the American Academy of Dermatology. – 2008. – Vol. 58, No. 2. – P. 28.
МЕХАНИЧЕСКИЕ И ФРИКЦИОННЫЕ СВОЙСТВА БИОЭЛАСТОМЕРОВ. ЧАСТЬ 2: РАЗЛИЧИЯ ДЕФОРМАЦИОННЫХ ХАРАКТЕРИСТИК КОЖИ В ПРЕДЕЛАХ ЭПИ- И ГИПОГАСТРАЛЬНОЙ АНАТОМИЧЕСКИХ ОБЛАСТЕЙ М.Ф. Курек, С.В. Шилько, В.В. Аничкин, С.Б. Анфиногенов (Гомель, Беларусь)
Рассмотрена проблема количественной оценки деформационно-прочностных характеристик эластомеров биологического происхождения на примере кожи человека. В частности, определены упругие характеристики кожи, взятой из эпи- и гипогастральной зон области живота для лиц различного пола и возраста. Установлено, что в пределах названных зон упругие характеристики кожи существенно изменяются, что затрудняет их биомеханическое исследование путем проведения стандартных испытаний на статическое растяжение. Анализируется возможность установления корреляции растяжимости и сократимости кожи. Ключевые слова: биоэластомеры, гетерогенность, анизотропия.
кожа,
статическое
растяжение,
упругость,
Received 20 October 2009
ISSN 1812-5123. Russian Journal of Biomechanics, 2009, Vol. 13, No. 4 (46): 62–73 View publication stats
73