loading endurance for the module makers or system installers in the design and planning stage which need ... The solar energy industry is saturated by various.
29th European Photovoltaic Solar Energy Conference and Exhibition
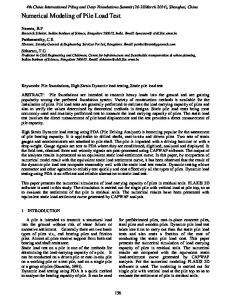
MECHANICAL LOAD TEST STUDY FOR OPTIMIZE PV MODULE INSTALLATION METHOD
Jeff Chen, Haomin Chen, CH Hsueh and MaoYi Chang AU Optronics Corporation(Benq Solar) / Reliability Test and Analysis Laboratory No.1 JhongKe Rd, Central Tai wan Science Park Taichung 40963, Taiwan, R.O.C
ABSTRACT: This study focuses on when the PV module is performed the mechanical load test, and using the different mounting mode to research the deformation degree of the P-mono PV module and the monitoring continuity. The probability of PV module damaging by extend weight decreases when a best installation is chosen. The output power and electroluminescence images are applied for investigation in this work, and the important parameters which influence the power loss of PV module are also discussed. We provide the best mounting method for the mechanical loading endurance for the module makers or system installers in the design and planning stage which need to take into account. Keywords: Mechanical Load, Mounting, Monitored Continuity.
1
INTRODUCTION
The solar energy industry is saturated by various marketing promotion and vendors in the near future. Every component suppliers must improve the process or design in order to meet the market requirements. Likewise, the solar cell manufacturers were in order to solve the silicon material shortage and seek to lower the cost. Therefore, the thickness of the solar cells was significantly thinner. Accompanied risk of thinner cell for the PV modules withstood external weight (ex. wind pressure, snow load and etc.). It increases the chance of module damage. The PV module vendors continue to expand, but no any standard could define the best installation for the system suppliers. The most manufacturers of PV module were focused on the refining the mechanical load test result by the aluminum frame design or component material improvement, but most of them ignore the installation method. When the PV module has been performed mechanical load test, the test report only showed the power decay. Generally, the manufacturers of PV module do not check the EL Image and test method in detail. This article describes how to go one step further to analyze the mechanical load test (MLT) results [1, 2, 3, 4, 5]. Different detail test conditions are compared during mechanical load test. Both cushion and cardboard buffer layer between loading dummy bells and module are compared. The difference between with and without monitoring continuity is studied. Then various mounting methods are also investigated for simulating real PV system. Including long side, short side back rail mounting and clamping type mounting are verified in our experiments.
2
Figure 1: Mechanical load test at AU Optronics Corporation. The modules used in the following test sequences are commercially available of 1639mm x 983mm in size and consist of 60 single-crystalline cells of 6 inch (155 mm) in size and are equipped with three bus bars. All tests have been performed at AU Optronics Corporation according to the test plan as given in Table I. In this study, the mechanical load test uses various mounting methods and performs with the monitoring continuity. The test procedures are according to the existing standard IEC61215 10.16, i.e. total of three cycles. The front surface of PV module during the last cycle is increased from 2400Pa to 5400Pa for 1hr.
Table I: The test plan for P-mono module Installation Long side mounting by rail
EXPERIMANT
The module tests described in this study have been carried at the mechanical load test set-up of AUO with 10kg dumbbells, as shown in Fig.1. The load and cycle times can be carried by manpower. We use the weight loading to represent the by the real external weight of PV module in the outdoor.
Short side mounting by rail
Long side clamping
3157
Test method Cushion Cardboard Cushion Cardboard Cushion Cardboard
Monitored continuity Yes No Yes No Yes No Yes No Yes No Yes No
29th European Photovoltaic Solar Energy Conference and Exhibition
Before and after each test of Table I, Maximum power determination (10.2) has been measured, also insulation (10.3), wet leakage current test(10.5) and electroluminescence has been carried out. The electroluminescence(EL) analysis is a useful tool to detect micro cracks and other defects in PV modules[1]. Besides, the deformation degree of PV module has been measured during the mechanical load test. The test method for cushion is to put the cushion between the dumbbells and PV module, but for cardboard is to put the cardboard, as shown in Fig.2 and 3, respectively. No matter what kind of the test method, it conforms to the procedures for IEC 61215 standard.
3
RESULT
Loading from the front surface of PV module during the last cycle of mechanical load test by 5400Pa causes the significant cracks and the output power degradation of the PV module. Therefore, we must study the variety of conditions to improve the test method, when the PV module tests by 5400Pa. As shown in Fig.5, during first and second test cycle, the power degradation is less than 1.2%, and the most output power degradation situation occurs in the third test cycle of 5400Pa front side loading.
Figure 2: Cushion method.
Figure 5: The power decay of mechanical load test every cycles. 3.1 Long side mounting The PV module is performed the mechanical load test by long side mounting with cushion and board test methods. The output power degradation of cardboard method is -2.9% and much less than the cushion method, as shown in Fig.6. It means that the different test method or installation plays the important character for the reliability of PV module for mechanical loading test. We infer that cardboard share the loading more uniformly than cushion does and reduce the damage.
Figure 3: Cardboard method. Both mounting rail and clamping mode are applied in the experiment. For mounting rail method, we use long side and short side back rail mounting respectively. For clamping method, we use clamp in long side installation. The mounting rails and clamping positions of the PV module are as shown in Fig4. The distance between the ground and back side of the module is also measured to investigate the three dimension deformation mapping for the PV module with laser range finder.
Figure 6: The power decay of different test method during MLT by long side mounting. The distribution of micro cracks is analyzed by electroluminescence image. The micro cracks are concentrated on both upper and bottom sides of the position by cushion method, as it can be found as shown in Fig.7. But it distribute randomly by cardboard testing method as shown in Fig.8.
Figure 4: The installed positions of PV module.
3158
29th European Photovoltaic Solar Energy Conference and Exhibition
load test with monitoring current continuity is easily to induce cell cracks. 3.2 Short side mounting The PV module mounting in short side by rail is also inspected. No matter what kind of the test methods or monitored continuity changed, and the output power degradation range is about -0.9% ~ 1.4% as shown in Fig.9.
Figure7: EL Image after MLT by cushion
Figure9: The power decay of different test method by short side mounting. Figure8: EL Image after MLT by cardboard In Fig.10, there are not the micro cracks obviously found in EL Image. The deformation degrees of PV module are measured actually. The deformation degree of mounting by short side is difference by long side. The PV module bends with weight which around all four sides by long side mounting. The PV module bends along long side, but no bend along short side obviously by short side mounting, as shown in Figure11 and 12. The PV module only bends along long side by short side mounting, so no matter whether monitoring continuity, the micro cracks do not take place.
We believe that the deformation degree of PV module and mounting mode cause the changes of the position of micro cracks, so the changing of installation can decrease the occurrence of micro cracks. When the PV modules are covered by heavy snow, the PV modules don’t output power. Therefore, we observe the P-mono PV module to perform the mechanical load test without monitored current continuously. Table II shows no matter what kind of the test methods, and the output power degradation of monitoring current continuity obviously increases about 1% more for P-mono module after the mechanical load test.
Table II: The relationship between the power decay and the crack by different test Item. Item
MLT
Crack Estimation
Cushion without monitored continuity
-3.8%
14
3.65% (14/18)
Cushion with monitored continuity
-4.7%
18
4.70% (18/18)
Board without monitored continuity
-2%
7
1.80% (7/18)
Board with monitored continuity
-2.9%
11
2.87% (11/18)
Figure10: EL Image after MLT by short side mounting.
The output power degradation is higher for monitored current continuity P-mono module during the mechanical loading test. From the analysis by calculating cracking-cell numbers, we find the number of crack is proportional to the output power degradation. It means that the P-mono PV modules performed the mechanical
3159
29th European Photovoltaic Solar Energy Conference and Exhibition
Figure14: EL Image after MLT by board Figure11: The deformation degree of PV module by short side mounting.
The output power degradation of with and without monitored continuously is a gap of -1%, and the different test methods are a gap of -1.8% for P-mono module, as shown in Fig15. The results are the same as long side mounting.
Figure12: The deformation degree of PV module by long side mounting.
3.3 long side clamping The PV modules are clamped by long side, and no mounting rails under the PV module. It still can find the some micro cracks are concentrated on both upper and lower sides of the position in cushion method after mechanical load testing as shown in Fig.13. If the test method changed form cushion to cardboard, the number of micro crack are decreased obviously as shown in Fig14.
Figure15: The power decay of different test method during MLT by long side clamping.
3.4 The study of deformation degree The degree of deformation is compared between with long side mounting and with long side clamping. In Fig16 and Table III, the degree of 3th position and 5th position for cushion method by long side clamping and mounting are less than cardboard method by long side clamping. Smaller angle value infers severe bending and cracking for cells. When the PV modules are carried the external weight, the micro cracks are not only responsible for the strength of PV module, but also the method of installation. The long side mounting by rail causes the micro cracks concentrated on both sides of the position. When the rail is removed and changed the clamping, the micro cracks are also concentrated on both sides of the position are still existed. It means the design of PV module on both sides of the position is the most weak. It is the most important to avoid the situation of large cell deformation.
Figure13: EL Image after MLT by cushion
3160
29th European Photovoltaic Solar Energy Conference and Exhibition
[2] Robin Czyzewicz and Stephen Bennison, “Solar Module Mechanical Measurement and Mechanical Modeling Technique for Rapid Parametric Design”, 39th IEEE PVSC (2013) [3] Sarah Kajari-Schröder, Iris Kunze, Ulrich Eitner and Marc Köntges, “Spatial and Directional Distribution of Cracks in Silicon PV Modules after Uniform Mechanical Loads”, 39th IEEE PVSC (2013). [4] Martin Sander et al., “Investigations on Cracks in Embedded Solar Cell after Thermal and Mechanical Loading”, 27th European Photovoltaic Solar Energy Conference and Exhibition (2012), p. 3188 – 3193. [5] M. Köntges, S. Kajari-Schröder, I. Kunze, U. Jahn, “Crack Statistic of Crystalline Silicon Photovoltaic Modules”, , 26th European Photovoltaic Solar Energy Conference and Exhibition (2011), p. 3290 – 3294.
Figure16: The deformation distance during MLT by long side
Table III: The angle of deformation during MLT by long side
Item
4
。 Angle
MLT 2
3
5
6
Cushion by clamping
-3.6%
160
147
147
161
Cushion by mounting
-4.7%
157
145
147
160
Board by clamping
-1.8%
155
155
153
157
SUMMARY
The mechanical load test result is obviously affected by testing method. Cardboard buffer layer between dumbbells and PV module shows better loading uniformity than cushion does. The output power degradation with monitoring current continuity during test as the requirement in IEC 61215 standard increases about 1% more than without one. The monitoring current continuity is easily to induce cell cracks for P-mono module. The mounting method of PV module influences the power decay in the field. Back rail mounting with crossing short side shows stronger heavy loading endurance than with crossing long side. The PV modules with different installation will cause the different degree of deformation during the mechanical load. When the mechanical load test is performed, the mounting mode must be carefully confirmed. A well considered install configuration can achieve better mechanical load performance. During the design stage, it suggests that PV module makers study and provide suitable installation guide to assure the quality and outdoor performance.
5
REFERENCE
[1] Simon Koch et al., “Dynamic Mechanical Load Tests on Crystalline Silicon Modules”, 25th European Photovoltaic Solar Energy Conference and Exhibition (2010), p.3998 – 4001.
3161