Apr 25, 1995 - Median Radial Basis Function Neural Network. Adrian G. Borg and Ioannis Pitas, Senior Member, IEEE. Abstract-Radial basis functions (RBF's) ...
IEkE TRANSACTIONS ON NEURAL NETWORKS, VOL
I, NO. 6, NOVEMBER 1996
1351
Median Radial Basis Function Neural Network Adrian G. Borg and Ioannis Pitas, Senior Member, IEEE
Abstract-Radial basis functions (RBF’s) consist of a two-layer neural network, where each hidden unit implements a kernel function. Each kernel is associated with an activation region from the input space and its output is fed to an output unit. In order to find the parameters of a neural network which embeds this structure we take into consideration two different statistical approaches. The first approach uses classical estimation in the learning stage and it is based on the learning vector quantization algorithm and its second-order statistics extension. After the presentation of this approach, we introduce the median radial basis function (MRBF) algorithm based on robust estimation of the hidden unit parameters. The proposed algorithm employs the marginal median for kernel location estimation and the median of the absolute deviations for the scale parameter estimation. A histogram-based fast implementation is provided for the MRBF algorithm. The theoretical performance of the two training algorithms is comparatively evaluated when estimating the network weights. The network is applied in pattern classificationproblems and in optical flow segmentation.
I. INTRODUCTION
F
UNCTIONAL estimation is an important problem in data analysis and pattern recognition applications. The properties of radial basis functions (RBF’s) make them suitable to be used as universal approximators [1]-[3]. A continuous function can be described as a weighted sum of kernels. A kernel decomposition is suitable to be embedded in a two-layer neural-network structure where each kernel is implemented by a hidden unit. In supervised learning, the network is provided with input-output pairs of samples drawn from an observation set and the learning algorithm finds the rules that model the given mapping. In [4], a window function was associated with each data sample. In other approaches, a distribution function is approximated by the superposition of a set of basis functions whose centers are situated on a regular grid [5].The assignment of so many functions is not practical in most of the applications and further work was devoted to representing a set of data with one function, with the closest approximation possible. In RBF networks, an activation region with respect to the data sample local densities is assigned, after the learning stage, to each hidden unit. In [6], the RBF weights are found by solving the given system of equations and considering the desired values for the training set. The adaptive implementation of this approach [7] is related with clustering techniques such as adaptive k-means clustering algorithm [S] and learning vector quantization [9]. Manuscript received September 19, 1994; revised April 25, 1995 and May 18, 1996. The authors are with the Department of Informatics, University of’ Thessaloniki, Thessaloniki, Greece. Publisher Item Identifier S 1045-9227(96)06610.6.
The RBF neural networks can be used to model the probability density functions (PDF) in nonparametric classification tasks [lo]-[ 121. The basis functions, when used as activation functions for hidden units, provide the network with the capability of forming complex separation boundaries between classes, which is equivalent to what perceptran networks can provide through an intermediate mapping. The main applications for the RBF have been so far in pattern classification where the network approximates the Bayesian classifier [12]-[14] and in system modeling [7], [lS], [16]. In both areas, RBF networks gave better results when compared to other methods. The RBF network requires less computation time for the learning [7] and a more compact topology than other neural networks [ 171. Various learning algorithms have been used in order to find the most appropriate parameters for the RBF decomposition. They can be classified in two major branches: batch learning, where the learning is done on groups of patterns [6], [13], [14], [18] and on-line learning, where the learning is adaptive, on a per pattern basis [7], [15], [16], [19]. These algorithms were employed for time series prediction [ 151, speech recognition [7], channel equalization [ 161, and image quantization [12]. The Gaussian function is usually chosen as kernel function and it will be considered in this study as well. The parameters to be estimated in this case are the center vector and the covariance matrix for each kernel as well as the weighting parameters corresponding to the output connections. The calculation of Gaussian centers [7] is similar to the leaLming vector quantization (LVQ) algorithm [9], [20] and this approach can be extended for the calculation of the covariance matrices [16], [21]. The Gaussian centers correspond to the local estimates for the first-order statistics and covariaiice matrices for the second-order statistics. However, the estirnators based on classical statistics produce bias in parameter estimation, if data are not normally distributed [22]. Robust statistics, which are extensively used in image processing algorithms 1231 are known to give good results when data are contarninated with outliers or when the distributions are long-tailed. In this paper, we introduce a learning algorithm for RBF networks based on robust estimation. The RBF network is presented in detail in Section 11. The classical approach as well as its statistical interpretation are described in Section 111-A. In Section 111-B, we introduce a novel on-line learning algorithm called median radial biasis function (MRBF). For the estimation of the RBF centers we employ the marginal median estimator [23],[24] and for the estimation of the covariance matrix, the median of the absolute deviations (MAD) algorithm [22].The median algorithm relies on the ordering of the coming data samples in a runnling window with the decision to be assigned to that pattem situated in the
1045-9227/96$05.00 0 1996 IEEE
IEEE TRANSACTIONS ON NEURAL NETWORKS, VOL. 7, NO 6, NOVEMBER 1996
1352
i
\/'
INPUT
HTDDEN LAYER
OUTPC
Fig. 1. The RBF neural-network structure
middle of the window. The number of patterns to be taken into account by the algorithm depends on how fast the distribution of the data changes in time. A fast computing algorithm based on data sample histogram analysis is derived for the MRBF in Section 111-C. This implementation is very useful in the case when data have discrete values, e.g., in image processing and computer vision applications. In Section IV, the expected stationary values are derived in the case when we estimate the parameters from a mixture of one-dimensional (1-D) Gaussian functions. We provide the theoretical bounds for mean and variance estimators in the case when we use either classical or robust estimation. In the case where estimating the parameters of each function from a mixture of distributions we investigate the parameter convergence to the stationary values. In Section V-A, both algorithms are applied in artificially generated data classification problems. In this application, the networks model the underlying probability for each class using the decomposition in RBF kernels. In order to decide the class for a new data sample, both Euclidean and Mahalanobis [8], [25] distances are used. The figures of merit are the classification error, the capability of functional approximation as well as the estimation of the optimal boundary between the classes. In Section V-B, the proposed algorithm is applied for optical flow segmentation and in Section VI we draw the conclusions of the present study.
In supervised learning, the network is provided with a training set of patterns consisting of vectors and their corresponding classes. Each pattern is considered assigned only to one class Ck, according to an unknown mapping. After an efficient learning stage, the network implements the mapping rule and generalizes it for patterns which are not from the training set. According to Bayes' theorem [25],we can express the relation among the a posteriori probabilities P(Ck1X) of different classes by using their a priori probabilities P ( C , )
where M is the number of classes and X is an N-dimensional vector denoting a pattern. Providing their capabilities of approximation [I]-131, RBF networks can be used to describe the underlying probability as a sum of components with respect to a base (denoted by the function family 4) L
(3) ,7 = 1
where L is the number of kernel functions and A h o are the weights of the hidden unit to output connection. Each hidden unit implements a Gaussian function
11. RBF NETWORKAND OPTIMAL CLASSIFICATION The RBF network has a feedforward topology which models a mapping between a set of vector entries and a set of outputs, by using an intermediate level of representation implemented by the radial basis functions. The structure of this network is represented in Fig. 1. Each network input is assigned to a vector entry (feature in a pattern recognition application) and the outputs correspond either to a set of functions to be modeled by the network or to various associated classes.
for j = 1, . . . L , where ,u3 is the mean vector and C, is the covariance matrix. Geometrically, p,j represents the center and C j the shape of the ,jth basis function. A hidden unit function can be represented as a hyper-ellipsoid in the N-dimensional space. An activation region is defined around the mean vector. If a pattern falls inside the activation region of a hidden unit, that neuron will fire. The maximum activation for the hidden unit is obtained when the sample is identical to the center.
BORS AND PITAS: MEDIAN RADIAL BASIS FUNCTION
1353
The activation region for a neuron is similar to the Voronoi neighborhood for a vector quantizer [26].Let us denote by V, the activation region of the j t h kernel with respect to a metric distance
v, = { X E ELN I IIX I*.//I qx-/Lll i = l " . > L . i # j l
where nJ is the number of data samples from the given data population 1251. In order to decide which class center will be updated, in LVQ the Euclidean distance is computed between the data sample and each center
-
>
L
(5)
If
IIX, - bJ1l2= min / I X , - fin-l12 k=l
then
X , E C, (10)
where 11 . 11 represents a distance metric, e.g., Euclidean. The separating boundary between two classes is the location of the vectors wlhich have the same a posteriori probabilities for both classes
where C j is the winner class and 11 . /I denotes the Euclidean distance. The LVQ algorithm is the adaptive version for (8), computed for patterns assigned to an activ;ition region according to (IO). In the original LVQ algorithm, used for
If we consider 1-D data, then we can express V, = [TJ,T,+1). Each output implements a weighted sum of kernels as given by (3). Classes can be coded in different ways by the outputs. For a more accurate representation of the classes we choose the number of outputs as equal to the number of classes. In this case, the class decision is assigned to the maximal activated output unit (winner take all). The sigmoidal function is used in order to limit the output values in the interval (0, 1)
b,(t + 1) = bJ(q+ V[Xt - bJQl where estimate leaming leaming [29] is
(1 1)
is the learning rate and & ( t ) is the c1:nter vector at the moment t. Various decaying rules for the rate were tested for the LVQ algorithm [28]. The rate which achieves the minimum output variance
q=-
1
(12)
727
1
y k ( x )= 1 + cxp ;-pk(x)]
(7)
for k = 1. . . . , 144, where M represents the number of outputs and p k ( X ) is8given by (3). The sign of the weights An-, shows the activation or the inhibition of the hidden unit to output connection. If the sign of the weight X k J is positive, then the activation region of the kernel j corresponds to the class k ; otherwise, it is not associated with the class k . [II. LEARNINGIN RBF NETWORKS
A. Classical Statistics Approach
A combined unsupervised-supervised learning technique has been widely used [7], 1161, [21] in order to estimate the RBF weights. This is an on-line technique which employs the LVQ algorithm [9], 1201 in order to find the input to hidden unit weights in the unsupervised part and the least mean squares [27]for finding the A k 3 weights in the supervised part. At each iteration we first update the kernel parameters and afterwards the output weights. The unsupervised part of the learning stage is based on classical statistics assumptions. In the clasical statistics approach, the estimation of the mean and of the covariance matrix for a given population of data samples is given by
where n, is the number of samples assigned to tlhe cluster j . For the covariance matrix calculation we use the extension of the LVQ algorithm for second-order statistics [ 161, [ 191
E,(t
+ 1) = ___ nJ 2Jt) n, 1 -
+ [XL
-
b J ( -+ f 1)"
-
b3(t
-a
n7 - 1
(13)
where $,(t) is the covariance matrix estimate at the moment t. We can observe that the formulas (11) and ~(13)are the adaptive versions of (8) and (9). In some applications, it is worthwhile to use lanobis distance instead of the Euclidean one for of the winner class. The Mahalanobis distance consideration the covariance matrix for each basis If
(bJ - x,,T5;'(i;.,- X , ) L
inin [(bk - X,)T %il(j& k=l
-
the Mahathe choice takes into function
=
X,)] then
X, E C,. (14)
However, at the start of the learning algorithm, an imprecision in estimating the covariance parameters may occur and this can lead to a singular covariance matrix. Thus, for the first few data samples we can use the Euclidean distance (10) and afterwards employ the Mahalanobis distance (14). The initial values for the centers j2 are randomly generated and the covariance matrices are initialized with zero.
B. Median-Based Estimation jor RBF Par-ametei:y n1
(X, - f i J T ( X- fiJ I?&,]
=
,=l
n,
-
1
(9)
In the training stage, it is desirable to avoid using outliers which may cause bias in the estimation of the FLBF network parameters. The patterns which are not consistent with data statistics (noisy patterns) should be rejected rather than used for training [30]. Robust methods are known to provide
IEEE TRANSACTIONS ON NEURAL NETWORKS, VOL. I , NO 6. NOVEMBER 1996
1354
accurate estimates when data are contaminated with outliers or have long-tailed distributions [22],1231. They are insensitive at extreme observations and this makes them attractive for parameter estimation. In marginal median LVQ algorithm 1241, [3I], the data samples are marginally ordered and the centroid is taken as the marginal median [23] j i J = med
{XO,Xz, . . . X,-1}
(15)
where X,-1 is the last pattern assigned to the j t h neuron. In order to avoid an excessive computational complexity, the median operation can be done on a finite set of data, extracted through a moving window that contains only the last W data samples assigned to the hidden unit j
{
=
med med
x1, ” ’ , X-l}
ifn X,,-I}
Mahalanobis distance. The order of RBF network weights updating is well defined: the kernel center, the covariance matrix which uses the previously estimated center and afterwards the weights corresponding to the hidden unit to output connection. The network found by means of the proposed training algorithm is called MRBF neural network. The second layer is used in order to group the clusters found in the unsupervised stage in classes. The output weights are updated as follows:
for k = 1, . . . , M and ,7 = 1. . . . L, where the learning rate is 7~ E (0; 11. Fk(X) is the desired output for the pattern vector X and it is coded as
for k = 1, . . . M . The formula (21) corresponds to the backpropagation [ 3 2 ] , [ 3 3 ] for the output weights of a RBF network with respect to the mean square error cost function ~41. The network topology represents the number of neurons on each layer. The number of inputs and outputs can be set up from the given supervised problem. For evaluating the number of hidden units we can use various approaches: where 0.6745 is the scaling parameter in order to make the growing architecture, decreasing number of hidden units, estimator Fisher consistent for the normal distribution [22]. or a combination of these two. When the performance of MAD calculation is performed along each data dimension, the network is poor, the number of hidden units should be independently. The same set of data samples can be taken increased 1141, [ 1.51, [17]. If some hidden units are not relevant into account in (17) as for the marginal median in (16). for the classification, or their activation fields are overlapping, The off-diagonal components of the covariance matrix can the network should be pruned [ 131. The relevance of the hidden be calculated based on robust statistics as well 1221. We units is calculated based on the ratio between the number of consider two arrays containing the difference and sum of each data samples contained in their activation field and the total two different components for a data sample from the moving number of data samples. The overlapping of the activation window fields can be evaluated by clustering similarity measures [SI. A
~
1
x,; h + xi, 1 Z77hl = xz; h, X ! ,1
q+i,,l
=
-
(18) (19)
for Z = n - W , . . . n - 1. First, the median of these new data populations is calculated according to (1 6). The squares of the correspondent MAD estimates (1 7) for the arrays Z& and Z i l represent their variances and they are denoted as Vjl’Lland The off-diagonal components of the covariance matrix are derived as
q:fLl.
In marginal median LVQ, both Euclidean (10) and Mahalanobis distances (14) can be used. In the case of Mahalanobis distance, a good estimation is desired for the covariance matrix in order to be appropriately used for winner class selection. By using a robust estimation of the covariance matrix as in (17)-(20) we can be confident in the evaluation of the
C. Fast Training in Median RBF Based on Data Sample Histograms When the data samples are distributed in a discrete range of values we can find solutions for a fast MRBF training
stage. A fast implementation for the median algorithm based on histogram updating, used in image filtering, was proposed in [34]. The first data sample assigned to a unit becomes the starting point in finding the median. In the updating stage we take into consideration pairs of data samples Xi and assigned to the same unit according to either ( I O ) or (14). We build up the marginal histogram associated with each activation region, denoted here as HJh [ k ] , where ,j is the hidden unit, h is the data sample entry and k represents the histogram level. We denote by j&, h(t) the center estimate at instant t , and let us assume X i , tL < Xz+l.f , . Median updating can be performed according to the rank of the incoming data
BORS AND PITAIS: MEDIAN RADIAL BASIS FUNCTION
1355
samples 0.07
!
”/\
where K is tlhe number of histogram levels necessary to add or subtract in order to obtain the new location for the median. K is evaluated on the condition that median is located where the data marginal histogram splits in two sides containing an equal number of samples
/
where 1 represents the total number of levels in the updated histogram H.,h[k].In some histograms it is not possible to obtain exact equality in the relation (24). The median is chosen such that (24) is best approximated. We implement a fast calculation of MAD (17) by using the histogram of data samples. In order to estimate the dispersion parameter we use the histograms obtained during median calculation by (23) and (24). We build new histograms denoted as HJh, MAD^^] and representing the distributions for IX,-fij 1
where k represents the histogram level. MAD represents the median of the H3h,&IAD[IC] histogram multiplied by a constant and should fulfill a similar condition as in (23) and (24). Let us denote by g J h the location where the histogram H3h, MAD[^] splits in two equal sides. MAD estimator of the distribution can be derived from the median of this histogram, taking into account the quantization error as well
Fig. 2. Overlapping Gaussian functions.
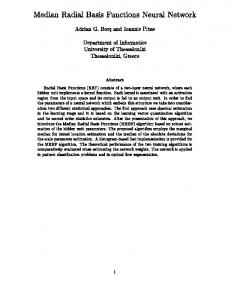
Iv. THE ESTIMATION OF THE NETWORKWIEIGHTS The marginal median estimator operates independently on each data axis. Therefore, the performance analysis can be done for the 1-D case without loss of generality. In this Section we estimate the parameters, i.e., the centers and variances of 1-D normal distribution mixtures. The proposed robust estimation techniques are compared against the classical estimators. A mixture of Gaussians is a very geineral model, used in many applications. We shall perform an asymptotic analysis of performance when we have a sufficiently large number of observations for each class. Let us take a PDF function f ( X ) equal to a mixture made up of L 1-D normal distributions N ( p 3 , 0 3 ) ,each of them with a priori probability E~
L Ej
=l.
3=1
\
where nJ is the total number of samples assigned to the j t h hidden unit and where 0.5 should be subtracted in order to compensate for the first term of the folded histogram H3h,~ ~ 0 [from 0 ] (25). The second term represents the quantization error and can be omitted if a faster implementation is desired. It can be easily seen that this term is zero for a properly balanced histogram associated with MAD estimation. For the off-diagonal components of the covariance matrix we can employ a similar approach to that used for calculating the MAD estimator (25), (26). We calculate the joint histograms of 2; and 2, based on (18) and (19) and we evaluate the median and MAD estimators similarly with (27). Afterwards, the covariance matrix components are derived as in (20).
The second equation represents the normalization relation for the a priori probabilities. We assume that each distribution in the mixture (28) corresponds to one data class. Our aim is to separate each class j by choosing appropriate thresholds TJ, Tj+l.An example of three overlapping Gaussian distributions separated by thresholds TI and T2 is provided in Fig. 2. When estimating the components of (28) we have to consider the overlapping among different distributions. Thle normalized distribution is given by
where Tj and Tj+l are the optimal boundaries of the j t h function with its neighboring functions. The expected value of the center can be obtained from
E[&] = E [ X I X E
[+j,
Fj+l)]
IEEE TRANSACTIONS ON NEURAL NETWORKS, VOL 7,NO. 6, NOVEMBER 1996
1356
-0.02
Median
0.181
0.161
6
-0.06
$a
-0.08
2
-0.1
-
-0.12-
-8 8
L
-0.14-
a -0.16a
4
-0.18-
-0 2 2 '
0
0
2
6
4
I0
8
12
14
16
1
Mean
20
40
60
80
100
120
140
160
180
I
200
No samples
(d
Fig. 3. The separation boundary between two Gaussian probability density denotes the optimal boundary, "- -" the boundary [unctions where "-'' found by using marginal median estimator, and "- ." the boundary found by using classical LVQ.
I
0.I
0.05 I
MAD
where T j and T3+l are the estimates of the separating boundaries for the j t h Gaussian kernel and f ( X ) is given by (28). In an estimation problem, the bias represents the difference between the estimated value and the optimum one [22]. It is desirable to obtain as small bias as possible. The bias of the boundary between two classes is directly related to the estimation of the class probabilities (6). If the class probabilities are well estimated, then the bias is small. If not, then the bias is large. When jlJis evaluated as in classical LVQ ( 1 I ) , the stationary estimate for the j t h Gaussian kernel center is given by
-0.25 -
Sample standard deviation
1
When employing the median estimator (15), the PDF for = 21 + 1 independent and identically distributed data is given by 1231
72
(32) where S is (33)
where F ( X ) is the cumulative distribution function for the data whose PDF is (28). If we insert (35) in (31) we obtain the expected value of the median estimator assuming n data samples. The median is located where the PDF of the given data samples splits in two equal areas [23]
f ( X )d X
, f ( X )dX
= /T'" ER
(36)
[fi, 1
and the function erf ( y ) is [25] erf (y) =
~
i'
d'z.
exp
(-;)
dt.
(34)
where E n [ & ] is the median stationary estimate of the given data. The stationary value of j t h distribution center estimate using the median estimator is obtained after inserting
BORS AND PITAS: MEDIAN RADIAL BASIS FUNCTION
1357
0.6
0.4 0.2 I
2 3 Scale parameter
1
Scale parameter (a)
4
(b)
0
-2 - -- classical - MAD -2 -2
1
2
3
4
2 3 Scale parameter
1
Scale parameter (c)
4
(d)
Fig. 5. Theoretical analysis of the bias for median and classical statistics estimators in evaluating the RBF parameters: (a) center for X ( 5 . 0 ) in the distribution (48), (b) center for N ( 5 . 0 ) in the distribution (49), (c) scale parameter for N ( 5 , 0 ) in (48), and (d) scale parameter for N ( 5 ; (7)in (49).
(28) in (36)
TABLE 1 BETWEEN MRBF AND RBF NETWORIKS IN PATTERN CLASSIFICATION AND DISTRIBUTION MODELING
COPvlPARISON
where 6 is provided in (33). In the case where we want to find the expectation for the variance estimator 6; we use a similar approach. The expected stationary estimate for 6; based on classical estimation (13) is
where f ( X ) is given by (28) and Ec[fij]is evaluated in (32). When MAD is used as dispersion estimator ( 1 7), its expected value when assigning n data samples is @+I
ER, n[e,j]=
IX - En,7L[fijllfi+l(X) dX
g--+l
f i + l ( X )d X
the expected stationary state of the MAD e s h a t o r , denoted as ER[6j] E R [ f i j ] + C E R 1831
(39)
.i,,,,-C,,,,r,
;JI_
Tl+l
f ( X )d X =
f ( X )dX
(40)
where E ~ [ f i jcan ] be calculated from (37). E . ~ [ e jcan ] be where f i + l ( X ) is given in (329, En,,,[jl,] is evaluated after inserting (351)in (31) and c = 0.6745. By taking into account the median property of splitting the data distribution into two equal areas as in (36), we obtain
derived from
2=1
IEEE TRANSACTIONS ON NEURAL NETWORKS, VOL. 7 , NO. 6, NOVEMBER 1996
1358
i
. . . . . ..:... I
-5
.
. . . ..,
t
-10 -10
. . .
.
-5
0
.
.
10
5
20
15
FEATURE I Fig. 6. Samples from Distribution I. The boundaries between classes are marked with: '-"
for optimal classifier,
"- -"
for MRBF, and
"- ."
for RBF.
= 4,~2 = 0.3. The optimal boundary (44) is compared with the boundary obtained based on the marginal median estimator and with the boundary given by classical LVQ. The bias IT1 f ' l I provided by the robust estimator is smaller than that of the classical LVQ. We make the assumption that the a priori probabilities and the variances of the Gaussian functions are equal to each other. In the two-distribution estimation case, the expected values of the median estimator for the two centers can be derived from (37) ~2
where 6 is (33). In order to evaluate the parameters for the Gaussian kernel we must also estimate the activation domains ?J+l) for each Gaussian function. If Euclidean distance is used for deciding the corresponding activation region for a new data sample (lo), we estimate the boundary TJ between two activation regions j and j 1 as
+
~
for j = 1, . . . ? L - 1. When the Euclidean distance is replaced with the Mahalanobiv distance (14), the boundary condition can be found by solving the equations In the case where estimating the dispersion based on the
MAD estimator for two overlapping Gaussian distributions we obtain from (41) for j = 1, . . . ? L - 1. The first and last boundaries are defined as TO= --oo and TL = 00.The 2L - 1 parameters (Gaussian centers and boundaries) for the case described by (42) and 3L 1 parameters (including the variances) for (43) have to be evaluated. In order to do this, analytical methods can be employed by calculating iteratively the centers of the Gaussian functions and the class boundaries. From the condition (6), the relationship which gives the optimal boundary TI between two classes, each of them modeled by a Gaussian PDF, can be derived as ~
The particular examples considered here are
;
Two Gaussian PDF functions are shown in Fig. 3: p l ( X ) with 1-11 = 3, 01 = 2, ~1 = 0.7 and p 2 ( X ) with pz = 12,
;
f ( X ) = N ( 5 , ff)+ N(10, 0 ) f ( X ) = N ( 3 , 0 ) + N ( 5 , 0)+ N(10, 0 )
+
+
+
where N ( p , 0)denotes a Gaussian distribution.
(48) (49)
BORS AND PITA!;: MEDIAN RADIAL BASIS FUNCTION
1359
20
. .. .. . . . .. . . . .
15 -
10 -
tl
2
5E
5-
0( . I.
P;!
-5 -
.
.:
'.
. -10
0
-5
-10
.
25
15
10
5
20
I
2
RBF - Mahalanobis
4
5-
MRBF - Mahalanobis
0' 0
500
1000
2000
1500
2500
3000
3500
4000
Data samples Fig. 8. The learning curves in the case when the samples are drawn from Distribution I.
The convergence is the property of a neural network to achieve a stable state after a finite number of iterations. The convergence can be defined individually for a weight or globally, expressing the state of the network by a cost function. In the following we analyze the capacity of various weights to achieve a stable state. In the example (48) let us assume o = 2. We use MRBF to estimate the parameters of the distribution N ( 5 , 2). We find the expectation for the
median by replacing the formula (35) in (31) and computing the integral numerically. In Fig. 4(a) we compare the expected bias for the marginal median against the bias of the stationary estimate of the mean, when estimating the Gaussian center. In Fig. 4(b) we provide a comparison between 1.he expected bias of the MAD estimator (41) and that of the stationary estimate of the classical estimator for scale, which can be derived from (38). The expectation for scale parameter using
IEEE TRANSACTIONS ON NEURAL NETWORKS, VOL 7. NO 6, NOVEMBER 1996
1360
-.. ... ........... ...... ,.. ..._I .I.,.. , *: ..i. ,.
. I
.I
.... .. I .
.. .. .. .. ... ... ... ... .... .. .. .. .. .... .. .. . .... .. ..
.,
.
.. .. .. ;L
... ..... ......
(a)
...... . ..-.-. .-__.-._. .. . . .- .-. . -............... -. . . .. . . . .... ....... ..-......... .._..... _..- .-............ ...... -. ... .... -. ...... __.. ----. ............ ..-. ........ ..... . ............ ............ C . .
C C .
C . .
& .
I
............ . . . . . . . . . . .. ._ ........... ......... -. .. .. -.. .._. .. ....... . . . . . _ .. .._. . . -___-. ...... . . _---. ...... .. .- --. . . . . .. .. .. .. .. .. .. .. .. .. .- . ... ... ... ... ... ......... .. .. ........... .. ........... .. -. ......... .. ........... .. ........... .. .. ........... ........... ..... . . . ..-. ...... -... .. .. ........... .. ..
-
.. ...-. . . . .. . .. ..-_ ..
..... .... .. ._~_. .. --. -.-. . ...-. .... ... ... ... ... .... ..... ... .... .... .... ..... ... .... ..... . .. .. ..
C.
1
..
....... ..... ........ .. .. .. .... ......
......
... ... ... ... ... ...
.. .. ._... .. . .. .. .. .. .. .. ....... ..... ....... - .. ~.
.. .. .. .. .. .. .. .. .. .. .. .. .. .. .. .. .. .. ... .
... ....... . .--. - . .... ....... ................ ............. .. .. .. .. ............. --_ .... .. .... .. .... ..... -. .. ..I-....... ...---. .-. . .. _ ......... ........
..... ... .-. . . .
cI____
-
I
I
Y
... /-:! ... ... ... ... ........
(b) Fig. 9. Frame? from the "Hamburg taxi" sequence: (a) the first frame and (b) the third frame.
........ ........
the MAD estimator is obtained after evaluating (39). From these plots it is clear that median and MAD algorithms provide better parameter estimation than arithmetic mean and classical sample dispersion estimator, in the case when estimating overlapping normal functions. We estimate the center and the scale parameter for the distribution N ( 5 , a ) using both classical and robust type learning in the case of the distribution mixtures (48) and (49). The class which corresponds to N ( 5 , 0 ) is bounded in the case of (49) and unbounded to the left in the case of (48). Thus, in the case of (48), the data samples used for training are drawn from a "medium-tailed" distribution and in the case of (49) from a "short-tailed'' one. The stationary state of the bias E[ji] p is depicted in Fig. 5(a) for the distribution (48) and in Fig. 5(b) for the distribution (49), both with respect to the assumed dispersion (scale parameter) 0 . The comparison results for estimating the stationary state of the bias for the scale parameter E [ & ]- o are given in Fig. 5(c) and (d). From these plots it is evident that if ~
........ ......... ....... .. .. .. .. .. .. .. .. .. .. .... .... .... .... .... .. .. .. .. .. .. .. .. .. .. .. .. .. .. .. .. .... ....
.......
......... ................. .......
. I
.
.. .. .. .../. ....... . . . . .. .. .. .. .-.......... .............. ..,. .. .. .. .. .. .. .. .. .. .. .. .. -. .-............. . .-... .. .. .. .. .. .. .. .. .. .. _. ............... -./ ..". ". ." .". . . . .... . . -. ........ -. .......... ........ I " ' " .............. .. .. .. .. .. .. .. .. .. .. .-.. .... . . . . . .. .. .. .. .. .. .. .. .. ......... L
-/
......... .. .. .. .. .. .. .. .. .. .. ....................... ............ .. .. . . .............. . . . . . . . . . ../. . . ... .......... . . . . . . .. .. .. . . . . . . .............. ........ .ccec
-A..
......~..e.
....
(C) Fig. IO. The pindiagrams representing the optical flow corresponding to the movement between the first and third frames: (a) the optical flow provided by the block matching algorithm, (b) the optical flow after it was smoothed by the MRBF network, and (c) the optical flow after it was smoothed by the RBF network.
certain overlaps occur among various Gaussian functions from the mixture, the respective amount of data samples contains
BORS AND PITAS: MEDIAN RADIAL BASIS FUNCTION
1361
outliers, while median and MAD estimators provide lesser bias than mean and classical sample deviation estimators. If the Gaussian functions are far away from each other with respect to their dispersions, the amount of outliers decreases and both algorithms provide similar results. However, if the isolated Gaussian functions are truncated, e.g., due to the decision (lo), the robust estimators are more accurate than those based on classical statistics.
TABLE I1 OPTICALFLOWSEGMENTATION RESULTS
Network Topology N-L-M
MRBF MAE MSE TIME(s) First I
1.53
1
8.57
1
0.21
I
0.37
MAE
1
2.39
1
17.60
1
0.30
I 0.46 1
V. SIMULATION RESULTS
A. Estimating Probability Density Functions In the previous section we have evaluated the theoretical performance in parameter estimation for both algorithms described in Section 111. In this section, we test these algorithms for the estimation of mixed bivariate normal and contaminated normal distributions. The problem of finding the parameters for the Gaussian functions is Seen as a supervised learning task. We consider four artificially generated distributions, each containing twodimensional (2-D) clusters. This problem can be considered as a 2-D extension of the mixture of Gaussians model analyzed in Section I\'. A 2-D Gaussian distribution is denoted by N ( p 1 , p2; 01, 02). The Gaussian clusters are grouped in two classes in orcler to form more complex distributions. Distribution I:
P:(X) = N ( 2 ; 1; 3, 1)
+ N ( 8 , 7; 3, 1)
P,'(X) = N ( 8 , 2; 1: 3 ) + N ( 2 , 6; 1, 3 ) .
(SO)
Distribution 11.
P;'(X) = N ( 6 , 0; 4:1) + N ( 0 : 6; 1, 4) P i ' ( X ) = N ( 6 , 6; 2, 2).
(51)
Two more distributions are obtained from the first two by adding uniform distributed data samples. Distribution Ill:
PL"(X) =
+ (1 - c ) U ( [ - 5 ; 151, [ - 5 , 151).
(52)
Distribution IV:
p;"(x) = fpi'
+ (1
-
t)U([-5. 151,[-5, 151)
(53)
where k E { 1. 2) and E = 0.9. We denote by U ( [ - 5 . 151, [-5. 151) a uniform distribution having the domain [-5, 151 x [-5, 151. For MRBF we consider a running window of W = 401 samples when evaluating the median estimator according to (16). Both Euclidean and Mahalanobis distances were considered in order to decide which neuron to be updated for a new data sample. The same data were used for training both algorithms. We have tested the ability of classification for both networks after the learning stage was concluded. The misclassificaiion error compares the true output S ( X ) with the output Y k ( X ) given by the network and is represented as a fraction of the total number of samples. The second
comparison criterion is the approximation of the PDF functions by the networks. The optimal network is obtained when the network weights are equal with the paramleters of the Distribution I or I1 (SO) and (51). The mean isquare error calculated between the ideal function and the estimated one is defined as I
1
M
M
n
k=1
where j j k ( X ) is the hypersurface modeled by the kth output unit. This consists of a global performance estimat:ion measure. The comparison results provided by the networks are provided in Table I. Each experiment was repeated many times for different data, drawn from the same distributions. Patterns from the first two distributions are represented in Figs. 6 and 7. The two figures display also the boundaries found by means of neural networks as well as the optimal boundaries. The same number of hidden units are assumed for each network. From these figures it is evident that MRBF approximates better than RBF the class boundaries. The advantage is clear for MRBF in all the cases considered in Table I. However, when the mixture of bivariate normal distributions is contaminated with uniform distributed patterns (e.g., in Distributions 111 and IV) the difference becomes very large because robust type learning is insensitive at extreme observations. By using the Mahalanobis distance (14) instead of the Euclidean one we obtain better results for both algorithms, excepting for the case when we use the classical estimators for the uniform contaminated model (52) and (53). In this case, because of the noise corruption, the estimation of the covariance matrices is poor. The MRBF algorithm based on the Mahalanobis data assignment rule gives the best results in all the assumed cases, as it can be seen from Table I. In Fig. 8 we evaluate the global convergence of the algorithms in the case when the data are drawn from Distribution 1. The learning curves represent the estimation of the PDF functions given by MSE (S4), with respect to the number of drawn samples. From this plot it is clear that MEBF network provides a smaller MSE when compared to the classical RBF network. The improvement produced when using Mahalanobis distance is evident from this plot as well.
B. Optical Flow Segmentation Motion representation and modeling is an important step toward dynamic image understanding. The optical flow field consists of the distribution of the velocities associated with the image element displacement. A variety of motion estimation
IEEE TRANSACTIONS ON NEURAL NETWORKS, VOL. I, NO. 6, NOVEMBER 1996
I362
EVALUATION OF THE
SPEED
TABLE 111 (IN PIXELS/FRAMES) FOR VARIOUS McTrTk7MOVINGn”’7n‘’.‘ OBJECI‘S
Taxi Method RBF
Network Topology 2-4-4
X -5.08
Y -1.62
Car
Van
X -5.08
techniques exists [ 3 5 ] . Block matching motion estimation techniques are widely used in video coding. A block matching algorithm assumes that the object displacement is constant within a small block of pixel elements. The block displacement is estimated by using correlation or matching techniques. The 2-D vector is chosen such that it minimizes the mean absolute error or mean square error between two blocks from a certain neighborhood from two different frames [ 3 5 ] . The best results are obtained when a full search is employed. This method takes into consideration all the possible pixel blocks within a region around the original block. The search region is chosen according to the expected maximal speed in the sequence. By employing block matching techniques, good results can be obtained in the regions having many details. However, in regions with almost constant pixel intensity, this algorithm usually gives a certain number of erroneous decisions. Optical flow segmentation algorithms identify the regions having similar motion vectors. Various algorithms based on clustering were proposed to be used in optical flow segmentation [36], [371. When applying RBF networks for optical flow segmentation, the centers of the hidden units represent groups of motion vectors [38]. Each set of vectors corresponds to an object or to a part from an object, moving with a certain velocity. We have applied the algorithms presented in Section 111 in the “Hamburg taxi” sequence. The first and third frames of this sequence are shown in Fig. 9(a) and (b). Their frame size is 256 x 190 and they contain three important moving objects: a taxi turning around the corner, a car in the lower left moving from left to right and a van in the lower right moving from right to left. In the first processing stage we have estimated the optical flow by using the full search block matching algorithm, when assuming blocks of 4 x 4 pixels. The block matching search region is taken [ - 8 , 81 x [-8, 81 pixels wide. The motion field provided by the block matching is shown in Fig. lO(a). The optical flow histogram is represented in Fig. IO(a). The four moving objects (including the background) can be easily identified as histogram peaks (a concentration of motion vectors with similar velocity) in Fig. 1 l(a). We have employed both RBF and MRBF neural networks for optical flow segmentation. The input to hidden unit weights are calculated in an unsupervised manner as it was presented in Section 111. We have considered a second level clustering algorithm for finding the output weights &. Each cluster of motion vectors which activates a hidden unit is assigned to an
Y -1.62
X 5.27
Y -0.39
X
Y
-0.02
-0.05
output unit based on the Euclidean distance between each two hidden unit centers. We have evaluated the performance of the algorithms in terms of mean square error (MSE) as well as mean absolute error (MAE) of the optical flow with respect to the center selection
(55)
where Xi, si = 1; . . . . nJ are data samples assigned to the j t h unit. Image sequence processing needs fast algorithms in most applications. Thus, we have implemented the histogrambased algorithm for MRBF as presented in Section 111-C. Both algorithms were tested in the same conditions. The hidden units which have assigned only a very small amount of motion vectors, are pruned out. Only one pass through data is enough in order to achieve a good motion smoothing. The comparison results in terms of MAE, MSE, and training time are shown in Table 11. The time for the first layer updating corresponds to the calculation of the hidden unit weights. The total time includes also the output weights calculation. All these times correspond to an implementation on a Silicon Graphics Indigo Workstation. The implementation algorithm proposed in Section 111-C for MRBF parameter evaluation proved to be fast. We have also evaluated the speed (in pixeldframes) for the corresponding moving objects. The optimal velocity was calculated as the average of the clear feature displacements from each moving object, obtained independently, in a semiautomatic way. The comparison results between the real speed of the objects and the speed obtained by means of the RBF and MRBF algorithms are given in Table 111. The velocity vectors found in the “Hamburg taxi” sequence by MRBF and RBF algorithms are displayed in Fig. 10(b) and (c). The smoothing obtained after processing the optical flow by using either MRBF or RBF algorithm is clear from these figures. A more complex criterion taking into account the block average graylevel and the position of the blocks would provide better moving object segmentation results [38]. The histograms representing the optical flow modeled by means of MRBF and RBF networks as IXk3 1 +j(X) are shown in Fig. 1 l(b) and (c), respectively. Comparing these histograms to the initial optical flow histogram from Fig. 1 l(a)
BORS AND PITAIS: MEDIAN RADIAL BASIS FUNCTION
1363
VI. CONCLUSIONS In this paper we present a novel algorithm for estimating the RBF weights based on robust estimation and called median RBF. This algorithm is presented in comparison with a classical approach for training an RBF network. We have employed the marginal median estimator for evaluating the basis function centers and the MAD for estimating the dispersion parameters. We propose an implementation for MRBF network based on data histogram updating which proved to be fast. We provide the theoretical evaluation of the bias for both aligorithms in the case when estimating overlapping Gaussian distributions. The MRBF-based training is less biased by the presence of the outliers in the training set and was proved to provide an accurate estimation of the implied probabilities. Both RBF and MRBF algorithms were compared in PDF estimation of artificially generated data as well as in motion segmentation of a real-life image sequence. In both cases, the MRBF gave better estimation of the implied PDF’s and has shown better classification capabilities.
REFERENCES
Fig. 11. The optical flow histograms corresponding to the movement between the first and third frames. From left to right the peaks in histograms represent the van, the taxi, the background and the left car: (a) the histogram of the optical flow when using the full search block matching algorithm, (b) the histogram represented by means of MRBF network, and (c) the histogram represented by means of RBF network.
we can observe that MRBF network approximates it better than RBF. From Figs. 1O(c) and 1 1(c), as well as from Table I11 we can see that the algorithm based on classical training was not able to identify correctly the movement of the “taxi“ moving object. According to these experiments, the proposed learning algorithm MRBF, provides better estimation for the desired parameters when compared to the classical statistics based training for the RBF network.
T. Poggio and F. Girosi, “Networks for approximation and learning,” Proc. IEEE, vol. 78, no. 9, pp. 1481-1497, Sept. 1990. E. J. Hartman, J. D. Keeler, and J. M. Kowalski, “Layered neural networks with Gaussian hidden units as universal approximations,” Neural Computa., vol. 2, pp. 210-215, 1990. J. Park and J. W. Sandberg, “Universal approximation using radial basis functions network,” Neural Computa., vol. 3, pp. 246-;!57, 1991. E. Parzen, “On estimation of a probability density function and mode,” Ann. Math. Stat., vol. 33, pp. 1065-1076, 1962. R. M. Sanner and J.-J. E. Slotine, “Gaussian networks for direct adaptive control,” IEEE Trans. Neural Networks, vol. 3, pp. 837-863, Nov. 1992. D. S. Broomhead and D. Lowe, “Multivariable functionial interpolation and adaptive networks,” Complex Syst., vol. 2, pp. 321--355, 1988. J. Moody and C. Darken, “Fast learning in networks of locallytuned processing units,” Neural Computa., vol. 1, no. 2, pp. 281-294, 1989. R. J. Schalkoff, Pattern Recognition: Statistical, Structural, and Neural Approaches. New York: Wiley, 1992. T. K. Kohonen, SelfOrganization and Associative Memory. Berlin: Springer-Verlag, 1989. D. F. Specht, “Probabilistic neural networks and the polynomial adaline as complementary techniques for classification,” IEEE T r a m Neural Networks, vol. 1 , pp. 111-121, Mar. 1990. __ , “A general regression neural network,” IEEE Trans. Neural Networks, vol. 2, pp. 568-576, Nov. 1991. H. G. C. TrivCn, “A neural-network approach to statistical pattern classification by semiparametric estimation of probability density functions,” IEEE Trans. Neural Networks, vol. 2, pp. 366-377, May 1991. M. T. Musavi, W. Ahmed, K. H. Chan, K. B. Faris, and I). M. Hummels, “On the training of radial basis functions classifiers,” Neural Networks, vol. 5 , pp. 595-603, 1992. A. G. Bora and M. Gabbouj, “Minimal topology for a radial basis functions neural network for pattern classification,” Digital Signal Processing: A Rev. J., vol. 4, no. 3, pp. 173-188, July 1994. J. Platt, “A resource-allocating network for function interpolation,” Neural Computa., vol. 3, no. 2, pp. 213-225, 1991. S. Chen, B. Mulgrew, and P. M. Grant, “A clustering technique for digital communications channel equalization using radial basis function networks,” IEEE Trans. Neural Networks, vol. 4, pp. 570-579, July 1993. S. Lee and R. M. Kil, “A Gaussian potential function network with hierarchically self-organizing learning,” Neural Networks, vol. 4, pp. 207-224, 199 1, S. Chen, C. F. N. Cowan, and P. M. Grant, “Orthogonal least squares learning algorithm for radial basis functions networks,” IEEE Trans. Neural Networks, vol. 2, pp. 302-309, Mar. 1991.
1364
IEEE TRANSACTIONS ON NEURAL NETWORKS, VOL. I, NO 6, NOVEMBER 1996
[191 S. Chen and B . Mulgrew, “Overcoming cochannel interference using an adaptive radial basis functions equalizer,” Signal Processing, vol. 28, pp. 91-107, July 1992. 1201 T. K. Kohonen, “The self-organizing map,” Proc. IEEE, vol. 78, no. 9, pp. 1464-1480, Sept. 1990. [21] L. Xu, A. Krzyzak, and E. Oja, “Rival penalized competitive learning for clustering analysis, RBF net, and curve detection,” IEEE Trans. Neural Networks, vol. 4, pp. 636-649, July 1993. [22] G. Seber, Multivariate Observations. New York: Wiley, 1986. [23] I. Pitas and A. N. Venetsanopoulos, Nonlinear Digital Filters: Principles and Applications. Norwell, MA: Kluwer, 1990. 1241 I. Pitas and P. Kiniklis, “Median learning vector quantizer,” in Proc. SPIE, Nonlinear Image Processing, San Jose, CA, vol. 2180, Feb. 7-9, 1994, pp. 23-34. [25] A. Papoulis, Probability, Random Variables. and Stochastic Processes. New York: McCraw-Hill, 1984. [26] A. Gersho and R. M . Gray, Vector Quantization and Signal Compression. Norwell, MA: Kluwer, 1992. 1271 B. Widrow and S . D. Steams, Adaptive Signal Procexsing. Englewood Cliffs, NJ: Pi-entice-Hall, 1985. [28] J. A. Kangas, T. K. Kohonen, and J. T. Laaksonen, “Variants of selforganizing maps.” IEEE Trans. Neural Networks, vol. 1, pp. 93-99, Mar. 1990. [29] E. Yair, K. Zeger, and A. Gersho, “Competitive learning and soft competition for vector quantizer design,’’ IEEE Trans. Signal Processing, ml. 40, no. 2, pp. 294-309, Feb. 1992. [30] A. G. Borg and I. Pitas, “Robust estimation of radial basis functions,” in Proc. IEEE Wkshp. Neural Networks f o r Signal Processing, Ermioni, Greece, Sept. 6-8, 1994, pp. 105-114. 1311 I. Pitas, C. Kotropoulos, N. Nikolaidis, R . Yang, and M. Gabbouj, “A class of order statistics learning vector quantizers,” in Proc. IEEE h t . Symp. Circuits Syst., London, 1994, pp. VI--387-VI-390. 1321 D. E. Rumelhart and J. L. McClelland, Parallel Distributed Processing. Cambridge, MA: MIT Press, 1986. 1331 J. Hertz, A. Krogh, and R. G. Palmer, Introduction to Theory of‘Neuru1 Computation. New York: Addison-Wesley, 1991. [34] T. S. Huang, G. J. Yang, and G. Y. Tang, “A fast two-dimensional median filtering algorithm,” IEEE Trans. Acoust., Speech, Signal Processing, vol. ASSP-27, pp. 13-18, 1979. [35] A. N. Netravali and B. G. Haskell, Digital Pictures: Representation and Compression. New York: Plenum, 1988. [36] M. M. Chang, A. M. Tekalp, and M. I. Sezan, “Motion-field segmentation using an adaptive MAP criterion,” in Proc. IEEE Int. Conf Acoust., Speech, Signal Processing, Minneapolis, MN, Apr. 1993, pp. V-33-V-36. [371 D. P. Kottke and Y. Sun, “Motion estimation via clustering matching,” IEEE Trans. Pattern Anal. Machine Intell., vol. 16, pp. 1128-1 132, Nov. 1994. [381 A. G. Borg and I. Pitas, “Median radial hasis function network for optical flow processing,” in Proc. IEEE Wkshp. Nonlinear Signal and Image Processing, Neos Marinaras, Greece, June 1995, pp. 702-70.5.
Adrian G. Borv was born in Piatra Neami, Romania, on November 3, 1967. He received the M.S. degree in electronics engineering from the Polytechnic University of Bucharest, Romania, in 1992. He is currently working toward the Ph.D. degree. During 1992 to 1993, he was a Visiting Researcher at the Signal Processing Laboratory, Tampere University of Technology, Finland. Since 1993. he has been with the University of Thessaloniki, Greece. His research interests include neural networks, computer visii3n , pattern recognition, and nonlinear digital signal processing.
Ioannis Pitas (SM’94) received the Diploma degree in electrical engineering in 1980 and the Ph D degree in electrical engineering in 1985, both from the University of Thessaloniki, Greece Fiom 1980 to 1993, he served as Scientihc Assistant, Lecturer, Assistant Professor, and Associate Profes\or in the Department of Electtical and Computer Engineering, University of Thessdloniki He served as a Visiting Research Associate at the University of Toronto, Cdnada, the University of Erlangen Nuernberg, Germany, and Tampere Uni versity of Technology, Finland, a\ well as Visiting Assistant Professor at the University of Toronto He WdS Lecturer in short courses for continuing education Since 1994, he has been d Professor at the Department of Informntics at the University of Thessaloniki His cunent interests dre i n the dreds of digital image processing, multidimen\ional signal processing, dnd computer vision He has publirhed more thdii 190 papers and contributed to eight books in his area of interest He I\ the coauthor of the book, Nonlrneiir Digital F‘rlferc. Principles andApplications (Boston, MA Kluwer, 1990) He is duthor of the book, Digital Image Processing Algorithms (Englewood Cliffs NJ Prentice Hall, 1993) He 15 editor of the book, Parallel Algorithm and Archrfetturer f o r Digital Image Proteyring, Cornputer ! h i o n , and Neural Networks (New York Wiley, 1993) Dr Pitas ha\ been a membei of the European Community ESPRIT Pdiallel Action Committee He hds dlso been dn invited spedker and/or member of the progiam committee of 5everdl scientihc conferences and workshops He I\ an Associate Editor of the IEEE TRA~SAC’IIOUS oh CIRCUITS AUD SYSTEMS and coeditor of Multidimenru“ Systems and Signal Procetsing He waq chair of the 1995 IEEE Workshop on Nonlinear Signal and Imdge Piocessing (NSIP’9.5)