Statistical Science 1998, Vol. 13, No. 1, 30–53
Medical Image Compression and Vector Quantization Sharon M. Perlmutter, Pamela C. Cosman, Chien-Wen Tseng, Richard A. Olshen, Robert M. Gray, King C. P. Li and Colleen J. Bergin
Abstract. In this paper, we describe a particular set of algorithms for clustering and show how they lead to codes which can be used to compress images. The approach is called tree-structured vector quantization (TSVQ) and amounts to a binary tree-structured two-means clustering, very much in the spirit of CART. This coding is thereafter put into the larger framework of information theory. Finally, we report the methodology for how image compression was applied in a clinical setting, where the medical issue was the measurement of major blood vessels in the chest and the technology was magnetic resonance (MR) imaging. Measuring the sizes of blood vessels, of other organs and of tumors is fundamental to evaluating aneurysms, especially prior to surgery. We argue for digital approaches to imaging in general, two benefits being improved archiving and transmission, and another improved clinical usefulness through the application of digital image processing. These goals seem particularly appropriate for technologies like MR that are inherently digital. However, even in this modern age, archiving the images of a busy radiological service is not possible without substantially compressing them. This means that the codes by which images are stored digitally, whether they arise from TSVQ or not, need to be “lossy,” that is, not invertible. Since lossy coding necessarily entails the loss of digital information, it behooves those who recommend it to demonstrate that the quality of medicine practiced is not diminished thereby. There is a growing literature concerning the impact of lossy compression upon tasks that involve detection. However, we are not aware of similar studies of measurement. We feel that the study reported here of 30 scans compressed to 5 different levels, with measurements being made by 3 accomplished radiologists, is consistent with 16:1 lossy compression as we practice it being acceptable for the problem at hand. Key words and phrases: Lossy image compression; tree-structured vector quantization; measurement accuracy; image quality; evaluation.
ford University School of Medicine and, by courtesy, the Department of Statistics and the Department of Electrical Engineering, Stanford University, Stanford, California 94305 (e-mail:
[email protected]). Robert M. Gray is Professor, Department of Electrical Engineering, Stanford University, Stanford, California 94305. King C. P. Li is Assistant Professor, Department of Radiology, Stanford University School of Medicine, Stanford, California 94305. Colleen J. Bergin is with the Department of Radiology, University of California, San Diego, La Jolla, California 92093.
Sharon M. Perlmutter is with America Online, Inc., Irvine, California 92612. Pamela C. Cosman is Assistant Professor, Department of Electrical and Computer Engineering, University of California, San Diego, La Jolla, California 92093-0407. Chien-Wen Tseng is with the University of Washington Medical Center, Seattle, Washington 98105-6920. Sharon M. Perlmutter, Pamela C. Cosman and Chien-Wen Tseng were formerly with the Department of Electrical Engineering, Stanford University. Richard A. Olshen is Professor, Division of Biostatistics, Stan30
MEDICAL IMAGE COMPRESSION
1. INTRODUCTION Recent years have seen an increasing use of imaging technologies such as magnetic resonance imaging (MRI) and computerized tomography (CT) that render images in digital format. Although such digital images are usually reduced to hard-copy analog form for display, their digital properties hold promise for a significant expansion of their uses in diagnosis. They are amenable to signal processing, including image enhancement and classification, the combining of images obtained from different modalities, 3-D modeling and motion video. One fundamental difficulty in working with digital medical images, however, is the size of individual files involved (CT, 0.5 Mb; MR; 0.13 Mb; digitized X-rays; 8 Mb); this difficulty is compounded by the immense number of images produced. Each year Stanford University Medical Center alone generates some 1.2 Terabytes of CT and MR images that require digital storage on magnetic tape. Because of space constraints, the tapes are erased and reused after two years; images remain available only in analog hard-copy format if at all. If the digital properties of medical images are to be exploited, it is clear that compression will be needed to allow long-term and cost-efficient storage, as well as rapid access and transmission. When a standard lossless (reversible) compression scheme such as a Lempel–Ziv algorithm is applied to MR and CT scans, typically compression ratios of about 2 : 1 are achieved. Recent studies have shown that, with more complex lossless compression, compression ratios of 3 : 1 or 4 : 1 are possible [5, 6, 60, 61]. Lossless compression alone is in general insufficient to attain ratios better than 4:1. It is then natural to turn to schemes for lossy (irreversible) compression that have provided excellent results for nonmedical images. One goal of this paper is to survey the basic theory and algorithmic ideas underlying lossy compression, especially the trade-offs between common engineering measures of image quality, the bit rate required for transmission and storage, and the complexity of implementing the compression algorithms. The basic problem formulation and many of the techniques used to design compression systems directly parallel ideas in statistical classification and regression, and these parallels have proved useful in designing simple and effective codes. Most compression algorithms in practice are digital, beginning with an information source that is discrete in time and amplitude. If an image is initially analog in space and amplitude, one must first render it discrete in both space and amplitude before compression. Discretization in space is gener-
31
ally called sampling—this consists of examining the intensity of the analog image on a regular grid of points called picture elements, or pixels. Discretization in amplitude is simply scalar quantization: a mapping from a continuous range of possible values into a finite set of approximating values. The term analog-to-digital (A/D) conversion is often used to mean both sampling and quantization, that is, the conversion of a signal that is analog in both space and amplitude to a signal that is discrete in both space and amplitude. Such a conversion is by itself an example of lossy compression. A general system for digital image compression is depicted in Figure 1. It consists of one or more of the following operations, which may be combined with each other or with additional signal processing: • Signal decomposition—The image is decomposed into several images for separate processing. The most popular signal decompositions for image processing are linear transformations of the Fourier family, especially the discrete cosine transform (DCT), and filtering with a subband or wavelet filter bank. Both methods can be viewed as transforms of the original images into coefficients with respect to some set of basis functions. There are many motivations behind such decompositions. Transforms tend to “mash up” the data so that the effects of quantization error are spread out and ultimately invisible. Good transforms concentrate the data in the lower order transform coefficients so that the higher order coefficients can be coded with few or no bits. Good transforms tend to decorrelate the data with the intention of rendering simple scalar quantization more efficient. The eye and ear are generally considered to operate in the transform domain, so that it is natural to focus on coding in that domain where psychophysical effects such as masking can be easily incorporated into frequency dependent measures of distortion. Lastly, the transformed data may provide a useful data structure, as do the multiresolution representations of wavelet analysis. • Quantization—High rate digital pixel intensities are converted into relatively small numbers of bits. This operation is nonlinear and noninvertible; it is “lossy.” The conversion can operate on individual pixels (scalar quantization) or groups of pixels (vector quantization). Quantization can include discarding some of the components of the signal decomposition step. Our emphasis is on quantizer design. • Lossless compression—Further compression is achieved by an invertible (lossless, entropy) code
32
S. M. PERLMUTTER ET AL.
Fig. 1. Image compression system.
such as run-length, Huffman, Lempel–Ziv or arithmetic code. Many approaches to systems for image compression have been proposed in the literature and incorporated into standards and products, both software and hardware. These differ primarily by the different choices made for the three basic components: signal decomposition; quantization; and lossless coding. A variety of systems and algorithms for compression are described to provide context, but the method chosen for the current study is a compromise among a variety of considerations. The algorithm used was predictive pruned tree-structured vector quantization [12, 32, 62, 45]. This technique involves fast encoding and decoding, and provides additional advantages such as simple progressive transmission and potential incorporation of other signal processing techniques such as classification [56, 57]. The algorithm does not perform a signal decomposition such as a DCT or wavelet, and it produces directly a variable length code without separate entropy coding. Our reasons for selecting this algorithm are threefold. The first is simplicity; in particular, the compression operates directly on the individual pixels and produces a variable rate bitstream without the need to compute transforms and inverse transforms or to do separate entropy coding. This results in a simple decompression algorithm that depends mostly on table lookups with few arithmetic operations. The second reason is that the tree-structured algorithms used inherently provide a natural progressive structure to the code, which incorporates the ability for progressive reconstruction of an improved image as bits arrive. Finally, our emphasis in this work is on judging the quality and utility of lossy compressed medical images, and the protocol for evaluating quality does not depend on the compression algorithm at all. The purpose of the compression system is to code an information source, such as a sequence of pixel blocks making up an image, into a sequence of binary integers or bits, which can then be decoded or decompressed to reproduce the original source with the best possible fidelity. The goal is to have the best possible fidelity between the reproduction and orig-
inal subject to a constraint on the average number of bits transmitted or stored. With medical images, however, the common engineering measures of quality such as signal-to-noise ratio (SNR) are insufficient; in medical applications the primary concern is that the diagnostic accuracy of the lossy compressed images remain not less than that of the original images. Signal-to-noise ratios and mean squared error (MSE) may indicate diagnostic accuracy, but the accuracy must be demonstrated directly. In addition, the images must appear nearly identical to the originals, or the radiologists will not use them no matter their other features. A wide variety of diagnostic tasks must be studied, including measurement of structures, detection of lesions and interpretation of texture. We have developed and implemented protocols for experimentation by which the diagnostic accuracy of radiologists who make use of images, compressed or not, can be quantified. Most previous studies have focused on the effects of lossy compression on detection tasks [7, 16, 18, 35, 48, 64]. We are not aware of any other studies on the effects of lossy compression on the accuracy of measurement. Measurement tasks on structures such as blood vessels, other organs and tumors take a central role in the evaluation of aneurysms, especially prior to surgery. Abdominal aortic aneurysms are evaluated routinely with ultrasound; thoracic aortic aneurysms are evaluated by CT or MRI. The aortic diameter is usually measured manually with calipers. A measured value of diameter in excess of 4 cm entails a diagnosis of aneurysm. A larger aneurysm carries a greater risk of rupture. About 10% of those aneurysms between 5 and 10 cm in diameter and about 50% of those with values greater than 10 cm do eventually rupture [41]. Because rupture is invariably fatal, measured values more than 5 or 6 cm indicate operative repair [68, 8]. Of course the clinical decision depends not only on the size of the aneurysm but also on the clinical status of the patient (especially as concern pain and hemodynamic instability). Dilation less than 5 cm in diameter may be followed conservatively by serial MR imaging studies at 6-month intervals. Observing an increase in the aortic diameter of 0.5 cm over the course of a 6-month interval would be indication for
33
MEDICAL IMAGE COMPRESSION
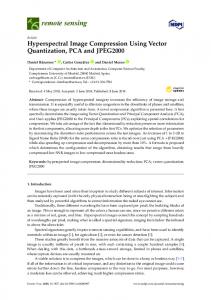
surgical repair. Comparison films are imperative for appropriate management of these patients. The goal of the study reported here was to quantify the effects of lossy compression on measurement accuracy through experiments that follow closely the clinical tasks of radiologists evaluating aortic aneurysms. We wished to examine whether compression maintains the information required for accurate measurements, or whether it leads to inaccuracies by blurring edges or distorting structures. The task to be studied is the measurement of four primary blood vessels in the mediastinum: the ascending aorta, descending aorta, right pulmonary artery (RPA) and superior vena cava (SVC). Clearly, if compression at a certain bit rate caused a 0.5-cm error in the aortic measurement above and beyond any error that might typically be made on the uncompressed image, the compression would be unacceptable. One fundamental message readers might take from this paper is that what variability there is in the measurements of our judges (at least for images compressed not more than to 0.55 bits per pixel) is already there in measurements on uncompressed images. Although we focused on the medical problem of thoracic aortic aneurysms as seen on MR scans, the methodology developed in this research is broadly applicable to any medical task requiring the measurement of structures. Our project is divided into three general areas as follows: • establishing a protocol for obtaining measurements and subjective scores in a clinical setting; • establishing a “gold standard” for the “correct vessel sizes,” selecting parameters for quantifying measurement error and choosing a set of statistical methods to determine to what bit rate these images can be compressed without loss in measurement accuracy; • determining whether subjective scores and measurement error vary similarly with decreasing bit rates. A set of 9-bit original MR chest images containing aneurysms and normal vessels was compressed to five bit rates between 0.36 and 1.7 bits per pixel (bpp). Example images are seen in Figure 2. The approach to compression is through a binary tree-structured two-means clustering, very much like CART. The basic set of algorithms is called tree-structured vector quantization (TSVQ), and considerable detail is given later in the paper after background material provides context. Radiologists measured the four vessels on each image. As a separate task, the radiologists also rated the subjective quality of each image by assigning a score of 1 (worst) through 5 (best) to each image.
In our statistical analyses, we set two gold standards, a “personal” one [16, 18], and an “independent” one. These are two methods of establishing the correct size of each blood vessel, that is, the underlying “truth” of each image. The personal gold standard is derived for individual radiologists based on their own measurements of the same image at the uncompressed level. Since the personal gold standard defines the measurements on the originals to be correct (for that image and that judge), the compressed images cannot be as good as the originals if there is random error in the measurement process. For this reason, we also defined an independent gold standard. This is based on the consensus measurements taken by two radiologists on the original images. These two radiologists are different from the three radiologists whose judgments are used to determine diagnostic accuracy. This does introduce interobserver variability into that portion of the analysis, but it also allows the original images to be compared fairly with the compressed ones. For each of these gold standards, we quantify the accuracy of the measurements at each compression level by taking the percentage measurement error for each image, defined to be the difference between a radiologist’s measurement and the gold standard, scaled by the gold standard measurement. This error is reported as a function of bit rate. Other parameters such as subjective scores and signal-tonoise ratios are also analyzed as functions of bit rate. Variabilities of the measurements by (judge, image) pairs are quantified by two-way analyses of variance in which the effects are level of compression and structure, and there is also a (one degree of freedom) term for nonadditivity. These ANOVAs are thought of as descriptive statistics, and they are summarized by various box plots. 2. SIGNAL COMPRESSION We review the basic notions of sources, codes, fidelity and optimal performance and describe both general and specific compression systems, including the particular algorithm—predictive treestructured vector quantization—emphasized in the image quality experiments considered here. 2.1 Source Coding The Shannon model for a compression system is a source code with a fidelity criterion [66, 67]. The source to be coded, Xny n ∈ Z, is considered a random process, where Z is the integers. The Xn are assumed to take values in k-dimensional Euclidean space with marginal distribution PX . This distribution might be parametric, but in practice we
34
S. M. PERLMUTTER ET AL.
Fig. 2. (a) Original 9:0-bpp MR chest scan; (b) same image compressed to 1:14 bpp; (c) image compressed to 0:36 bpp.
usually work with an empirical distribution PL estimated from a training or learning set L = xl y l = 1; : : : ; L as 1 X PL G = 1x ∈ G L x∈L
for any event G, where 1x ∈ G is the indicator function that equals 1 if x ∈ G and equals 0 otherwise. The dimension k is a parameter of the particular application. Shannon information theory [66, 67] indicates that improved performance can be achieved using larger vector dimensions at the expense of added complexity in terms of memory and computa-
tion. As our example of primary interest, the vectors are rectangular blocks of pixel intensities within a sampled image. A source code or compression code for the source Xn consists of a pair α; β of encoder and decoder. An encoder αx A → 0; 1∗ is a mapping from the input alphabet A (typically a subset of R k ) into the set of all binary sequences of finite length. Of particular importance is the range space W ≡ αA, which we refer to as the channel codebook, the set of binary sequences that are stored in a digital storage medium or are transmitted from the transmitter to the receiver via a digital communication link. In order to ensure that a sequence of symbols (variable
35
MEDICAL IMAGE COMPRESSION
length binary vectors) drawn from the channel codebook can be decoded uniquely if the starting point is known, we require that the W be prefix-free or satisfy the prefix condition: no word in the codebook is a prefix of any other word in the codebook. It is a standard exercise in information theory to demonstrate that any uniquely decodable channel codebook can be made into a channel codebook with the same codeword lengths that also satisfies the prefix condition, and hence no essential generality is lost by the assumption. (See, e.g., [19, 32].) The decoder βx 0; 1∗ → C is a mapping from the space of finite-length binary sequences onto a set C ≡ βwy w ∈ W called the reproduction codebook, with members called reproduction codewords or templates. The members of C are chosen from a reproduction alphabet Aˆ which typically, but not always, is simply the input alphabet, A. For a given encoder we care about the definition of βw only for w ∈ W . It can be defined arbitrarily outside this set. This model of a compression system is general in the sense that it includes any code operating on disjoint blocks of data functionally independent of past or future coding operations. In other words, it models codes that have no memory of previous vectors or anticipation of future vectors. These codes are sometimes referred to as block source codes to distinguish them from codes that can vary the dimension of input blocks or that can operate on overlapping input blocks in a “sliding-block” fashion. 2.2 Quality versus Cost To measure the fidelity or lack thereof between an input vector and its reproduction, we assume that we have a distortion measure dx; y ≥ 0 defined for every possible x; y; dx; x ˆ measures the distortion or loss resulting if an original input x is reproduced as x. ˆ The overall goal of a compression system is to keep distortion and bit rate small. The distortion measure need not be a metric, but ideally it should possess the following properties: • It should be easy to compute so that the distortion can be monitored easily. • It should be tractable for theoretical analysis so that performance can be predicted and optimized for parametric models such as Gaussian sources. • It should be meaningful in the desired application, for example, large or small average distortion should correspond to an image that looks bad or good, respectively, in an entertainment application, or to an image that lends itself poorly or well to further analysis, for example, recognizing tumor tissue in medical images.
No single distortion measure accomplishes all of these goals, although the widely used squared error distortion defined by dx; y = x − y2 =
k−1 X l=0
xl − yl 2 ;
where x = x0 ; x1 ; : : : ; xk−1 , accomplishes the first two goals and occasionally correlates with the third. Unfortunately, distortion measures that have been found to be good measures of perceived quality in speech and images have often proved to be quite complicated and have usually lacked the first two properties [10, 69, 50, 46, 54, 51, 63]. As a result, the squared error distortion has dominated the literature with relatively rare extensions to other measures. For particular applications, one variation on the squared error distortion measure has provided a promising means of incorporating perceptually important characteristics of an image by incorporating knowledge of the human visual system while retaining much of the tractability and amenability to analysis. This variation is the class of input weighted quadratic distortion measures of the form dx; x ˆ = x − x ˆ t Bx x − x, ˆ where Bx is a positive definite symmetric matrix which can depend on the input [55, 23, 33, 30, 26]. The Mahalonobis distance of statistics provides a simple example where the weighting matrix does not depend on the specific input, so that one could, for example, choose a separate inverse covariance matrix for different classes of inputs when measuring the distortion. A simple example of input dependence would be to have Bx be the identity times the sample variance of components of the vector x. Thus the distortion would be increased if x has large variability and hence x is an “active” vector. The Lloyd quantizer algorithm described here extends to such distortion measures [34], as does the Bennett asymptotic quantization theory [30, 42] mentioned later in this paper. Since no single weighting matrix is considered the best, and such perceptually based distortion measures have not yet been treated in measuring quality in medical images, we focus on the simple squared error. The distortion resulting from applying a source code α; β to a specific input vector x is dx; βαx: A code α; β will be said to be lossless if βαx = x, for all inputs x ∈ A. For a lossless code, β is the inverse of α. Given that dx; y > 0 if x 6= y, the code is lossless iff dx; βαx ≡ 0, x ∈ A. Lossless codes are also called invertible codes, noiseless codes or entropy codes.
36
S. M. PERLMUTTER ET AL.
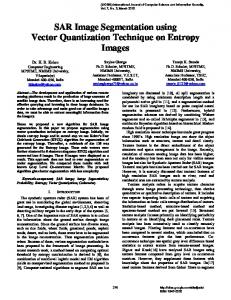
A code that is not lossless is lossy and it is usually called a quantizer. Since the alphabet is in general a k-dimensional vector, the more general notion is a vector quantizer (VQ). The overall mapping Qx A → C defined as the composite Qx = βαx is often referred to as a VQ, and the term is also used somewhat more generally to denote any mapping from a continuous or large discrete space into a smaller space. The smaller space is usually required to be finite, but sometimes it is useful to allow it to be countably infinite. The encoder mapping can also be represented in terms of a Voronoi diagram, which illustrates how the vector space is partitioned. Figure 3 provides an example of a Voronoi diagram for a two-dimensional vector. The mapping rule of the encoder is represented by the boundaries between the Voronoi cell. Each Voronoi cell represents the set of input vectors that mapped to a particular codeword. The codewords are represented by black dots. Lossless codes are an important special case of compression codes. When compressing a computer program or bank statement, for example, it is critically important to make no errors. A single wrong digit could have catastrophic consequences. We argue that in some examples, such as medical and scientific images, lossy compression may be quite useful even though the utility of the images is strongly related to the quality of the reproductions. The “cost” of encoding an input vector x in terms of the memory occupied by the stored channel codeword or the communications channel capacity required for its transmission is taken to be the length of the encoded input vector αx in binary symbols, which we denote by lαx. This quantity is also referred to as the instantaneous rate rx = lαx in bits per input vector. It is convenient to normalize both distortion and rate into units per input symbol by dividing by the dimension k of the input vectors and to report r in terms of bits per input symbol. Obviously the distortion resulting from encoding an input vector depends on the encoder and decoder,
Fig. 3. Voronoi diagram.
while the instantaneous rate depends only on the encoder. The performance of a compression system is measured by the expected values of the distortion and rate. The average distortion corresponding to a specific source code applied to a specific source is denoted Dα; β = EdX; βαX: It is often reported in logarithmic form as a signal to noise ratio SNR = 10 log 10 D0 /D with units decibels (dB); D0 is a reference value and is often the average distortion resulting from the optimum zero rate code. In the case of a squared error distortion measure, D0 is the variance of the components of the input vector. Other normalizations are used, including the noncentral second moment (energy) and the square of the maximum possible input value (yielding what is called a peak SNR (PSNR)). The average rate is defined as Rα = ErX = ElαX in bits per vector. This is usually normalized by dividing by the dimension k, which gives average bits per symbol (or pixel in the case of sampled images). The distribution with respect to which expectations are computed is always determined by context, although in practice it can only be a suitable empirical distribution. Every source code operating on a source will be characterized by a point in the two-dimensional rate–distortion plane: Rα; Dα; β. Both Dα; β and Rα can be considered as cost functions for a source code. All else being equal, one code is better than another if it has smaller D or smaller R than another. Thus if we were to consider a plot of all achievable distortion–rate pairs, the only points of practical interest would be those not dominated by any other points in the sense of having a smaller D (or R) given the same or smaller R (or D). This leads to the definitions of optimal source codes, just as it does to admissibility in statistics. 2.3 Optimal Source Codes 2.3.1 Optimality properties. The goal of source coding is to characterize the optimal trade-off between average bit rate and average distortion and to design codes that compare well to the optimal performance. The optimization problem can be formulated in several ways. The distortion–rate approach constrains the average rate and minimizes the average distortion; the rate–distortion approach constrains the average distortion and minimizes the average rate; and the Lagrangian formulation minimizes a weighted sum of distortion and rate. All formulations are analogous to those that bear upon the construction of statistical tests, in Neyman–Pearson style for the first two and as Bayesian tests for the third. In the first approach
37
MEDICAL IMAGE COMPRESSION
we define the optimal code (if it exists) for a given rate R as the α; β minimizing Dα; β subject to Rα ≤ R. Define the operational distortion–rate function b DR =
inf
α; βx Rα≤R
Dα; β:
b The function DR is obviously monotonically nonincreasing in R. The rate–distortion function is defined by reversing the roles of rate and distortion. The Lagrangian approach incorporates the rate constraint into a modified distortion measure ρ defined between the input vector and the channel codeword by (1)
ρx; i = dx; βi + λli;
for a Lagrange multiplier λ, so that the average modified distortion measure is given by (2)
EρX; αX = Dα; β + λRα:
The constrained minimization of D is equivalent to an unconstrained minimization of Eρ. For every choice of λ the unconstrained minimization will yield a pair D; R in the distortion–rate plane, where D is the operational distortion–rate function evaluated at the rate R (and λ proves to be the negative of the slope of the distortion–rate function at that pair [13]). We focus on the Lagrangian formulation as the more natural for the problem at hand. The case of 0 rate code is of course artificial, but it is useful as a step toward describing optimality properties for the general case. In order to achieve the minimum possible average distortion with a 0 rate codebook having a single word y, a y yielding the minimum average distortion (if such exists) should be chosen as the output of β operating on the empty string \. Thus β\ = arg miny∈Aˆ EdX; y: If the minimum indeed exists, we have (3)
b D0 = min EdX; y: y
The vector achieving this minimum is the centroid of the alphabet A with respect to the distribution PX . If the average distortion is given by the squared error EX − y2 , then this is the expected value EX since, for any y, EX − y2 ≥ EX − EX2 : If the distribution is an empirical distribution described by the training sequence, then this is simply the sample mean or Euclidean centroid L 1 X x : L n=1 n
The zero rate result extends easily to describing the optimal decoder in general for a given encoder.
Given an encoder α, define the encoder partition S = Si y i ∈ W with atoms Si = xx αx = i. Given that αX = i, the best reproduction value y to represent all input vectors in the set Si in the sense of minimizing the average conditional distortion EdX; yX ∈ Si is arg miny∈Aˆ EdX; yX ∈ Si . For the squared error distortion, this is simply the conditional expectation EXX ∈ Si . As in the zero rate case, the optimal decoder output for a given channel codeword is a centroid, but now of an encoder partition cell instead of the entire input space. If PrX ∈ Si = 0, then the decoder can be defined in an arbitrary fashion, say as the centroid of the entire input distribution. This provides a general optimality condition describing the best decoder for a given encoder, a condition originally formulated by Lloyd for scalar (univariate) quantization in 1957 [44]: given an encoder α, the optimal decoder β is given by (4)
βi = arg min EdX; yαX = i y∈Aˆ
for each i. The optimal decoder for any encoder is also defined for any internal nodes in the treestructured representation that will be discussed, permitting a progressive reconstruction as the bits arrive. This condition has a history in both the engineering quantization and the statistical literature. In a similar fashion, one can define an optimal encoder α for a fixed decoder β with respect to the Lagrangian distortion measure. Given β, any encoder α must satisfy the inequality Eρλ X; βαX Z = dPX xdx; βαx + λlαX (5) Z ≥ dPX x mindx; βi + λli: i
This lower bound is achievable by the minimum modified distortion encoder αx = arg mindx; βi + λli: i
Thus, given the reproduction codebook β, the optimal encoder is the minimum distortion encoder with respect to the modified distortion measure. As will be discussed at more length later, it is often useful to place additional constraints on the structure of the codebook in order to simplify the code. Adding constraints to an optimization problem may of course result in a code that is suboptimal for the unconstrained problem, but it may have advantages that are due to simple implementation. The most important example of such a constraint is to
38
S. M. PERLMUTTER ET AL.
require the channel code to have all its binary words be of some fixed lenth R, in which case the channel codebook consists simply of all N = 2R binary Rtuples. In this case the instantaneous rate and the average rate are both given by r = k−1 log 2 N = R/k bits per source symbol, and the code is referred to as a fixed rate code. The primary advantage of fixed rate codes is reduced complexity. Variable rate codes may produce symbols faster or slower than the transmission rate of a digital communication system, which necessitates the use of buffers to handle underflows and overflows. We here focus on variable rate schemes, which are better able to devote more bits to more active input vectors and fewer to background. 2.3.2 The Lloyd algorithm. These optimality properties suggest an iterative design algorithm for compression given an initial encoder–decoder pair. Any given code can be improved (at least made no worse) by successively applying the above two properties. First optimize the reproduction codebook (or decoder) for the given encoder, then optimize the encoder for the given reproduction codebook and channel codebook. There are a wide variety of ways that an initial codebook can be designed. The approach used in this study was to grow it from a 0 rate code. The design procedure is a variation of a 1957 algorithm of Lloyd [44] for the design of optimum pulse coded modulation (PCM) systems or scalar quantizers with fixed rate codebooks (where the channel codebooks are restricted to have all entries of equal length and hence the constraint is on the rate). Lloyd’s method is familiar to statisticians since variations have appeared in several statistical as well as engineering guises. In the scalar case with an empirical distribution, the problem of choosing the best set of N points minimizing a sample variance is the “problem of optimum stratification” of Dalenius [21] in 1950 and Dalenius and Gurney [22] in 1951. The first appearance of the conditions for optimal fixed rate scalar quantization for a general one-dimensional distribution was in 1955 in the work of Lukaszewicz and Steinhaus [47]. Lloyd reported the properties along with a simple proof not requiring differentiability in 1957, and J. Max subsequently rediscovered a similar method in 1960 [52]. The optimal scalar quantization result is often referred to in the engineering literature as a Lloyd–Max quantizer, although it is Lloyd’s method of proof and not Max’s calculus-based minimization that easily generalizes to vectors. Also in 1957 Cox [20] provided the same conditions for “grouping” equivalent to quantization and, like
Lloyd, applied the results to the Gaussian distribution. Unlike Lloyd, Cox explicitly considered the two-dimensional case. Lloyd’s method applied to vectors and multidimensional distributions is essentially equivalent to Forgey’s 1965 algorithm [29] and MacQueen’s kmeans algorithm [49] if the distribution is an empirical distribution. Unlike the original k-means algorithm, however, Lloyd’s algorithm was a “batch” algorithm in that each iteration was on the entire distribution (an empirical distribution if a training set is used) rather than on an incremental update for each training vector. (Subsequent variations of k-means operate in a similar fashion.) The algorithm and its variations are popular for a variety of clustering applications as is seen, for example, in [36]. Lloyd proved the quantizer optimality properties by basic inequalities as above rather than by setting derivatives to zero, and hence no assumptions past the existence of the centroids of sets were required for the algorithm to be well defined. Lloyd’s method was explicitly applied to random vectors in the quantization context by several people, including Chen [11], Hilbert [37], and Linde, Buzo and Gray [43]. The algorithm was extended to the variable rate case by Chou, Lookabaugh and Gray [14]. More recently, in 1990 the method reappeared under the name of “principal points,” distinguished from traditional k-means by the assumption of an absolutely continuous distribution instead of an empirical distribution [28, 70]; these works by Flury alone and with colleagues ignore the quantization literature. It is interesting to note in particular that Flury observes with surprise that the optimal points need not be symmetric about the mean even if the distribution is symmetric, a fact noted in the quantization literature by Abaya and Wise in 1981 [1]. Since distortion is nonnegative and nonincreasing, the algorithm is a descent algorithm. In general the algorithm converges only to a stationary point, and there is no guarantee that the resulting code will be globally optimal. (It is guaranteed to be globally optimal for all codebook sizes if X is univariate and the distribution is absolutely continuous with log concave density [71, 40]. This is equivalent to the distribution being strongly unimodal, that is, for its convolution with every univariate unimodal distribution to be unimodal (see [38]; see also [39]).) 2.3.3 Source coding and quantization theory. The Lloyd algorithm is simply a clustering algorithm, and a wide variety of other clustering algorithms have been used to design vector quantizers. In general there are no guarantees that such algorithms will produce globally optimal codes, and the intent
MEDICAL IMAGE COMPRESSION
is to produce at least a locally optimal and good code. It is natural to inquire if the truly optimal performance can be derived theoretically so that one can have a benchmark for comparison of different codes. There are two approaches to quantifying the optimal performance when the underlying distributions are known, and both were developed primarily at Bell Laboratories in the late 1940s and 1950s. The first is Shannon’s information theory. Shannon showed that a suitably well behaved random process can be described by a distortion–rate function DR which is related to the previously defined operational distortion–rate function as follows. bk R denote the operational For dimension k let D distortion–rate function for vectors of dimension k. Then bk R = lim D bk R = DR; inf D k
k→∞
that is: (1) no codes can ever yield performance lower than Shannon’s distortion rate function and (2) for dimension large enough performance arbitrarily close to the Shannon distortion rate function can be achieved. Shannon’s distortion rate function is defined as an information theoretic minimization and it can be computed for some processes and distortion measures (such as Gaussian processes with a squared error distortion measure) and bounded for others. This result, known as Shannon’s source coding theorem with a fidelity criterion, has the shortcoming that it is not constructive; and it suggests that very large vector dimensions may be needed to approach the optimal performance. It also assumes that one knows the underlying distributions, which is usually not the case in practice. The alternative approach to quantifying the theoretically achievable optimal performance is the approach developed by Bennett [4] for scalar quantization and subsequently extended to vector quantization by others [75–77, 31, 74, 53]. Instead of fixing a bit rate R and letting the dimension k grow, this approach fixes the dimension k and lets the rate (or number of quantization levels) get asymptotically large (or the distortion asymptotically small). This theory has the advantage of applying to a fixed dimension, but requires the assumption of a large rate, which is usually not desirable when data compression is the goal and relatively small rates are desired. As with the Shannon theory, it assumes known distributions. We mention the theories of source coding and quantization only in passing as they do not yield useful performance bounds when coding real images, but both theories have provided useful in-
39
sights into code design and have been much used for benchmarking various approaches to design for common parametric models such as memoryless Gaussian and Laplacian sources. 2.3.4 Tree-structured codes. In practice it is often of interest to optimize over a constrained subset of possible codes rather than over all of them. Unconstrained codes may prove difficult or impossible to implement, and added structure may provide gains in practical simplicity that more than compensate for loss of optimality. All vector quantizers can be considered to have a tree-structured form since any channel codebook is a collection of binary words satisfying the prefix condition, and any such collection can be depicted as a binary tree. The entire input alphabet can be associated with the root node of the tree, from which descend two branches connected to two children nodes. One branch is labeled 0, the other 1, according to the first symbol in the channel codebook. Each of the two children nodes will be associated with all input vectors having channel codewords which begin with the branch label leading to that node. A node will be a terminal node or leaf of the tree if the label of the branch leading into the node is the final symbol in the channel codewords for all of the vectors associated with that node. Otherwise the node has two children, one for each possible next symbol in the channel codeword. Thus the channel codebook corresponds to a binary tree with terminal nodes corresponding to complete channel codewords and internal nodes corresponding to prefixes of channel codewords. The channel codeword can now be interpreted as providing a pathmap through the tree, ending in the terminal node. On arriving at a terminal node, the decoder can produce the optimal reproduction, the centroid of all input vectors which are mapped into that node by the encoder. The tree structure has an immediate benefit: Instead of waiting for the terminal node to be reached before producing a reproduction, the decoder could produce a reproduction at each interim node traversed by the encoder, the centroid of all input vectors which are associated with that interim node. This means that the decoder can reconstruct the input vector in a progressive manner that should provide an increasingly good reproduction as more bits arrive and as the terminal node is achieved. This progressive reconstruction can be very useful in practice as it means one can see an ever improving image as the bits arrive instead of waiting for all of the bits before anything is reconstructed. It also suggests an alternative simple, but suboptimal, means of encoding.
40
S. M. PERLMUTTER ET AL.
The optimal encoder must look at all of the terminal nodes of the tree and find the minimum distortion (or nearest neighbor) in the sense of providing the smallest Lagrangian combination of squared error and channel codeword length (the depth of the terminal node). A simple suboptimal encoder could perform a greedy search of the code tree instead of a full search of all leaves to find the minimum modified distortion. In this case each node is considered to be labeled by its optimal reproduction, and at each node the encoder makes a simple binary decision comparing the distortion resulting from using either of the two available children nodes. Since one bit is added regardless of which node is selected, bits are not explicitly taken into account during encoding. They are taken into account when the tree itself is designed. The decision is therefore simply a minimum squared error selection between two available reproductions for a given input vector. The minimum distortion binary decision is equivalent to a hyperplane test or, in engineering parlance, a correlation or matched filter detector. The channel codeword is thus selected by a sequence of simple binary decisions. Vector reproductions are stored at each node in the tree. The search begins at the root node. The encoder compares the input vector to two possible candidate reproductions, chooses the one with the minimum distortion and advances to the selected node. If the node is not a terminal leaf, the encoder continues and chooses the best available node of the new pair presented. The encoder produces binary symbols to represent its sequence of binary decisions. The stored index is then a path map through the tree to the terminal node, which is associated with the final codeword. For example, if one constrains the code to have only fixed length codewords and there are N = 2kR codewords, then the optimal encoder must compute 2kR distortions in order to select the minimum distortion codeword, while the suboptimal greedy tree search will make only kR binary comparisons. Clearly one no longer will have an optimal encoder for the given code, and it may be that a good code for an optimal search may prove poor for the suboptimal search. Hence it is of concern to design a code that will be good when used specifically with such a suboptimal encoder. A code with this structure of performing a sequence of pairwise nearest neighbor decisions is called a tree-structured VQ (TSVQ). A treestructured quantizer is clearly analogous to a classification or regression tree, such as those designed by the CART algorithm [9]: at each successive node the input vector is “classified” according to the binary nearest neighbor selection of the centroids of
Fig. 4. Simple TSVQ example.
the two available children nodes. The quantizer can also be viewed as a classical nearest neighbor classifier, where the nearest neighbor in a collection (here the reproduction codebook and not the entire training set) is only approximated by a sequence of pairwise nearest neighbor selections. The squared error distortion function of TSVQ becomes Bayes risk in a classification tree, and the cost might be the number of leaves or the total number of nodes in the channel codebook in a classification problem. The Euclidean minimum distortion binary decision rule in a TSVQ typically becomes a one-dimensional threshold rule on a single vector coordinate in CART, although one can make the decisions multidimensional by first transforming the input vector, or by allowing more general hyperplane splits. The fact that TSVQ and CART can be viewed as variations of each other suggests that the CART tree design methodology can be combined with the Lloyd algorithm in order to design a TSVQ, which is the approach that is adopted here. As a simple example of a TSVQ, consider the labeled tree of Figure 4. This tree will be used to represent the data in an image that is divided into 2×2 blocks. Each node is labeled by the reproduction vector used to represent any data coded to that node. Suppose that this tree is used to encode the image of Figure 5, with intensities from an alphabet of size 8, or 3 bits per pixel (bpp). The encoder operates by successively encoding 2 × 2 blocks taken from the “image,” and the decoder then reconstructs the image using the reproduction codewords indexed by the channel codeword. If only the root node is used for a zero rate code, then the average squared error resulting will be D0 = 7:53. If the nearest neighbor from the two codewords labeling the first level nodes
Fig. 5. Example image.
MEDICAL IMAGE COMPRESSION
is chosen for each input vector (or a simpler hyperplane or correlation test is used to accomplish the same goal), then the rate is one bit per input vector (1/4 bpp); and the resulting average squared error is D = 4:19, yielding SNR = 10 log 10 D0 /D = 2:55 dB. If the complete tree is used so that the left node in the first level is split and each image vector reaching this node is further encoded by choosing the nearest neighbor label from the children nodes, then the distortion drops to 2.81 and the SNR rises to 4.3 dB, but the cost is an increase in the average bit rate to 1.5 bpp. 2.4 TSVQ Design Tree-structured vector quantizers, like classification trees, can be designed from scratch by means of a gardening metaphor. The trees are first grown from a root node by successively splitting nodes and running a Lloyd algorithm on the new leaf set, which now becomes a two-means design. As growing may overfit the data, the resulting tree can then be pruned so as to optimally trade off average distortion and rate. This trading of average distortion and average bit rate is simply a variation on the design strategy for classification and regression trees [9] embodied in the CART algorithm. The simplest growing technique is to split every leaf simultaneously to form a new tree. In particular, the root node is split and the Lloyd algorithm run to produce a one-bit tree. Then both nodes are split and the Lloyd algorithm run to produce a two-bit tree with four leaves. The Lloyd algorithm is modified in that it is really two clustering algorithms with two codewords each rather than a single clustering algorithm with four words. Each Lloyd algorithm is run for the conditional distributions of each parent node. Continuing in this way will yield a balanced tree and fixed-rate code. Alternatively, nodes can be split individually and selectively. For example, every leaf in a code tree has some conditional average distortion, say Dn, which is the average distortion resulting when the input vectors coded to this node are encoded to the centroid of the node. If this node is split and the Lloyd algorithm run on the conditional node distribution, then the two children nodes, n0 and n1 , will have conditional distortions Dn0 and Dn1 with probabilities p0 and p1 = 1 − p0 , respectively. This will result in a new conditional distortion for input vectors reaching node n of (6)
p0 Dn0 + p1 Dn1 ≤ Dny
that is, the average distortion drops due to the node split. On the other hand, all vectors reaching node n will now have an additional bit added to their
41
path map so that the average rate will increase. Thus one strategy for splitting is to split the node that results in the greatest drop in average conditional distortion per average additional bit. This is the most common growing strategy, but it is by no means the only one. For example, one could split the node with the largest contribution to the overall average distortion. Once grown, the tree can be pruned by removing all descendents of any internal node, thereby making it a leaf. This will increase average distortion, but will also decrease the rate. Once again, one can select for pruning the node that offers the best trade-off in terms of the least increase in distortion per decrease in bits. It can be shown that, for quite general measures of distortion, pruning can be done in optimal fashion and the optimal subtrees of decreasing rate are nested. 2.4.1 Predictive vector quantization (PVQ). One method for incorporating memory or context into coding is to predict the current vector based on its neighbors and then quantize the prediction residual [32]. Predictive vector quantization (PVQ) is a straightforward vector extension of traditional scalar predictive coding [25]. The basic encoder and decoder structures are shown in Figure 6. The en˜ n of the incoming vector coder makes a prediction X bn . The Xn based on previously encoded vectors X difference between the actual input vector and its prediction is called the residual vector en . This residual is vector quantized (eˆn ). Because the encoder only uses the previously decoded outputs in making its prediction, the decoder is able to make the same prediction. After dequantizing the residual vector, the decoder adds the prediction to it bn . The predicto form the reproduction vector X tion is often a simple linear predictor that takes a weighted average of nearby previously encoded coefficients. In predictive TSVQ, the residual quantizer is a TSVQ. For each residual vector, the encoding path through the tree is sent to the decoder. Given the same tree, the decoder decodes the quantized residual and reconstructs the pixel block by adding it to its prediction of the block. The selection of vector dimension or block size is important in predictive TSVQ. For the predictor, a larger block size results in a more tenuous prediction since pixels being predicted are farther apart from pixels used in the prediction. For the residual quantizer, on the other hand, larger pixel blocks better exploit Shannon’s theory on the ability of vector quantizers to asymptotically outperform scalar quantizers. The block size choice is a trade-off among prediction accu-
42
S. M. PERLMUTTER ET AL.
Fig. 6. Encoder and decoder for a predictive vector quantizer.
racy, algorithmic complexity, storage memory and quantization performance. While performance theoretically improves with block size, large block sizes can introduce block artifacts into an image that can outweigh any improvement in quantitative performance. Here we have chosen the block size with an emphasis on achieving low complexity. The coefficients for the predictor have in the past been calculated by Wiener–Hopf techniques; that is, one finds the best linear unbiased estimator for predicting one pixel block from its neighbors, assuming that the neighbors are known perfectly. This is simplistic since the prediction coefficients will in practice be applied to the quantized neighbors and not to the true neighbors. The method is simple, however, and has worked reasonably well experimentally. From the training set, the correlation matrix between the current block and its neighbors is estimated and inverted to obtain the prediction coefficients. These coefficients are thus based upon correlations between original pixel values and neighboring original pixel values. During compression, however, the prediction coefficients are used with encoded values of adjacent previously encoded blocks rather than with original pixel values. Once the prediction coefficients are fixed, a training sequence of residuals is generated from the training sequence of original pixel values by calculating the differences between actual values and predicted values. The tree-structured encoder is developed using these residual vectors as a training set. By encoding the lower energy residual signal, fewer bits can be used to encode to a desired distortion level than would be needed for encoding the original higher energy signal. An advantage of predictive TSVQ is that explicit entropy coding is not needed because the code is designed directly to minimize average bit rate. Additional compression could be achieved by not using the natural tree-structured code representation and instead designing an optimal entropy code for the final code indices. If this is to be done, then better performance could be achieved by designing the
original TSVQ to minimize average entropy instead of average length. An additional advantage is the natural progressive character of the code: on the average distortion diminishes with additional bits of the path map. Recent work has shown that the Wiener–Hopf technique can be improved upon in some applications by a variation of ridge regression [59, 2]. However, one should not lose track of the fact that the goal is good ultimate codes rather than good prediction for its own sake. One can imagine prediction that is dreadful in an MSE sense, but that makes for trivial encoding of residuals. In statistical terms, bias is not the issue here. Instead, it is the simplicity of the range of the predictor. 3. STUDY DESIGN We turn now to the particular clinical experiment we conducted and that was described to some extent earlier. To develop a tree-structured residual encoder and decoder, 20 MR chest scans were picked to be the training set; they included a wide range of normal and aneurysmal vessels. An additional 30 scans were chosen as test images. All images were obtained using a 1.5-T whole body imager (Signa, GE Medical Systems, Milwaukee, Wisconsin), a body coil and an axial cardiac gated T1 weighted spin echo pulse sequence with the following parameters: cardiac gating with repetition time (TR) of 1 R–R interval; echo time (TE) of 15–20 msec; respiratory compensation, number of repetition (NEX) of 2; 256 × 192 matrix; slice thickness of 7 mm with a 3-mm interslice gap. To simulate normal clinical practice, test images were selected from 30 sequential thoracic MR examinations of diagnostic quality that were obtained after February 1, 1991. The patients studied included 16 females and 14 males, with ages ranging from 1 to 93 years and an average age of 48:0 ± 24:7 years mean ± s.d.. Clinical indications for the thoracic scans included suspected
43
MEDICAL IMAGE COMPRESSION
aortic aneurysm (11), thoracic tumors (11), evaluation of patients before or after lung transplant (5), constrictive pericarditis (1) and subclavian artery rupture (1). From each examination, one image which best demonstrated all four major vessels of interest was selected. The training images were selected similarly from different examinations. All analyses are based solely on measurements made on the test images. In our study, the 256 × 256 pixel MR scans were broken into 2 × 4 pixel blocks for encoding and decoding. The coefficients for the Wiener–Hopf linear predictor were calculated from the training set images and used to produce a residual (prediction error) training set. Using predictive TSVQ, a residual tree was grown to 2.25 bpp and pruned back to a set of optimally pruned subtrees representing bit rates from 0–2.25 bpp. Five subtrees were chosen to produce average bit rates of 0.36, 0.55, 0.82, 1.14 and 1.70 bpp on the 30 test images and to have no overlap between the bit rates of the image set encoded with two different subtrees. These subtrees and their average bit rates are termed compression levels 1–5. The original scans at 9.0 bpp are termed level 6. The 30 test scans compressed to 5 bit rates plus the originals give rise to a total of 180 images. These images were arranged in a randomized sequence and presented on separate hard-copy films to three Stanford radiologists. The viewing protocol consisted of three sessions held at least two weeks apart. Each session included 10 films viewed in a predetermined order with six scans on each film. The radiologists began viewing films at different starting points in the randomized sequence. To minimize the probability of remembering measurements from past images, a radiologist saw only two of the six levels of each image in each session, with the second level of each image spaced at least four films after the first. Following standard clinical methods for detecting aneurysms, the radiologists used calipers and a millimeter scale available on each image to measure the four blood vessels appearing on each scan. Although the use of digital calipers might have allowed more accurate measurements, this would have violated one of our principal goals, namely, to follow as closely as possible actual clinical practice. It is the standard practice of almost all radiologists to measure with manual calipers. This is especially true for radiologists in private practice, who represent more than 90% of the radiologist population in the United States. Even in a tertiary referral setting, manual calipers are used routinely. We asked radiologists to make all measurements between the outer walls of the vessels along the axis of maximum diameter. It is this maximum diam-
eter measurement that is used to make clinical decisions. If measurements were made only in the straight anterior–posterior direction or the orthogonal transverse direction, it would not be possible to determine whether compression has an impact on clinical decisions. Both the measurements and axes were marked on the film with a grease pencil. A subjective score of 1 (worst) through 5 (best) was also assigned to each image based on the radiologist’s opinion of the quality of that image for the measurement task. The subjective scores were used purely as a measure of subjective quality and not as a measure of diagnostic accuracy. Relationships among subjective score, SNR and diagnostic accuracy are further elaborated in [17] and [15]. 4. UNIVARIATE ANALYSES 4.1 Measurement Standards and Error Parameters In order to quantify the accuracy of measurements at each level of compression, we set two “gold standards” to represent the “correct measurement” for each vessel. One gold standard was set by having two expert radiologists, not the judges, come to an agreement on vessel sizes on the uncompressed scans. This provides an “independent standard.” The two radiologists first independently measured the vessels on each scan. For those vessels on which they differed, they remeasured until an agreement was reached. The average measurement of the gold standard judges, pooled across structures, was 20.44 mm with standard deviation 5.86 mm. We lack data on what any separate initial measurements may have been. Test judges had averages that varied across levels from averages of about 20 mm to about 27 mm. Standard deviations ranged from about 5 mm to about 6 mm. A “personal standard” was also derived for each judge by taking their own measurements on the uncompressed image to be the gold standard for corresponding measurements on the compressed scans. Comparison with the personal gold standard quantifies individual consistency, or lack of it, over bit rates rather than performance relative to “absolute truth.” Once the gold standard measurement for each vessel in each image was assigned, the analysis of a radiologist’s performance was made by comparing the errors made on compressed and on uncompressed images. The measurement error can be quantified in a variety of ways. If z is the radiologist’s measurement and g represents the gold standard measurement, then some potential error parameters are z − g, logz/g, z − g/g and z − g/g. These parameters have obvious invari-
44
S. M. PERLMUTTER ET AL.
ance properties that bear upon understanding the data. For simplicity and appropriateness in the statistical tests carried out, the error parameters chosen for this study are percentage measurement error z − g/g × 100% and absolute percentage measurement error z − g/g × 100%, both of which scale the error by the gold standard measurement to give a concept of error relative to the size of the vessel being measured. 4.2 Parameters and Tests The differences in error achieved at each bit rate for our paired data could be quantified in many ways. We use both the t and Wilcoxon signed rank tests. The measurements are paired in a comparison of two bit rates since the same vessel in the same image is measured by each radiologist at both bit rates. We also accounted for the multiplicity of comparisons. If x1 is the measurement of a vessel at bit rate 1, x2 its measurement at bit rate 2 and g the vessel’s gold standard measurement, then the percentage measurement errors at bit rates 1 and 2 are x1 − g/g × 100% and x2 − g/g × 100%, and their difference is x1 − x2 /g × 100%. In such a two-level comparison, percentage measurement error more accurately preserves the difference between two errors than does absolute percentage measurement error. A vessel that is overmeasured by α% (positive) on bit rate 1 and under-measured by α% (negative) on bit rate 2 will have an error distance of 2α% if percentage measurement error is used but a distance of zero if absolute percentage measurement is used. Therefore both the t-test and the Wilcoxon signed rank test were computed using only percentage measurement error. Absolute percentage measurement error is used to present a more accurate picture of average error across the 30 test images plotted against bit rate. The size of our data set 4 vessels × 30 images × 6 levels × 3 judges = 2,160 data points makes a formal test for normality nearly irrelevant since Gaussian approximations to sampling distributions are quite adequate for our purposes; Q–Q plots of percentage measurement error differences that were made for comparisons of other levels exhibit varying degrees of linearity. In general, the Q–Q plots indicate a moderate fit to a Gaussian model.
Fig. 7. Signal-to-noise ratio as a function of bit rate: the ×’s indicate data points for all images, pooled across judges and compression levels; the solid curve is a quadratic spline fitted to the data with a single knot at 1:0 bpp.
general trend. Generally, images with lower visual distortion have higher SNR. 5.2 Results Using the Independent Gold Standard Figures 8–11 are plots of trends in measurement error as a function of bit rate. In all cases, the general trend of the data is indicated by fitting the data points with a quadratic spline having one knot at 1.0 bpp. The “◦” symbols indicate the 95% con-
5. RESULTS 5.1 Distortion–Rate Performance Figure 7 shows SNR (10 log 10 D0 /D) versus bit rate for the 30 test images compressed to the five bit rates. A quadratic spline with a single knot at 1.0 bpp was fitted through the data points to show the
Fig. 8. Mean percentage measurement error versus mean bit rate using the independent gold standard: the dash–dotted, dotted and dashed curves are quadratic splines fitted to the data points for Judges 1; 2 and 3; respectively; the solid curve is a quadratic spline fitted to the data points for all judges pooled. The splines have a single knot at 1:0 bpp; 95% BCa confidence intervals [24] are displayed separately for each judge and bit rate.
MEDICAL IMAGE COMPRESSION
Fig. 9. Percentage measurement error versus actual bit rate using the independent gold standard: the ×’s indicate data points for all images, pooled across judges and compression levels; the solid curve is a quadratic spline fitted to the data with a single knot at 1:0 bpp.
Fig. 10. Mean absolute percentage measurement error versus mean bit rate using the independent gold standard: the dash– dotted, dotted and dashed curves are quadratic splines fitted to the data points for Judges 1; 2 and 3; respectively; the solid curve is a quadratic spline fitted to the data points for all judges pooled. The splines have a single knot at 1:0 bpp; 95% BCa confidence intervals are displayed separately for each judge and bit rate.
fidence intervals obtained from the bootstrap BCa method [24]. Our approach here has been to apply this bias-adjusted, accelerated percentile method to data that come from the spline fits at fixed bit rates. Images were the sampling units in all computations. Figure 8 is a plot of the average percentage measurement error against the mean bit rate for all radiologists pooled (i.e., the data for all radiologists,
45
Fig. 11. Absolute percentage measurement error versus actual bit rate using the independent gold standard: the ×’s indicate data points for all images, pooled across judges and compresssion levels; the solid curve is a quadratic spline fitted to the data with a single knot at 1:0 bpp.
images, levels and structures, with each radiologist’s measurements compared to the independent gold standard) and for each of the three radiologists separately. In Figure 9, the percentage measurement error versus actual achieved bit rate is plotted for all data points. The relatively flat curve begins to increase slightly at the lowest bit rates, levels 1 and 2 (0.36, 0.55 bpp). It is apparent that, except for measurement at the lowest bit rates, accuracy does not vary greatly with lossy compression. Possibly significant increases in error appear only at the lowest bit rates, whereas at the remaining bit rates measurement accuracy is similar to that obtained with the originals. The average performance on images compressed to level 5 (1.7 bpp) is actually better than performance on originals. While the trends in percentage measurement error versus bit rate are useful, overmeasurement (positive error) can cancel undermeasurement (negative error) when these errors are being averaged or fitted with a spline. For this reason, we turn to absolute percentage measurement error, which measures the error made by a radiologist regardless of sign. Figure 10 is a plot of average absolute percentage measurement error versus average bit rate for each radiologist and for all radiologists pooled. Figure 11 shows actual absolute percentage measurement error versus actual bit rate achieved. These plots show trends similar to those already seen. The original level has about the same absolute percentage measurement error as compression levels 3, 4 and 5 (0:82; 1:14; 1:7 bpp). Levels 1 and 2
46
S. M. PERLMUTTER ET AL.
(0:36; 0:55 bpp) show slightly higher measurement error. The t-test was used to test the null hypothesis that the “true” percentage measurement error between two bit rates is zero. None of the levels down to the lowest bit rate of 0.36 bpp was found to have a significantly higher percentage measurement error (at the 5% significance level) when compared to the error of measurements made on the originals. Among the compressed levels, however, level 1 (0.36 bpp) was found to be significantly different from level 5 (1.7 bpp). As was mentioned, the performance on level 5 was better than that on all levels, including the uncompressed level. When using the Wilcoxon signed rank test to compare compressed images against the originals, only level 1 (0.36 bpp) differed significantly (at the 5% significance level) in the distribution of percentage measurement error. Within the levels representing the compressed images, levels 1, 3 and 4 (0:36; 0:82; 1:14 bpp) had significantly different percentage measurement errors than those at level 5 (1.7 bpp). Since measurement accuracy is determined from the differences with respect to the originals only, a conservative view of the results of the analyses using the independent gold standard is that measurement accuracy is retained down to 0.55 bpp (level 2).
Fig. 12. Mean percentage measurement error versus mean bit rate using the personal gold standard: the dash–dotted curve is a quadratic spline fitted to the data points for Judge 1; the solid curve is a quadratic spline fitted to the data points for all judges pooled. The splines have a single knot at 1:0 bpp; 95% BCa confidence intervals are displayed separately for each bit rate for Judge 1.
5.3 Results Using the Personal Gold Standard As previously described, the personal gold standard was set by taking a radiologist’s recorded vessel size on the uncompressed image to be the correct measurement for judging performance on the compressed images. Using a personal gold standard in general accounts for a measurement bias attributed to an individual radiologist, thereby providing a more consistent result among the measurements of each judge at the different compression levels. The personal gold standard thus eliminates the interobserver variability present with the independent gold standard. However, it does not allow us to compare performance at compressed bit rates to performance at the original bit rates since the standard is determined from the original bit rates. As before, we first consider visual trends. Figure 12 shows the average percentage measurement error versus mean bit rate for the five compressed levels for Judge 1 and for the judges pooled. Figure 13 shows the corresponding information for Judges 2 and 3. Figure 14 is a display of the actual percentage measurement error versus actual achieved bit rate for all the data points. The data for the judges pooled are the measurements from all
Fig. 13. Mean percentage measurement error versus mean bit rate using the personal gold standard: the dotted and dashed curves are quadratic splines fitted to the data points for Judges 2 and 3; respectively. The splines have a single knot at 1:0 bpp; 95% BCa confidence intervals are displayed separately for each judge and bit rate.
judges, images, levels and vessels, with each judge’s measurements compared to her or his personal gold standard. In each case, quadratic splines with a single knot at 1.0 bpp were fitted to the data. Figures 15, 16 and 17 are the corresponding figures for the absolute percentage measurement error. As expected, with the personal gold standard, the errors
MEDICAL IMAGE COMPRESSION
Fig. 14. Percentage measurement error versus actual bit rate using the personal gold standard: the ×’s indicate data points for all images, pooled across judges and compression levels; the solid curve is a quadratic spline fitted to the data with a single knot at 1:0 bpp.
Fig. 15. Mean absolute percentage measurement error versus mean bit rate using the personal gold standard: the dash–dotted curve is a quadratic spline fitted to the data points for Judge 1; the solid curve is a quadratic spline fitted to the data points for all judges pooled. The splines have a single knot at 1:0 bpp; 95% BCa confidence intervals are displayed separately for each bit rate for Judge 1.
are less than those obtained with the independent gold standard. The graphs indicate that, whereas both Judges 2 and 3 overmeasured at all bit rates with respect to the independent gold standard, only Judge 3 consistently overmeasured with respect to the personal gold standard. The t-test results indicate that levels 1 (0.36 bpp) and 4 (1.14 bpp) have significantly different percentage measurement error associated with them.
47
Fig. 16. Mean absolute percentage measurement error versus mean bit rate using the personal gold standard: the dotted and dashed curves are quadratic splines fitted to the data points for Judges 2 and 3; respectively. The splines have a single knot at 1:0 bpp; 95% BCa confidence intervals are displayed separately for each judge and bit rate. The “◦” symbols and solid bars correspond to the confidence intervals for Judge 2; the “×” symbols and dotted bars correspond to the confidence intervals of Judge 3.
Fig. 17. Absolute percentage measurement error versus actual bit rate using the personal gold standard: the ×’s indicate data points for all images, pooled across judges and compresssion levels; the solid curve is a quadratic spline fitted to the data with a single knot at 1:0 bpp.
The results of the Wilcoxon signed rank test on percentage measurement error using the personal gold standard are similar to those obtained with the independent gold standard. In particular, only level 1 at 0.36 bpp differed significantly from the originals. Furthermore, levels 1, 3 and 4 were significantly different from level 5.
48
S. M. PERLMUTTER ET AL.
With Bonferroni considerations, the percentage measurement error at level 4 (1.14 bpp) is not significantly different from the uncompressed level. The simultaneous test indicates that only level 1 (0.36 bpp) has significantly different percentage measurement error from the uncompressed level. This agrees with the corresponding result using the independent gold standard. Thus, percentage measurement error at compression levels down to 0.55 bpp does not seem to differ significantly from the error at the 9.0 bpp original. 5.4 Subjective Score In the previous sections, we looked at how measurement performance changes with bit rate in terms of the distribution of percentage measurement error. In addition to characterizing such objective aspects of error, we would like to examine the effect of compression on subjective opinions. In particular, does a radiologist’s perception of image quality change with bit rate, and does it change in a manner similar to the way percentage measurement error changes? At the time of measurement, radiologists were asked to assign subjective scores of 1 (worst) through 5 (best) to each image based on “its usefulness for the measurement task.” The term “usefulness” was defined as “your opinion of whether the edges used for measurements were blurry or distorted, and your confidence concerning the measurement you took.” The question was phrased in this way because our concern is whether measurement accuracy is in fact maintained even when the radiologist perceives the image quality as degraded. We do not know whether radiologists are inculcated during their training to assess quality visually based on the entire image, or whether they rapidly focus on the medically relevant areas of the image. Indeed, one might reasonably expect that radiologists would differ on this point, and a question that addressed overall subjective quality would therefore produce a variety of interpretations from the judges. By focusing the question on the specific measurement and the radiologists’ confidence in it, regardless of what portion of the image contributed to that confidence level, we hoped to obtain data relevant to the question of whether radiologists can be asked to trust their diagnoses made on processed images in which they may lack full confidence. Figures 18 and 19 show the general trend of mean subjective score versus mean bit rate. A spline-like function that is quadratic from 0 to 2.0 bpp and linear from 2.0 to 9.0 bpp was fitted to the data. The splines have knots at 0.6, 1.2 and 2.0 bpp; 95% confidence intervals are obtained from the bootstrapped
Fig. 18. Mean subjective score versus mean bit rate: the dash– dotted curve is a spline fitted to the data points for Judge 1; the solid curve is a spline fitted to the data points for all judges pooled; the “◦” symbols represent the 95% BCa confidence intervals for Judge 1.
Fig. 19. Mean subjective score versus mean bit rate: the dotted and dashed curves are splines fitted to the data points for Judges 2 and 3; respectively; the “◦” symbols and solid bars represent the 95% BCa confidence intervals for Judge 2; the “×” symbols and dotted bars represent the corresponding confidence intervals for Judge 3.
BCa method. Figure 20 shows a spline fit of subjective score plotted against actual bit rate for the compressed levels only. The general conclusion from the plots is that the subjective scores at level 5 (1.7 bpp) and level 6 (9 bpp) were quite close (with level 6 slightly higher) but at lower levels there was a steep drop-off of scores with decreasing bit rate. The Wilcoxon signed rank test shows that the subjective scores at all of the five compression levels
MEDICAL IMAGE COMPRESSION
Fig. 20. Subjective score versus bit rate: the ×’s indicate data points for all images, pooled across judges and compression levels; the solid curve is a quadratic spline fitted to the data with a single knot at 1:0 bpp.
differ significantly from the subjective scores of the originals at p < 0:05 for a two-tailed test. The subjective scores at all the compression levels also differ significantly from each other. Although the subjective impressions of the radiologists were that the accuracy of measurement tasks degraded rapidly with decreasing bit rate, their actual measurement performance on the images as shown by both the t-test and Wilcoxon signed rank test (or the Bonferroni simultaneous test) remained consistently high down to 0.55 bpp. It is evident (and hardly surprising) that analyses not reported here indicate radiologist performance tends to be slightly better on images they like better. Thus, their subjective opinion of an image’s usefulness for diagnosis was not a good predictor of measurement accuracy. 6. ANALYSIS OF VARIABILITY Most analyses presented thus far were based on data for which judges, vessels, and images were pooled. Other analyses in which the performances of judges on particular vessels and images are separated demonstrate additional variability. Judges seem to have performed significantly differently from each other. Judges 2 and 3 consistently overmeasured. As a result, the Wilcoxon signed rank test using the independent gold standard indicates significant differences between the gold standard and the measurements of Judges 2 and 3 at all compression levels, including the original. Judge 1, however, does not have any significant performance differences between the gold standard and any compression levels. In addition, certain vessels
49
and images had greater variability in percentage measurement error than others. We turn now to matters of describing variabilities we cite. Whether compression degrades clinical performance is of fundamental importance to policy. We believe that at least within broad ranges it does not. However, this is not to obscure the finding that radiologists themselves are different. They are different in the impact compression has on their performance. They are different in how they measure vessels, on compressed or original images. And they differ in how compression may degrade their performance for different vessels, to the extent that it does. The outcome here is percentage measurement error relative to an independent gold standard. One approach to this analysis might have been a (necessarily complex) random or mixed effects analysis of variance. Inferences therefrom tend to be heavily dependent upon Gaussian assumptions, and even when they hold, distributions of some relevant statistics have been computed only approximately. A bootstrap approach would be unnecessarily complicated. In fact, the “signals” in our data are simple to describe and can be summarized well with a far simpler approach. Thus, we fix (judge, image) pairs, of which there are 90 in all, and analyze them by fixed effects two-way analyses of variance with one observation per cell in which there are two fixed effects: levels and structures. Although we are not ordinarily entitled from such data to make inferences on interactions, we compute Tukey’s one degree of freedom for nonadditivity [72, 65]. If yij is the percentage measurement error, i refers to levels and j to structures, then we model yij = µ+αi +βj +γij +εij , where εij are taken to be iid mean 0 and constant variance, although not constant across judges or images; i = 1; : : : ; 6; j = 1; : : : ; 4. We assume the usual constraints, that is, i αi ≡ j βj ≡ i γij ≡ j γij ≡ 0, and further that γij = Gαi βj for some constant G. Gaussian assumptions on the εij are not in force here, for we view the F-statistics and residual mean squares as descriptive statistics that are summarized by the box plots of Figures 21–24. Details of the computations are given in [65, Section 4.8]. The box plots are self-explanatory—and dramatic! Clearly Judge 2 was affected by compression more than was Judge 3, who was affected more than was Judge 1, whose F-statistics surround the null value 1. Variability obviously increased by judge as the impact of compression increased. Structures differed less for Judge 1 than for the others, and variability was less, too. The influence of structure upon variability in level was less for
50
S. M. PERLMUTTER ET AL.
Fig. 21. Box plots of F for levels.
Fig. 23. Box plots of F for interactions.
Fig. 22. Box plots of F for structures. Fig. 24. Box plots of F for residual mean squares.
Judge 1 than for the others, yet residual variability was less for Judge 2 than for Judge 1, and was highest for Judge 3. Although we are reluctant to infer much by way of performance from our study, it does appear that Judge 1 fared better than did the others of our capable judges. 7. DISCUSSION There are a number of issues to consider in order to determine which gold standard is preferable. One disadvantage of an independent gold standard is that since it is determined by the measurements of radiologists who do not judge the compressed images, significant differences between a compressed level and the originals may be due to differences between judges. For example, a judge who tends to overmeasure at all bit rates may have high percentage measurement errors that are not entirely reflective of the effects of compression. In our study,
we determined that two judges consistently overmeasured relative to the independent gold standard. This is not an issue with the personal gold standard. A personal gold standard also has the advantage of reducing percentage and absolute percentage measurement error at the compressed levels, one result being a clarification of trends in a judge’s performance across different compression levels. Differences are based solely on compression level and not on differences between judges. One disadvantage with the personal gold standard, however, is that by defining the measurements on the original images to be “correct” we are not accounting for the inherent variability of a judge’s measurement on an uncompressed image. For example, if a judge makes an inaccurate measurement on the original and accurate measurements on the compressed images, these correct measurements
51
MEDICAL IMAGE COMPRESSION
will be interpreted as incorrect. Thus the method is biased against compression. An independent gold standard reduces the possibility of this situation occurring since we need an agreement by two independent radiologists on the “correct” measurement. 8. CONCLUSIONS Evaluating the quality of images is an important and expanding area of research. In recent years considerable attention has been given to the use of perceptually based computational metrics for evaluating quality of compressed images [27, 3]. However, human observer studies such as the one reported here remain the method of choice for many applications. The development of international standards for still-image and video compression relies on human observer studies to determine quality [58]. Similarly, the development and validation of methods for comparing medical images also rely on studies of human observers to examine diagnostic utility because the relationship between computational metrics for quality, even sophisticated ones based on properties of the human visual system, and diagnostic accuracy remains elusive. Most human observer studies have focused on subjective quality and on the objective detection of tumors, for example. We believe that, in the future, studies will involve more diverse and clinically representative tasks including measurement of the sizes of vessels and the fundamental issue of managing patients. The highly litigious nature of American society has caused many people to question whether lossy compression can ever be used here in a medical context, despite encouraging results regarding the maintenance of diagnostic accuracy. These doubts are heard less frequently today. The distortion–rate performance of algorithms for compression has improved enormously over the past decade. The quantity of medical images to be handled by picture archiving systems has increased greatly, outstripping gains in the capabilities of storage media. Thus the gains to be had from compression are now more important than they were previously. Possible areas of application for compression of medical images have proliferated. They include wireless emergency medical services, battlefield and shipboard surgery and medicine, progressive browsing of databases, medical teaching archives and others. Today, full-field digital mammography is poised to emerge as an important new technology within the medical imaging industry. The United States Food and Drug Administration has been in the position of defining the protocols that will be used to test the hypothesis that the new digital technology is not
worse in clinical practice than conventional filmscreen analog mammography. These protocols could equally well be used to test the hypothesis that compressed digital mammograms are not worse than conventional analog mammograms. Medical image compression today is thus at an unusually important juncture, with the emergence of a major new digital imaging modality occurring at a time when the techniques for digital image compression are mature and used widely in other fields. The goal of this paper was to quantify the effects of lossy compression on measurement accuracy. The fundamental ideas of lossy signal compression were thus presented and the particular algorithm used, predictive tree-structured vector quantization, was described in detail. The task chosen was the measurement of the diameters of four principle blood vessels in the chest, and both independent and personal gold standards were established. With both the t-test and the Wilcoxon signed rank test, the percentage measurement error at compression rates down to 0.55 bpp did not differ significantly from the percentage measurement error at the 9.0-bpp original. We thus conclude that compression with predictive TSVQ is not a cause of significant measurement error at bit rates ranging from 9.0 bpp down to 0.55 bpp. ACKNOWLEDGMENTS We gratefully acknowledge the assistance of Charles H. McDonnell III, M.D., and D. V. Paranjpe, M.D., in judging the images; Jorg Debatin, M.D., and Herbert Wegmuller, M.D., for establishing the independent gold standard; and H. Christian Davidson, M.D., in filming the images. We also acknowledge useful discussions with Adam Olshen, Jonathan Buckheit and Keren Perlmutter and many helpful comments from the anonymous reviewers and an Associate Editor. This work was supported by NIH Grants CA49697-02, 5 RO1 CA55325 and 5 RO1 CA5903920, by NSF Grants DMS-91-01528, MIP-931190 and CDA-9405058. REFERENCES [1] Abaya, E. and Wise, G. L. (1981). Some notes on optimal quantization. In Proceedings of the International Conference on Communications 2 30.7.1–30.7.5. IEEE Press, Piscataway, NJ. [2] Adams, C. N. (1998). Ph.D. dissertation, Dept. Electrical Engineering, Stanford Univ. [3] Ahumada, A. J., Jr. (1993). Computational image-quality metrics: a review. SID ’93 Digest of Technical Papers 305– 308.
52
S. M. PERLMUTTER ET AL.
[4] Bennett, W. R. (1948). Spectra of quantized signals. Bell Systems Technical Journal 27 446–472. [5] Boncelet, C., Cobbs, J. and Moser, A. (1988). Error free compression of medical x-ray images. In Proc. SPIE Visual Communications and Image Processing 269–276. International Society of Optical Engineers. [6] Bramble, J. (1989). Comparison of information-preserving and information-losing data-compression algorithms for CT images. Radiology 170 453–455. [7] Bramble, J., Cook, L., Murphey, M., Martin, N., Anderson, W. and Hensley, K. (1989). Image data compression in magnification hand radiographs. Radiology 170 133– 136. [8] Brandenburg, R., Fuster, V., Giuliani, E. and McGoon, D. (1987). Cardiology: Fundamentals and Practice. Year Book Medical, Chicago. [9] Breiman, L., Friedman, J. H., Olshen, R. A. and Stone, C. J. (1984). Classification and Regression Trees. Wadsworth, Belmont, CA. [10] Budrikus, Z. L. (1972). Visual fidelity criteria and modeling. Proceedings of the IEEE 60 771–779. [11] Chen, D. T. S. (1977). On two or more dimensional optimum quantizers. In Proceedings of the International Conference on Acoustics, Speech, and Signal Processing 640– 643. IEEE Press, Piscataway, NJ. [12] Chou, P. A., Lookabaugh, T. and Gray, R. M. (1989). Optimal pruning with applications to tree-structured source coding and modeling. IEEE Trans. Inform. Theory 35 299–315. [13] Chou, P. A., Lookabaugh, T. and Gray, R. M. (1989). Entropy-constrained vector quantization. IEEE Transactions Acoustics, Speech, and Signal Processing 37 31–42. [14] Chou, P. A., Lookabaugh, T. and Gray, R. M. (1989). Entropy-constrained vector quantization. IEEE Transactions on Acoustics, Speech, and Signal Processing 37 31– 42. [15] Cosman, P. C. (1993). Perceptual aspects of vector quantization. Ph.D. dissertation, Stanford Univ. [16] Cosman, P., Davidson, H., Bergin, C., Tseng, C., Olshen, R., Moses, L., Riskin, E. and Gray, R. (1994). The effect of lossy image compression on diagnostic accuracy of thoracic CT images. Radiology 190 517–524. [17] Cosman, P., Gray, R. and Olshen, R. (1994). Evaluating quality of compressed medical images: SNR, subjective rating, and diagnostic accuracy. Proceedings of the IEEE 82 919–932. [18] Cosman, P., Tseng, C., Gray, R., Olshen, R., Moses, L., Davidson, H., Bergin, C. and Riskin, E. (1993). Treestructured vector quantization of CT chest scans: image quality and diagnostic accuracy. IEEE Transactions on Medical Imaging 12 727–739. [19] Cover, T. M. and Thomas, J. A. (1991). Elements of Information Theory. Wiley, New York. [20] Cox, D. R. (1957). Note on grouping. J. Amer. Statist. Assoc. 52 543–547. [21] Dalenius, T. (1950). The problem of optimum stratification. Skandinavisk Aktuarietidskrift 33 201–213. [22] Dalenius, T. and Gurney, M. (1951). The problem of optimum stratification II. Skandinavisk Aktuarietidskrift 34 203–213. [23] Daly, S. (1992). Visible differences predictor: an algorithm for the assessment of image fidelity. SPIE Proceedings 1666 2–14. [24] Efron, B. and Tibshirani, R. J. (1993). An Introduction to the Bootstrap. Chapman and Hall, London.
[25] Elias, P. (1955). Predictive coding I and II. IRE Transactions on Information Theory 1 16–33. [26] Eskicioglu, A. M. and Fisher, P. S. (1995). Image quality measures and their performance. IEEE Transactions on Communications 43 2959–2965. [27] Eskicioglu, A. M. and Fisher, P. S. (1993). A survey of quality measures for gray scale image compression. Computing in AeroSpace 9 304–313. [28] Flury, B. A. (1990). Principal points. Biometrika 77 31–41. [29] Forgey, E. (1965). Cluster analysis of multivariate data: efficiency vs. interpretability of classification. Biometrics 21 768. (Abstract.) [30] Gardner, W. R. and Rao, B. D. (1995). Theoretical analysis of the high-rate vector quantization of LPC parameters. IEEE Transactions on Speech and Audio Processing 3 367–381. [31] Gersho, A. (1979). Asymptotically optimal block quantization. IEEE Trans. Inform. Theory 25 373–380. [32] Gersho, A. and Gray, R. M. (1992). Vector Quantization and Signal Compression. Kluwer, Boston. [33] Gray, R. M., Cosman, P. C. and Oehler, K. (1993). Incorporating visual factors into vector quantization for image compression. In Digital Images and Human Vision (B. Watson, ed.) 35–52. MIT Press. [34] Gray, R. M. and Karnin, E. (1981). Multiple local optima in vector quantizers. IEEE Trans. Inform. Theory 28 708– 721. [35] Halpern, E. J., Newhouse, J. H., Amis, E. S., Levy, H. M. and Lubetsky, H. W. (1989). Evaluation of a quadtreebased compression algorithm with digitized urograms. Radiology 171 259–263. [36] Hartigan, J. A. (1975). Clustering Algorithms. Wiley, New York. [37] Hilbert, E. E. (1977). Cluster compression algorithm: a joint clustering/data compression concept. Publication 7743, Jet Propulsion Lab, Pasadena, CA. [38] Ibragimov, I. A. (1956). On the composition of unimodal distributions. Theory Probab. Appl. 1 255–260. [39] Karlin, S. (1968). Total Positivity. Stanford Univ. Press. [40] Karlin, S. (1982). Some results on optimal partitioning of variance and monotonicity with truncation level. In Statistics and Probability: Essays in Honor of C. R. Rao (G. Kallianpur, P. R. Krishnaiah and J. K. Ghosh, eds.) 375–382. North-Holland, Amsterdam. [41] Lee, J., Sagel, S. and Stanley, R. (1989). Computed Body Tomography with MRI Correlation 2, 2nd ed. Raven, New York. [42] Li, J., Chaddha, N. and Gray, R. M. (1997). Asymptotic performance of vector quantizers with a perceptual distortion measure. Paper presented at 1997 IEEE International Symposium on Information Theory. (Full paper submitted for possible publication. Preprint available at http://www-isl.stanford.edu/~gray/ compression.html.) [43] Linde, Y., Buzo, A. and Gray, R. M. (1980). An algorithm for vector quantizer design. IEEE Transactions on Communications COM-28 84–95. [44] Lloyd, S. P. (1957). Least squares quantization in PCM. Technical note, Bell Laboratories. (Portions presented at the Institute of Mathematical Statistics Meeting Atlantic City, New Jersey, September 1957. Published in the March 1982 special issue on quantization, IEEE Trans. Inform. Theory.) [45] Lookabaugh, T., Riskin, E., Chou, P. and Gray, R. (1993). Variable rate vector quantization for speech, image, and
MEDICAL IMAGE COMPRESSION
[46]
[47]
[48]
[49]
[50]
[51] [52] [53]
[54]
[55]
[56]
[57]
[58]
[59]
[60]
video compression. IEEE Transactions on Communications 41 186–199. Lukas, F. X. J. and Budrikis, Z. L. (1982). Picture quality prediction based on visual model. IEEE Transactions on Communications COM-30 1679–1692. Lukaszewicz, J. and Steinhaus, H. (1955). On measuring by comparison. Zastosowania Matematyki 2 225–231. (In Polish.) MacMahon, H., Doi, K., Sanada, S., Montner, S., Giger, M., Metz, C., Nakamori, N., Yin, F., Xu, X., Yonekawa, H. and Takeuchi, H. (1991). Data compression: effect on diagnostic accuracy in digital chest radiographs. Radiology 178 175–179. MacQueen, J. (1967). Some methods for classification and analysis of multivariate observations. Proc. Fifth Berkeley Symp. Math. Statist. Probab. 1 281–296. Univ. California Press, Berkeley. Mannos, I. L. and Sakrison, D. J. (1974). The effects of a visual fidelity criterion on the encoding of images. IEEE Trans. Inform. Theory IT-20 525–536. Marmolin, H. (1986). Subjective MSE measures. IEEE Trans. Systems Man Cybernet. 16 486–489. Max, J. (1960). Quantizing for minimum distortion. IEEE Trans. Inform. Theory 6 7–12. Na, S. and Neuhoff, D. L. (1995). Bennett’s integral for vector quantizers. IEEE Trans. Inform. Theory 41 886– 900. Nill, N. B. (1985). A visual model weighted cosine transform for image compression and quality assessment. IEEE Transactions on Communications COM-33 551–557. Nill, N. B. and Bouxas, B. H. (1992). Objective image quality measure derived from digital image power spectra. Optical Engineering 31 813–825. Oehler, K. L. and Gray, R. M. (1995). Combining image compression and classification using vector quantization. IEEE Transactions on Pattern Analysis and Machine Intelligence 17 461–473. Perlmutter, K. O., Perlmutter, S. M., Gray, R. M., Olshen, R. A. and Oehler, K. L. (1996). Bayes risk weighted vector quantization with posterior estimation for image compression and classification. IEEE Transactions on Image Processing 5 347–360. Peterson, H. A., Peng, H., Morgan, J. H. and Pennebaker, W. B. (1991). Quantization of color image components in the DCT domain. Proceedings SPIE 1453 210–222. Poggi, G. and Olshen, R. A. (1995). Pruned tree-structured vector quantization of medical images with segmentation and improved prediction. IEEE Transactions on Image Processing 4 734–742. Redfern, A. and Hines, E. (1989). Medical image data compression techniques. In Proceedings of the Third International Conference on Image Processing and Its Applications 307 558–562. IEE, London.
53
[61] Rhodes, M., Quinn, J. and Silvester, J. (1985). Locally optimal run-length compression applied to CT images. IEEE Transactions on Medical Imaging MI-4 84–90. [62] Riskin, E. A. and Gray, R. M. (1991). A greedy tree growing algorithm for the design of variable rate vector quantizers. IEEE Transactions Signal Processing 39 2500–2507. [63] Sagrhi, J. A., Cheatham, P. S. and Habibi, A. (1989). Image quality measure based on a human visual system model. Optical Engineering 28 813–818. [64] Sayre, J., Aberle, D. R., Boechat, M. I., Hall, T. R., Huang, H. K., Ho, B. K., Kashfian, P. and Rahbar, G. (1992). Effect of data compression on diagnostic accuracy in digital hand and chest radiography. In Proceedings of Medical Imaging VI: Image Capture, Formatting, and Display 1653 232–240. SPIE, Bellingham, WA. ´ H. (1959). The Analysis of Variance. Wiley, New [65] Scheffe, York. [66] Shannon, C. E. (1948). A mathematical theory of communication. Bell Systems Technical Journal 27 379–423, 623– 656. [67] Shannon, C. E. (1959). Coding theorems for a discrete source with a fidelity criterion. In IRE National Convention Record, Part 4 142–163 IEEE Press, Piscataway, NJ. [68] Stark, D. and Bradley, J. W. G. (1992). Magnetic Resonance Imaging, 2nd ed. Mosby–Year Book, St. Louis. [69] Stockham, T. G., Jr. (1972). Image processing in the context of a visual model. Proceedings of the IEEE 60 828– 842. [70] Tarpey, T., Li, L. and Flury, B. D. (1995). Principal points and self-consistent points of elliptical distributions. Ann. Statist. 23 103–112. [71] Trushkin, A. V. (1982). Sufficient conditions for uniqueness of a locally optimal quantizer for a class of convex error weighting functions. IEEE Trans. Inform. Theory IT-28 187–198. [72] Tukey, J. W. (1949). One degree of freedom for nonadditivity. Biometrics 5 232–242. [73] Weinstein, M. and Fineberg, H. (1980). Clinical Decision Analysis. Saunders, Philadelphia. [74] Yamada, Y., Tazaki, S. and Gray, R. M. (1980). Asymptotic performance of block quantizers with a difference distortion measure. IEEE Trans. Inform. Theory 26 6–14. [75] Zador, P. L. (1963). Topics in the asymptotic quantization of continuous random variables. Memorandum, Bell Laboratories. [76] Zador, P. L. (1963). Development and evaluation of procedures for quantizing multivariate distributions. Ph.D. dissertation, University Microfilm 64-9855, Dept. Statistics, Stanford Univ. [77] Zador, P. L. (1982). Asymptotic quantization error of continuous signals and the quantization dimension. IEEE Trans. Inform. Theory 28 139–148.