MEMS-Enabled Miniaturized Particulate Matter Monitor Employing 1.6 GHz Aluminum Nitride Thin-Film Bulk Acoustic Wave Resonator (FBAR) and Thermophoretic Precipitator Justin P. Black, Alex Elium, Richard M. White
Michael G. Apte, Lara A. Gundel, Rossana Cambie
University of California at Berkeley Department of Electrical Engineering and Computer Sciences Berkeley, CA, USA
[email protected]
Lawrence Berkeley National Laboratory Berkeley, CA, USA
Abstract— We describe a miniaturized MEMS particulate matter (PM) monitor that employs the deposition of particulates from a sample stream onto a 1.6 GHz piezoelectric thin-film bulk acoustic wave resonator (FBAR) by means of thermophoresis, and determination of the mass deposited by measuring the resonant frequency shift of a Pierce oscillator. Real-time measurements made in an environmental chamber over several weeks and during a week-long field study in a residence showed excellent correlation with the responses of other commercial aerosol instruments. An added mass of 1 pg could be resolved with the sensor, and the level of detection was 18 μg / m3. The monitor weighs 114 g, has a volume of approximately 245 cm3, consumes less than 100 mW, and would cost less than $100 USD in small quantities. Efforts to further miniaturize the sensor and integrate it with a cell-phone are described.
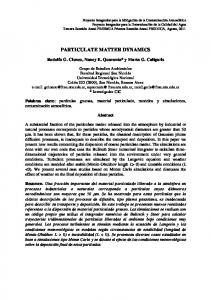
a photodetector (Figure 1). The monitor contains an array of four addressable FBAR sensors and heaters that extend the monitor lifetime. Since the monitor optical module was not employed in the field-study, the PM optical discrimination results will not be described here.
Keywords: thin-film bulk acoustic wave resonator (FBAR), particulate matter mass sensor, CMOS Pierce oscillator, aerosol, thermophoresis
Figure 1: MEMS PM monitor concept consisting of an FBAR mass sensor, thermophoretic deposition of airborne PM onto the FBAR, and discrimination of the nature of PM from its UV / IR absorbance.
I.
INTRODUCTION
Airborne particles are responsible for severe adverse effects on human health, examples being the lung disease caused by tobacco smoke, and asthmatic reactions and cardiovascular damage caused by particles from air pollution. Airborne particulate matter (PM) pollution is estimated to cause 20,000 to 50,000 deaths per year in the United States [1]. PM typically consists of a mixture of organic and inorganic solids and liquids suspended in air, whose size varies over four orders of magnitude, from a few nanometers to tens of microns. Based on their diameter, particles are typically divided into two groups, coarse and fine, with the boundary between the two ranging from 1 µm and 2.5 µm. This study focused on PM smaller than 2.5 µm. Present instrumentation to measure airborne particulates is bulky, costly to purchase, and difficult to operate; its use in field studies often requires sending samples collected to an analytical laboratory in order to identify the particulates. We have designed and tested a miniaturized MEMS PM monitor that employs the use of thermophoresis to deposit airborne particles from a sample stream onto a 1.6 GHz piezoelectric aluminum-nitride thin-film bulk acoustic wave resonator (FBAR), determination of the deposited mass by measuring the resonant frequency change of a Pierce oscillator circuit (designed in 0.25 µm CMOS), and discrimination of the nature of the particles from the absorption characteristics of the deposited film by the use of infrared and ultraviolet LEDs and This work was sponsored by the California Air Resources Board. The cell phone coupling project is supported by Intel, Inc. and internal funding from the Berkeley Sensor & Actuator Center (BSAC).
Incident UV / IR
Reflected
Air outlet
PM laden air
FBAR sensor
Heater
Other researchers have sought to miniaturize aerosol instrumentation. The work includes a microfabricated corona discharge ionizer [2] and the use of a quartz-crystal microbalance to monitor airborne PM deposited by electrostatic discharge [3], inertial impaction [4], and thermophoresis [5]. The last work, by researchers at the Lawrence Berkeley National Laboratory (LBNL), also employed ultra-violet and infra-red fiber-optic probes to discriminate the mass composition, and served as the impetus for this work. The FBAR has also been shown function as a sensor in both the liquid and vapor phases[6][7][8][9]. However, to the authors’ knowledge this work represents the first field-deployed, autonomous FBAR sensor operating weeks at a time, and its first use for aerosol monitoring. II.
SENSOR DESIGN AND FABRICATION
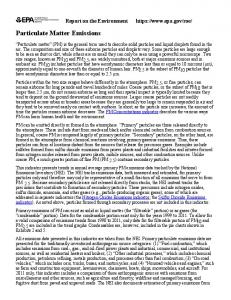
A. AlN FBAR A 1.6 GHz piezoelectric aluminum nitride FBAR (see Figure 2a) was fabricated as follows: (a) low stress nitride deposition by LPCVD, followed by Pt patterning by lift-off and 2 µm AlN sputter deposition; (b) open via access to bottom Pt electrode, AlN is wet etched by hot H3PO4 (160°C); (c) deposition of the top Al electrode and patterning by Cl2 plasma dry etch; (d) Cl2-based dry etching of AlN resonant devices and dry release in XeF2. Microfabricated 100 x 100 µm square FBARs showed quality factors over 2000 with Rx ~ 2 Ω and kt2 ~ 4%. A one-dimensional model of the FBAR
electromechanical behavior, including the effects of the electrodes and added PM film, was derived using coupled differential equations [10] and electromechanical transmission lines [11]. Figure 2c compares the theoretical and measured FBAR impedance, excellent agreement is evident. a)
b)
3 μm
SiN c)
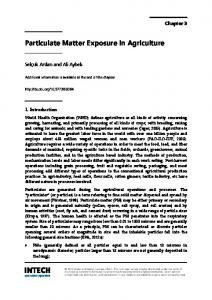
C. Thermophoretic Precipitator In thermophoresis, airborne particles are driven away from the heated surface by collisions with gas molecules of differing kinetic energies [15]. The force is proportional to the negative of the temperature gradient. Thermophoretic precipitation of PM was produced by an undoped LPCVD polysilicon heater on a fused quartz substrate (Figure 4). Heaters were thermally isolated by removing the underlying quartz in 49% HF. Each thermophoretic module incorporates an array of four addressable heaters that align with a four-element FBAR chip.
etch pit
Si wafer
Pt
AlN
theoretical
The oscillator temperature coefficient of frequency was between -24 to -25 ppm per ◦C. Temperature induced frequency fluctuations over 1 minute measurement intervals were subtracted out with temperature measurements from a thermocouple attached to the monitor package, allowing a frequency change of 1 kHz to be resolved during experiments. Frequency and output power data were collected with a HP 8562EC Spectrum Analyzer and laptop computer.
Al measured
Figure 2: (a) Cross-section of AlN FBAR with Pt and Al electrodes; (b) SEM of FBAR; (c) comparison of theoretical and measured FBAR impedance at fundamental resonance, inset shows S11.
When subject to mass loading, the FBAR response obeyed Sauerbrey equation [12]: Δf Δm ' = = Sm Δm ' f m'
The heater required 60 mW of input power to produce the desired 100 ◦C operating temperature, corresponding to a temperature gradient of approximately 1600 ◦K / cm across the 500 µm tall channel. The thermophoretic deposition velocity was estimated to be 0.9 m / s while the sampler air velocity was typically in the vicinity of 3 mm / s. PM impacted onto the FBAR surface adheres through van der Waals forces. Experiments show that collection efficiencies approaching 100% can be achieved using thermophoresis. a)
cable from heater to PCB
connector
b)
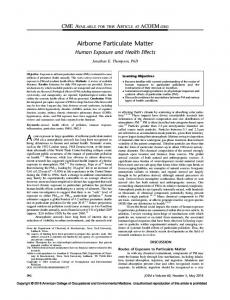
where m’ is the mass per unit area of the device, Δm’ is the added mass per unit area of the PM, f is the frequency, and the FBAR mass sensitivity, Sm, was measured to be 745 cm2 / g. B. Pierce Oscillator A standard Pierce oscillator was designed in a 0.25 CMOS process (Figure 3a). The performance is comparable to FBAR Pierce oscillators reported by others [13][14]. The oscillator phase noise (-102 dBc / Hz at a 10 kHz offset) and output spectrum (Po = -5 dBm) are given in Figure 3b. The supply was 2.5 V and the core oscillator power consumption, 4 mW, can be reduced by a factor of five or more as the circuit was not optimized. b) Phase noise [dBc / Hz]
a)
-40
-60
-80
-100
-120 2 10
10
3
10
4
10
5
10
Frequency offset from carrier [Hz]
Figure 3: (a) Pierce oscillator circuit; (b) oscillator phase noise, inset shows output spectrum.
6
heater array
Figure 4: (a) Optical micrograph of heater and power cable next to U.S. quarter, dashed square region corresponds to the SEM in (b); (b) SEM of four-element polysilicon serpentine heater array. To achieve 100 ◦C required an input power of 60 mW.
D. Packaging and Assembly Figure 5a is a SolidWorks rendering of the monitor package consisting of the thermophoretic precipitator, FBAR / CMOS mass sensor, flow channel, and fluidic interconnects. Figure 5b contains a photograph of an assembled monitor and disassembled components. The 2 mm wide, 500 μm tall flow channel is defined by a machined brass housing, channel sidewall spacers, an aperture, and a CMOS / FBAR spacer, all secured to the FR-4 PCB with twelve screws. The spacers provide clearance for the CMOS and FBAR bondwires and define the distance between thermophoretic heaters and the FBAR surface (thermophoretic gradient), while the aperture restricts deposition of PM to only the FBAR array. In order to prevent air leaks, a bead of silicone was added along the outside joints of the package after the parts were bolted together.
During operation, the monitor was oriented vertically with a size selective inlet attached to the lower flow port. The size selective inlet consisted of a hollow cylindrical tube and relies on competition between gravity and viscous flow forces to filter out PM larger than 2.5 µm in diameter. a)
from one cigarette, the FBAR monitor shows excellent correlation with the QCM impactor and weighed filters. B. Field Study in Residence The 1200 ft2, two-story single-family wood-and-brick dwelling had an attic exhaust fan that could draw air from the ceiling of the test area, pulling in outdoor air through the windows and exterior doors near the test equipment. Challenge aerosols included diesel exhaust from a generator, burnt toast, burnt eggplant, wood smoke from a fireplace, cigarette smoke, and ambient PM. In addition to the equipment used in the environmental chamber, experiments also employed a highflow sampler for measuring episodic source-enriched PM2.5 (PM smaller than 2.5 µm in diameter) and a Federal Reference Method (FRM) sampler for PM2.5. Figure 6b summarizes data from the field study and an environmental chamber ETS experiment. The monitor exhibits a level of detection of 18 µg/m3, which satisfies the EPA’s Federal Reference Method for aerosol instruments. Least squares fits to the field data yield the same slope for all results (0.0025 kHz/min per µg/m3), in agreement with LBNL chamber results.
b)
a)
Figure 5: (a) Exploded Solidworks rendering of monitor components; (b) optical micrograph of disassembled components and assembled monitor next to U.S. quarter.
III.
SENSOR CALIBRATION AND FIELD STUDIES
Development and calibration of the monitor took place in an environmental at LBNL. The culmination of this work was a pilot-scale field test that took place in a single-family house in Berkeley, California over two, ten-day periods in the early summer of 2006. A. Monitor Calibration in an Enviromental Chamber The 24.7 m3 environmental chamber at LBNL had vinyl flooring and walls of painted gypsum board (additional details can be found in [16]). PM concentrations were recorded with a suite of analytical-grade commercial instruments including a quartz crystal microbalance impactor (QCMI), an optical particle counter (OPC), an aethelometer, and filters. The chamber was equipped with a ventilation system and sensors for real-time monitoring of pressure, temperature, and relative humidity. The challenge aerosol was typically environmental tobacco smoke (ETS) in ambient air, although several experiments sampled diesel exhaust from a generator. ETS from a popular brand of cigarette was generated inside the environmental chamber by an LBNL-built, automated smoking machine. Calibration experiments typically lasted a few days, although FBARs operated continuously in the chamber for several weeks. As shown in Figure 6a, in response to ETS
b)
Figure 6: (a) MEMS PM monitor response to ETS from one cigarette, along with PM concentrations from the calibrated QCM and weighed filters (PM-grav); (b) Chamber (ETS) and field data indoor ambient PM with & without infiltrated diluted PM from ETS, diesel exhaust, wood smoke, and toast. PM concentrations are plotted on the x-axis: open circles, ambient PM2.5 determined with the FRM; numbered triangles PM2.5 FRM from the sources (1) toast, (2) diesel exhaust, (3) ETS, and (4) burnt toast; and filled circles, PM-grav from ETS in environmental chamber.
Figure 7a contains a photograph of the field study equipment setup while Figure 7b is a close up photograph of the MEMS PM monitor. The monitor weighs 114 g, has a volume of approximately 245 cm3, consumes less than 100 mW, and would cost less than $100 USD in small quantities. The volume of the MEMS PM monitor is over two orders of magnitude smaller than the other commercial-grade instruments. a)
MEMS PM
Episodic Sampler
measuring the resonant frequency shift of a Pierce oscillator. Real-time measurements made in an environmental chamber over several weeks and during a week-long field study in a residence showed excellent correlation with the responses of other commercial aerosol instruments. Efforts are underway to couple to sensor to a cell phone enabling a personal aerosol monitor and geographical mapping of PM sources. ACKNOWLEDGMENT
b)
The authors gratefully acknowledge the assistance of Zhuo Zhang and George Stern for their assistance in assembling and testing of the monitor.
FRM
REFERENCES [1] OPC
Flow inlet
QCMI
Figure 7: (a) Photograph of equipment setup for the two, ten-day field studies in a Berkeley, CA, U.S.A. residence, dotted box shows MEMS PM monitor; (b) close-up photograph of MEMS PM monitor.
C. Cell Phone Integration Efforts are currently underway to further miniaturize the MEMS PM sensor for integration with a cell phone. This technology would facilitate measurements of the geographical distribution of PM (e.g. diesel exhaust). Figure 8 depicts a concept of the proposed integrated module. Particulate matter monitor will attach to back of cell phone
Air sampling fan from first design
Body of first monitor design (can reduce 3X in size)
[2]
[3]
[4] [5] [6]
[7]
[8]
[9]
Reversible DC motors – candidates for air sampler on cell phone
[10]
[11] [12] [13]
[14]
[15] Figure 8: Concept for integration of MEMS PM monitor with cell phone.
IV.
CONCLUSIONS
A miniaturized MEMS particulate matter (PM) monitor has been described that employs the deposition of particulates from a sample stream onto a 1.6 GHz piezoelectric thin-film bulk acoustic wave resonator (FBAR) by means of thermophoresis, and determination of the mass deposited by
[16]
A.H. Mokdad, et al., "Actual causes of death in the United States, 2000", J. Amer. Medical Assoc., vol. 291, no. 10, pp. 1238-1235, 2005. B.L. Chua, Z. Li, D.T. McCormick, W.P. Shih, N.C. Tien, A.S. Wexler, D.A. Niemeier, and B. Holmen, “A unipolar corona discharge microfabricated ionizer structure for gases at atmospheric pressure and composition”, Proc. 17th IEEE Intl. Conf. on MEMS, pp. 261-264, 2004. J.G. Olin, G.J. Sem, and D.L. Christenson, “Piezoelectric-electrostatic aerosol mass concentration monitor”, Amer. Industrial Hygiene Association J., vol. 32, pp. 209-220, 1971. R.L. Chuan, “An instrument for the direct measurement of particulate mass”, J. Aerosol Sci., vol. 1, pp. 111-114, 1970. L.A. Gundel, M.G. Apte, A.D. Hansen, and D.R. Black, “Apparatus for particulate matter analysis”, U.S. Patent 7,168,292, January 30, 2007. R.J. Weber, S.G. Burns, C.F. Campbell, and R. O’Toole, “Applications of AlN thin-film resonator topologies as antennas and sensors”, IEEE MTT-S Intl. Microwave Symp. Digest, pp. 161-164, 1992. P.H. Kobrin, C.W. Seabury, A.B. Harker, and R.P. O’Toole, “Thin film resonant chemical sensor with resonant acoustic isolator”, United States Patent, 5,936,150, August 10, 1999. H. Zhang, M.S. Marma, E.S Kim, C.E. McKenna, and M.E. Thompson, “A film bulk acoustic resonator in liquid environments”, J. Micromechanics and Microengineering, vol 15, pp. 1911-1916, 2005. R. Gabl, E. Green, M. Schreiter, H.D. Feucht, H. Zeininger, R. Primig, D. Pitzer, G. Eckstein, W. Wersing, W. Reichl, and J. Runch, “Novel integrated FBAR sensors: a universal technology platform for bio- and gas-detection”, Proc. IEEE Sensors Conf., pp. 1184-1188, 2003. S.J. Martin, V.E. Granstaff, and G.C. Frye, “Characterization of a quartz crystal microbalance with simultaneous mass and liquid loading”, Anal.Chem., vol. 63, no. 20, pp. 2272-2281, 1991. J.F. Rosenbaum, Bulk Acoustic Wave Theory and Devices, Boston: Artech House, 1988. G. Sauerbrey, “Use of oscillator quartz crystals for weighing thin layers and microweighing”, Zeitschrift fur Physik, vol. 155, pp. 206-222, 1959. S.G. Burns and R.S. Ketcham, “Fundamental-mode pierce oscillators utilizing bulk-acoustic-wave resonators in the 250-300 MHz Range”, IEEE MTT-S Intl. Microwave Symp. Digest, pp. 83-84, 1984. B.P. Otis and J.M. Rabaey, “A 300 μW 1.9 GHz CMOS Oscillator Utilizing Micromachined Resonators”, Proc. 28th European Solid-State Circuits Conf., pp. 151-154, 2002. F. Zheng, “Thermophoresis of spherical and non-spherical particles: a review of theories and experiments”, Advances in Colloid and Interface Science, vol. 97, pp. 255-278, 2002. J. Wagner, et al., “Environmental tobacco smoke leakage from smoking rooms”, J. Occup. and Environ. Hyg., vol. 1, pp. 110–118, 2004.