of studies by Finke and Pinker (1982, 1983). On each trial, subjects were shown a pattern of 3-5 dots for several seconds, then a blank field, and then an arrow.
Memory & Cognition 1984,12 (3), 207-218
Mental extrapolation in patterns constructed from memory STEVEN PINKER Massachusetts Institute of Technology, Cambridge, Massachusetts
PAUL A. CHOATE University ofCalifornia, Davis, California
and RONALD A. FINKE State University ofNew York, Stony Brook, New York
Finke and Pinker (1982, 1983) showed subjects an array of dots followed by an arrow in a blank field, and asked them to determine whether the arrow pointed to any of the previously seen dots. Response times were linearly related to the distance between the arrow and the nearest dot, suggesting that subjects spontaneously used an internal scanning or extrapolation process to perform the task. We replicate and extend this finding by varying the retention interval, and by employing a paradigm in which subjects' eyes are closed and the arrows are described to them using a coordinate scheme. We also show that subjects are unable to predict the form of the data when the task simply is described to them. Results suggest that mental scanning along a straight path can be performed on images reconstructed from memory, and that it does not depend on the ongoing perception of a continuous surface, on physical eye movements, or on demand characteristics.
In recent years, the phenomenon of mental image scanning has come to occupy a central position in the empirical and theoretical study of imagery. Kosslyn (1973) and Kosslyn, Ball, and Reiser (1978) showed that image scanning can be studied with considerable precision using chronometric methods. When subjects are asked to scan or shift attention between locations in an imagined scene, the time they require varies linearly with the Euclidean distances between the corresponding locations in the actual scene (r = .97 in Kosslyn, et al., 1978). Since then, data from imagery-scanning experiments have been used in three ways. First, the phenomenon itself has played an important role in debates over the format of image representation, with Kosslyn and his collaborators arguing that scanning implicates an This research was supported by NSF Grants BNS81-14916 and BNS82-16546 and an NIH Biomedical Research Support grant awarded to the first author, by a Faculty Research grant from the University of California to the second author, and by the MIT Cognitive Science Center under a grant from the Sloan Foundation. We thank Ned Block, James Pomerantz, Molly Potter, Roger Shepard, and an anonymous reviewer for helpful comments and suggestions, and Kathleen Murphy for assistance in the preparation of the manuscript. Requests for reprints should be addressed to Steven Pinker, Department of Psychology , EIO-D18, Massachusetts Institute of Technology, Cambridge, MA 02139, or to Ronald Finke, Department of Psychology, State University of New York at Stony Brook, Stony Brook, NY 11794.
array-like representation for imagery (e.g., Kosslyn, 1980, 1981; Kosslyn, Pinker, Smith, & Shwartz, 1979; Kosslyn & Pomerantz, 1977), and Anderson (1978) and Pylyshyn (1981) arguing that propositional representations can account for the data equally well or better. Second, the scanning paradigm has been ernployed as a mental "tape measure" in attempts to answer questions about geometric properties represented in images. For example, subjects' response times (RTs)in such experiments have been used in attempts to determine the degree of preservation of metric information in images (Kosslyn et al., 1978), the maximum width of an image (Kosslyn, 1978), the dimensionality of images (pinker, 1980; Pinker & Kosslyn, 1978), the accuracy of imagined displacements of objects (Pinker & Kosslyn, 1978), the accessibility of perspective properties in images (Pinker, 1980; Pinker & Finke, 1980), the role of eye movement commands in imagery (Pinker, 1980), and the sequence of operations used in mental image generation (Kosslyn, Reiser, Farah, & Fliegel, 1983). Third, the ability to scan images has been proposed as one of the mental tools or components of "visual routines" (see Ullman, 1982) that humans can put to use in solving certain geometric problems, such as verifying the collinearity of three objects (Spoehr & Williams, 1978), determining whether an object lies in a particular direction with respect to some reference point (Attneave & Pierce, 1978; Finke & Pinker, 1982), and estimating
207
Copyright 1984 Psychonomic Society, Inc.
208
PINKER, CHOATE, AND FINKE
distances from mental maps (Reed, Hock, & Lockhead, 1983; Thorndyke, 1981; Thorndyke & Hayes-Roth, 1982). Despite the potential importance of image scanning, several critics have cast doubt upon the very existence of the phenomenon or upon its significance if it does exist. Some have argued that subjects can determine the purpose of image-scanning experiments from the experimental instructions or from nonverbal cues from the experimenter, and deliberately time their responses to make them linearly related to interobject distance in an attempt to comply with the demand characteristics of the experiment (Intons-Peterson, 1983; Mitchell & Richman, 1980; Richman, Mitchell, & Reznick, 1979). In addition, Pylyshyn (1981) argued that the instructions in imagery tasks are ambiguous with respect to whether the task requires subjects to move an internal processing locus across their image or to entertain the notion that an episode of physical movement of an object is taking place in real time. If subjects arrive at the latter interpretation, they would have little choice but to delay their buttonpresses by the amount of time they estimate the corresponding physical event would require. If so, they would not have to scan or even form an image in order to yield RTs linearly related to interpoint distances (alternatively, they would use imagery, but imagery itself would be nothing but the use of tacit knowledge to simulate physical events). Some of these objections were addressed in a series of studies by Finke and Pinker (1982, 1983). On each trial, subjects were shown a pattern of 3-5 dots for several seconds, then a blank field, and then an arrow appearing at an unpredictable location. Their task was to determine as quickly as possible whether the arrow pointed at any of the previously seen dots. Subjects' RTs were related linearly to the distance between the arrow and the location of the nearest dot to which it pointed, and subjects reported that they retained an image of the dots and mentally scanned along an imaginary extrapolation of the arrow until they encountered either an imagined dot or a region of the field containing no dots. Furthermore, the slope of the RT-distance function, an estimate of the rate of scanning, was very close to those obtained in the earlier experiments on image scanning cited above. Since there were no instructions to form or scan images, and no mention of physical motion of any sort, it is highly unlikely that subjects' spontaneous use of what appears to be an image-scanning strategy was the product of their second-guessing the experimenter about the properties of imagery or of their interpreting the task as an exercise in the mental simulation of physical motion. Finke and Pinker (1983) also showed that the image-scanning strategy was used only when the location of the arrow was unpredictable. When subjects were shown the arrow's location a sufficient amount of time before the arrow itself appeared, they were able to compute the relative direction of each dot with respect to that location and then simply
matched the arrow's orientation against this set of directions directly, taking equal amounts of time for all distances. This also shows that the extrapolation task does not, in general, inspire second-guessing of the hypothesis or mental simulation because the linear RT-distance relation can either occur or not occur, depending on a factor-duration of warning interval for arrow location-that is unrelated to the task instructions. There are still some important problems raised by the Finke and Pinker (1982, 1983) studies, however, and there are still doubts that image scanning is sufficiently well understood to permit the sorts of strong conclusions cited in the first paragraph. First, in those experiments, the subjects saw the arrow no more than 2 sec after the dot pattern had disappeared. In contrast, most of the imagery-scanning studies cited earlier involved patterns committed to memory minutes or hours before the task. This raises the worry that the scanning took place in some rapidly fading short-term visual memory representation that may be distinct from images constructed from long-term memory. Aside from iconic memory and retinal afterimages, there are several candidates for such a short-term visual memory store, such as the spatiotopic buffers that have been posited to integrate information across saccades (see Breitrneyer, 1983, McConkie & Rayner, 1976, and Potter, 1983) or the very short-term (9 sec or less) visual memory documented by Phillips (1974) and discussed by Potter (1983). Thus, the Finke and Pinker (1982, 1983) studies do not demonstrate that spontaneous mental scanning is possible in the form of imagery that is addressed in the imagery debate, namely, images constructed from long-term memory, only in that resulting from an immediately prior visual stimulus. A second problem is that, in all of the experiments, subjects saw the arrow and the blank field in front of them while they were performing the task, and may have been moving their eyes along the extrapolated line from the arrow to the location of the (now absent) dot during the scanning process. This raises the following concerns. Although Finke and Pinker (1982) argued, on the basis of comparisons of scanning rates, that the linear increase in RT with distance is not a simple consequence of the time taken by physical eye movements, it is still conceivable that some slowed-down eye movement process, or one in which small saccades along the extrapolated line are alternated with fixations of constant duration, could account for the effect without the necessity of positing an internal scanning process. In addition, Pylyshyn (198l) argued that experiments in which subjects scan across or superimpose images onto visible physical surfaces do not bear on the debate about the format of imagery or the nature of image scanning. Pylyshyn proposed that, in such cases, the geometry of a veridically perceived surface forces the subject, when imagining movement along a path from one location to another, to imagine the movement traversing all locations in between. We feel Pylyshyn's argument is un-
MENTAL EXTRAPOLATION sound, since one can posit models of veridical perceptual representations in which intermediate locations need never be processed (e.g., if numerical coordinates were manipulated algebraically). Thus, patterns of data from such experiments are consequences of the nature of perceptual representations and processes and not of the geometry of the input. Nonetheless, the case would be stronger if one could show that spontaneous image scanning also occurs when subjects' eyes are closed and their representations are constructed entirely from memory. Third, there was a complication in the results of Finke and Pinker (1983): Subjects made far more errors for the shortest arrow-dot distance (3 em) than for the other distances. This did not betray an across-the-board speed-accuracy tradeoff, since errors were constant across the remaining range of arrow-dot distances (4.5-12 em) and RTs increased linearly over that range. Finke and Pinker (1983) explained this anomaly as follows. Dot positions are not remembered with perfect accuracy, but there is a region of uncertainty surrounding each position. "Hits" and "misses" were defined in the experiments in terms of the angle between the arrow and a line joining the dot to the tail of the arrow, regardless of distance, such that in "miss" trials the arrow missed a dot by 40 deg or more. Subjects thus should adopt a tapering in region surrounding the extrapolated line as a criterion for responding "hit" or "miss." Therefore, a constant degree of positional inaccuracy will lead to many errors for distances below a certain value, but no errors above that value (this is illustrated in Figure I, top panel).' Although this explanation of the anomalous data appears plausible, Finke and Pinker (1983) did not adduce independent evidence for it, and so it remains mostly conjectural. The experiments reported in this paper are intended to address these problems. To address the problem of the short retention interval of the visual pattern, we replicated the Finke and Pinker (1982, 1983) experiments but varied the retention interval parametrically (in Experiment 1), and ran a related experiment in which the dot pattern was presented only at the beginning of a block of trials (Experiment 3). To address the problem of the visibility of the field containing the arrow and (previously) the dots, we designed Experiment 3 so that subjects could perform the entire task with their eyes closed. To address the problem of the anomalously elevated error rate for the shortest distance, we introduced two manipulations that would be expected to enhance the effect if Finke and Pinker's (1983) explanation is correct: shorter arrow-dot distances (in Experiment 1) and longer retention intervals (in Experiments I and 3). Finally, in Experiment 2, we exploited the anomalous data pattern itself and the effects of varying the retention interval to show that the results were unlikely to be an artifact of demand characteristics.
209
I.\ /
A
"-
" -c.> I
_/
/
I
, I
B
\
" /---- ......... /
I
C '\ \
, .....
---
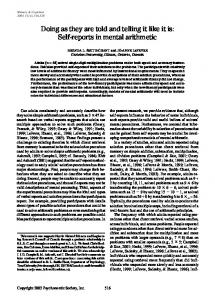
Figure 1. lllustration of proposed explanation for elevated error rates and RTs for short arrow-dot distances in mental extrapolation experiments. Arrow sectors define zones within which a remembered or imagined dot counts as a ''yes'' response. Dashed circular regions surrounding each dot denote the range of error in the remembered dot locations. The probability of making an error in judging whether an arrow points to a dot corresponds to the proportion of the area of the memory region that falls outside the scanning sector. Dots are shown representing distances of 0, 1.5, and 3 em, for short (A), medium (B), and long (C) retention intervals, respectively, paralleling the conditions of Experiment 1. Higher error rates are predicted for short distances and longer retention intervals.
EXPERIMENT I This experiment was a replication and extension of Finke and Pinker (1982, 1983), such that we varied the retention interval from 0 to 10 sec and such that the range of distances was extended below Finke and Pinker's (1983) 3-cm minimum value. We hypothesized that, if the scanning phenomenon was not confmed to very short-term visual memory, then RT would increase linearly with arrow-dot distance even at the 10-sec retention interval, which would exceed the estimated duration of the very short-term visual buffers, other than imagery per se, that had been proposed previously (see Potter, 1983, for a review). Furthermore, the experiment allowed us to estimate the effects of retention interval on image construction and maintenance time (by examining the intercept of the function) and on the scanning rate (by examining its slope). Finally, if Finke and Pinker's (1983) elevated error rate for the shortest arrow-dot distance was a consequence of inaccuracy in remembered dot location, then any manipulation that served to increase that uncertainty (e.g., increasing the retention interval) should enhance the effect (see Figure 1). This enhancement could take the form of an increased error rate at the short distances, or of error rates being elevated over a greater range of distances at the low end of the distance scale. Figure 1
210
PINKER, CHOATE, AND FINKE
also shows that decreasing the distance between dot and arrow should also enhance the effect, another prediction of this experiment.
1400
\
\
Vl
\
\
E
\ \ \
1200
ClJ
E t=
K.
\
/"
\\ 'x'/
9
uro
I
,/
X
I
"'1/
,, ,,
1100
e
.> I
\
f;
ClJ
Results Reaction times. The mean RTs to respond affirmatively and correctly that an arrow was pointing to a previously seen dot are shown in Figure 2. It can be
,/
\
1300
U
Method Subjects. Forty-five undergraduate students at the University of California at Davis served as subjects in exchange for credit in an introductory psychology course. Procedure. The general procedure was similar to that used in Experiment 1 of Finke and Pinker (1983). The subjects were tested individually and were informed only that the experiment would be one on visual memory. A Gerbrands four-ehanne1 tachistoscope was used to display all experimental materials. At the beginning of each trial, the subjects were shown a pattern consisting of three, four, or five black dots, 6.35 mm in diameter, on a white background; these patterns were identical to those in Finke and Pinker (1983). A pattern was displayed for 4 sec, and the subjects were instructed to remember the location of each of the dots. Later in the trial, a solid black arrow, 1 em in length, was presented on a white background, and the subjects were instructed to indicate, by pressing the appropriate button on a response box, whether the arrow was pointing to the location of any of the dots that they had just observed. For 15 of the subjects, the arrows were presented immediately after the offset of the pattern; for another 15, an empty white field was presented for 2 sec following the offset of the pattern; and for the remaining 15 subjects, the arrow appeared 10 sec after the offset of the pattern. In the 10-sec delay condition, the tachistoscopic field was totally dark for the first 8 sec, followed by a 2-sec warning period during which the white blank field was presented. All of the fields were 14 x 14 deg in size, were viewed at a distance of 75 em, and were matched for average luminance. The experiment began with an explanation of the task, followed by a display in which an arrow pointed at one of the dots in a configuration similar to those used in the experiment. The subjects were told to respond as quickly and as accurately as they could as soon as the arrows were presented. We explained that the arrows would point either directly at the center of a dot or would completely miss all of the dots in the pattern by at least 40 deg. The subjects were then given an opportunity to practice pressing the two response buttons and to respond to arrows in a series of practice trials. The practice trials consisted of 14 presentations of a four-dot practice pattern, followed by an arrow at the appropriate delay time for each group. The arrow-to-dot distance ranged from 0 to 12 em at 1.5-em intervals, as measured from the tip of the arrow to the center of the dot. One arrow for each of these nine distances was then presented, together with five arrows that completely missed the dots. These arrows appeared in random order, with the single constraint that there could be no more than three consecutive "yes" or two consecutive "no" trials. Error feedback was provided after each response. The experimental trials, consisting of three sets of 28 trials each for the three-, four-, and five-dot patterns, were then conducted. Before a set of trials began, the dot pattern was inspected by the subjects for 30 sec; the patterns and arrows were then presented as in the practice session. Each set of trials contained 2 arrows for each of the nine distances, and 10 arrows that did not point to any of the dots. The arrows were evenly distributed throughout the viewing field, and no 2 arrows were ever presented from the same location. The order of the arrows was randomized as in the practice session, and the order of dot patterns was randomized across subjects within each group.
~_-J(
\
,,-/:r,-,-tr--
,
' -tr h-----tr"-
ClJ
Delay (sec)
1000
0::
----6
Ir'
---f;- --
0 2
-*-
10
-----{)--
900
o Scanning Distance (em) Figure 2. Mean RTs to verify correctly that an arrow pointed at a previously presented dot (N = 45).
seen that the functions relating RT to distance are nonmonotonic, displaying an increase in RT with increasing distance except at the O-cm distance, at which the RTs are anomalously high. An analysis ofvariance reveals that RTs varied significantly with arrow-dot distance [F(8,336) = 13.44 p .001] . Trend analyses for the full distance range 01 0-12 em revealed highly significant linear and quadratic trends [F(l,336) = 15.01, p .001, and F(1,336) = 48.99, p .001, respectively]. The departure frorr linearity was due entirely to the elevated O-cm RT with this single point excluded, the linear trend Wal highly significant [F(l,294) = 93.80, p .001], the quadratic .trend was not significant [F(l,294) = 1.17 p .25], and there was no appreciable residual variatior (F 1). Figure 3 displays the regression line for RTi within the 1.S-12-cm range of distances, averaged acros the three levels of delay. It is clear that the aggregan