MENTOR, a tool for traffic monitoring where applications' information are used to ... interpreting each application performance problem related to the network.
Salão de Ferramentas do SBRC 2008
43
MENTOR: A network performance recommendation tool Eliseu Oliveira1, Leobino N. Sampaio1,2, Ivo Koga1, Priscilla Moraes1, Dimitri Anjos1, José A. Suruagy Monteiro1, Paulo Cunha2 1
Computing and Networking Research Group – NUPERC Universidade Salvador (UNIFACS) Rua Ponciano de Oliveira, 126 - Rio Vermelho 41950-275 – Salvador – BA – Brazil. 2
Informatics Center – Federal University of Pernambuco (UFPE) Caixa Postal 7851 – 50732-970 – Recife – PE – Brazil
{eliseu.oliveira, leobino, ivo.koga, priscilla.moraes, dimitri, suruagy}@unifacs.br {lns, prfc}@cin.ufpe.br
Abstract. The use of advanced applications has caused end-users to show a new interest in accessing network measurement and status data across multiple domains, in order to detect occasional network problems. Diversity on network technologies, technical solutions and network managers add to the complexity of providing such information, which, when available, includes technical details that are meaningful only to specialists. This paper presents MENTOR, a tool for traffic monitoring where applications’ information are used to provide network performance recommendations in high level language, helping users on network usage.
1. Introduction In recent years we have witnessed a rapid growth of audiovisual application running over the Internet, a cheap alternative of interactive voice and video communication that relies on the adoption of a new generation of powerful and interactive applications. These new kinds of applications require from administrators a quick network problem detection and performance analysis. However, the current monitoring approaches don’t meet these requirements since they concentrate on the administrators the task of interpreting each application performance problem related to the network. In order to overcome these limitations, the monitoring infrastructure should help the administrators diagnose network problems and advise users about network conditions. Current traffic monitoring solutions are far from being scalable and giving the right and meaningful network performance information to network applications and users. In fact, when end-users look for network performance, they are actually concerned about the performance of their applications. However, the monitoring visualization tools usually show performance data without considering any particular user and application characteristics. Network administrators need to count on tools that anticipate the user’s needs, presenting the network performance information in a more customized and productive way. Thus, a significant amount of work still has to be done for the measurement data and interpretation.
44
Salão de Ferramentas do SBRC 2008
Some initiatives have been directed towards network problems detection. For instance, the Advisor tool1 is a discontinued effort dedicated by NLANR (National Laboratory for Applied Network Research) to the development of an infrastructure that advises users about network status through a user interface, presenting network statistics summarized in graphical images. Another example is Internet 2 Detective2. A java tool developed aiming at providing the user an easy access to network conditions. An additional tool, with similar concept, is NDT (Network Diagnostic Tool)3 which provides network diagnostics to end-users, performing network configuration and performance testing to end users computers under the client/server paradigm. The problem with the majority of these efforts is the way the performance information is provided. In general, users need to cope with information presented in a generic manner and not according to their needs. In these approaches there is too much data which has to be evaluated by end-users or network managers, which even when summarized in nice charts and tables, does not facilitate users’ network applications performance evaluation. These aspects elicit that many issues coping with network monitoring remains open. Performance data interpretation is a difficult task, especially when the observer does not have much knowledge about the traffic monitoring area. Thus, we propose MENTOR4, a tool that comprises a monitoring infrastructure which advises users about a better network usage according to application features. This tool is supported by an ontology knowledge-base, an OSGi Framework, and data from a variety of measurement tools. This paper is organized as follows: Section 2 presents a brief description of works that contributed to this initiative; Section 3 describes the implemented recommendation tool, which tests and evaluation are presented on Section 4; Finally, Section 5 presents the paper’s conclusion.
2. Background To conceive a recommendation tool that provides network performance information in a customized way, it was necessary to take into account related efforts. We’ve taken advantage of a monitoring ontology knowledge-base to construct an intelligent environment, the FLAVOR framework, the ICE visualization tool, and the perfSONAR services. All these initiatives will be described in the next subsections. 2.1 MonONTO MonONTO (Monitoring ONTOlogy) [7] is a domain ontology, bringing together terms related to the domains of advanced applications and their QoS requirements, network monitoring environments, and aspects concerning end-users. Its major goal is to enable the organization of this knowledge and to allow the creation of a knowledge-base comprising information about these domains and the implementation of an expert system which advises users about the network condition and its consequence to the performance of their advanced applications at a given time.
1
http://dast.nlanr.net/Projects/Advisor http://detective.internet2.edu 3 http://e2epi.internet2.edu/ndt/ 4 http://wiki.nuperc.unifacs.br/mentor 2
Salão de Ferramentas do SBRC 2008
45
MonONTO’s additional goals are: Formalize terms and concepts related to the corresponding domains (so they can be processed by computational systems); Clarify relationships and restrictions corresponding to each of those concepts; Elucidate the main properties or attributes that compose each concept; Allow the creation of a knowledge base for the domain of network monitoring and advanced applications for the Internet, thus facilitating information sharing between specific expert systems. In order to solve problems and advise users in decision-making, expert systems need to access a domain knowledge base. Therefore, the effectiveness of an expert system relies heavily on the way the knowledge is represented and on the available mechanisms to explore this knowledge. Hence, the knowledge base needs to be implemented so that the knowledge becomes explicit and readable by the machine. Therefore, these items were carefully considered during construction of the MonONTO; we conducted tests with the inference rules and verified that the axioms and MonONTO’s structure were coherent. 2.2 Framework FLAVOR and ICE visualization tool For the system interaction it was developed a user interface in ICE (Internet Computer network Eye) tool [8] using the network monitoring bundles and Java interfaces from FLAVOR (Framework Layer for Access and Visualization Of network monitoring Resources) [6]. ICE has been developed since 2005 with the initial goal to integrate several network monitoring visualizations into just one environment. During the ICE development it was noted the need for a more flexible and reusable development approach. The code of the application could not be reused inside the application in other contexts or in other tools. For that reason the FLAVOR framework has been designed and used in the development of the newer ICE functionalities to provide the components technology to the ICE environment. FLAVOR is a framework with the goal of providing reusable development in perfSONAR access applications. It is made by Java interfaces and OSGi components that promote the standardization needed by this type of software. With the use of FLAVOR it is possible that any application developed with Java and OSGi to easily make use of perfSONAR measurements. The FLAVOR components can be installed through a local file or a remote URL that points to a file in the Internet. Beyond this, it is also possible the combination, update and removal of bundles through the use of the OSGi capabilities and without the need to do any implementation in the application. In this sense, a recommendation bundle was developed aiming at interacting with the user, applying a questionnaire and providing the recommendation. The bundle can be easily and dinamically plugged into any tool that supports FLAVOR without the need to recompile the source code. 2.3 PerfSONAR Command Line Measurement Point (CL-MP) The PerfSONAR Command Line MP (CL-MP) is a service developed in a joint effort between Internet 2 and RNP (Brazilian Research and Education Network) to build a measurement point that abstracts different established command-line network measurement tools under a standard interface.
46
Salão de Ferramentas do SBRC 2008
The CL-MP main objective is to enable users to run tests across domains with a common language to reach the tools and their results. It basically wraps different network command-line tools using a common XML Schema Language, having a well defined structure, a fact that makes it easy to add new tools. Currently, it can measure network delay, jitter, loss and even MOS through measurement tools like Owamp, Ping and Iperf [1].
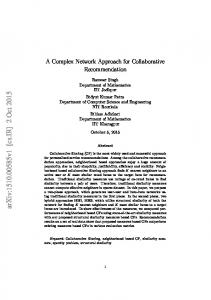
3. The MENTOR Performance Recommendation Tool We have developed and tested the MENTOR recommendation system5 aiming at providing recommendations to the end user about the feasibility of using the applications according to the network conditions emulated in a laboratory environment. The implementation of this tool followed the architecture depicted on Figure where it was able to achieve an infrastructure to gather user information and process recommendations.
Figure 1 - Prototype Architecture.
As shown in Figure 1, the conception of the performance recommendation tool basically includes the development of a user interface, a knowledge-based ontology, an inference mechanism, and the use of network measurement tools. As described in the figure, the first thing to do in order to get a recommendation on MENTOR is to insert parameters such as the source and the destination of the applications being tested, among other parameters. If the application is not previously registered on the knowledge-base the user must find out and provide what are its features. Therefore, a questionnaire is applied in order to provide the user ways to reveal the nature, use and functionality of the application and then the system can findout what are the features of the application. In this way, MENTOR asks the user about: the interactivity of the application − if there is interaction between people on both extremes, if there is only on one side or if there is interaction only between machines −; the degree of interactivity − high (where the communication do not accept delay), medium (communication can happen even if a delay occurs) or low (the application has no interactivity) − and finally, verify the elasticity of the application concerning bandwidth requirements.
5
Available at http:// wiki.nuperc.unifacs.br/mentor
Salão de Ferramentas do SBRC 2008
47
The purpose of these questions is to identify the group or class in which user’s application is included. It is important to note that the user can check the features presented in the application and the description of the suggested class. After confirming such information the system provides a name to the application that will be inserted in the ontology knowledge-base. After discovering the group where the application belongs to, summarized in Table 1, the ontology is analyzed in order to know which tools are necessary to make a recommendation since each application usually have different QoS requirements and different tools to measure them. Such information is also inserted in the ontology. The next step is to obtain the network status. Table 1: Application Groups
Application class
Description
Multimedia Collaboration
It covers the applications that provide the communication of audio and/or video in real time. Interactive and conversational applications.
Multimedia Information Services
Set of applications that provide multimedia contents to users’ database.
Audio-visual services on demand
Applications that provide the transmission of audio and video information from the service provider to the end user.
Multimedia messages
Applications that provide the communication between users through the exchange of multimedia content using the store and forward technique
High Volume Transfer
Group of applications that enables the transfer of large amount of traffic among systems (without user interaction)
Currently, the recommendation is made using the delay of the CLMP Ping Access Bundle, but we intend to use other plug-ins such as the CLMP Bwctl Access Bundle, CLMP Owamp Access Bundle, and CLMP Traceroute Access Bundle to get other measures for network status inferences. With these measures we believe that the results will be more accurate and reliable. After checking the status of the network it is necessary to quantify and qualify these values. The quantification is based on some studies such as ITU-T’s recommendation G.114 that provides the acceptable transmission rates for voice and video [10]. The qualitative recommendation tries to evaluate if the application will run satisfactorily, or not. One way to answer this is by using the MOS (Mean Opinion Score) metric [9], which is a subjective test used by ITU to evaluate the sound quality of human speech on the network. Other studies were performed to obtain similar measures for other applications such as games, data, and simulation [11]. For instance, Table 2 shows qualitative information based on round trip delay measures for some applications which was included on MENTOR’s knowledge-base. MENTOR does an analysis and compares the network data (obtained from the perfSONAR CLMP, using Ping) and the requirements of each application (obtained from MonONTO) to report the performance of the tested applications. The
48
Salão de Ferramentas do SBRC 2008
recommendation is presented to the user, containing a summary of the network state and possible applications' performance. Table 1: Applications qualitative performance based on round-trip delay values.
Excellent
Good
Fair
Poor
Bad
Real Time games
< =50
51 - 150
151 - 200 201 - 250 > 250
VoIP applications
< =150
151- 200
201 - 250 251 - 300 > 300
Video Conference
< =150
151- 200
201 - 250 251 - 300 > 300
Military simulations < =100
101 - 170 171 - 240 241 - 300 > 300
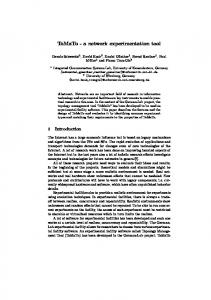
4. System evaluation The developed system was tested in a laboratory environment made up by three machines emulating two network end points under certain performance conditions. The network condition was simulated in the third machine through the FreeBSD Dummynet tool which enables the emulation of a network cloud with diverse end to end performance. Figure shows the test environment setup and the machines configurations. ICE
Application features
Recommend Bundle
Quest application VoIP Application recommendation request
Jess Inference Machine Knowledge-base
PerfSONAR CLMP Owamp MOS Test
VoIP application End point
End to End Communication User
User
Computer A Ubuntu 7.10 kernel 2.6.22-14-generic Intel(R) Pentium(R) 4 CPU 2.26GHz HD 80GB / Mem 512MB eth0: RealTek RTL8139 10/ 100BaseTX – IP 10.1.0.2
Dummynet Network cloud condition simulated
Computer C (Network Cloud)
Computer B Ubuntu 7.04 kernel 2.6.20-16-generic Intel(R) Pentium(R) 4 CPU 2.80GHz HD 80GB / Mem 512MB eth0: RealTek RTL8139 10/ 100BaseTX – IP 10.0.0.2
FreeBSD 6.2-RELEASE Intel(R) Pentium(R) 4 CPU 1.50GHz HD 40GB / Mem 256MB fxp0: rl0: – IP network 1 – 10.0.0.1 rl1: – IP network 2 – 10.1.0.1
Figure 2 – Testing Environment.
As depicted in Figure , the recommendation test is done by a user requesting for an advice about the use of a VoIP application like Skype6. After requesting information about this application through the questionnaire, the system could identify the application’s general features and get the appropriate performance measurement method test (MOS) by the use of first-order rules of the knowledge-based in the inference machine. After identifying that the application’s performance can be obtained by checking the network conditions using the PerfSONAR Owamp CLMP, tests were performed and the
6
http://www.skype.com.
Salão de Ferramentas do SBRC 2008
49
results matched against the recommendation database search results. Based on this comparison the recommendation was made to the user. The recommendation results are presented by a user friendly interface as depicted on Figure 3. This Figure also shows how the recommendation support is easily included on the ICE environment, since it was developed under the FLAVOR concept.
Figure 3 - Recommendation results.
In Figure 3, it is also possible to see in the left window the test result, that predicts an “Excellent” performance for VoIP applications based on a RTT of 0.88 ms. However, in the right window, MENTOR shows a test result that predicts a “Bad” performance for VoIP applications based on a RTT of 399.197ms.
5. Conclusion and Future Work When the end-users look for the network performance information, they actually demand for a good explanation about the network quality perceived by their applications. Technical details, like the available bandwidth, packet loss rate, jitter and delay values are meaningful only to specialist users that have, in general, a strong knowledge about their application QoS requirements. But, for the end-users, it would be better if these performance parameters could be translated into high-level information regarding the application in case. In this work we presented MENTOR, a tool conceived to provide the end user information about the network performance in a more friendly way. In this experience, the knowledge-base ontology demonstrated to be an interesting solution to find applications similarities, since it is a classification schema that also supports assignment of axioms to the concepts presented in this domain, specially the advanced applications. Currently, a MENTOR web version is being developed aiming at facilitating its use. The prototype also relied on the ICE user interface that is a tool already used by international performance measurement workgroups [2]. So, this work collaborates with their efforts. At last, the tests made in a laboratory environment demonstrated that this approach can relieve the network users of the burden of understanding the network problems, and beyond that, receive the information about their application in a productive way. For future work we intend to perform tests on real scenarios with a bigger number of users. In addition, it will be necessary to perform rigorous statistical analysis on the results obtained, since there are several performance metrics broadly used to evaluate
50
Salão de Ferramentas do SBRC 2008
recommender systems [3], such as mean absolute error (MAE), mean squared error (MSE), correlation between predictions and actual ratings, F-measure and so on.
Acknowledgment The authors would like to thank The Brazilian National Research and Education Network (RNP), The Brazilian National Council for Scientific and Technological Development (CNPq), and Bahia’s State Research Foundation (FAPESB) for all its support during the development of this research.
References [1]
Hanemann, A., Boote, J. W., Boyd, E. L., Durand, J., Kudarimoti, L., Lapacz, R., Swany, D. M., Trocha, S., and Zurawski, J. (2005). Perfsonar: A service oriented architecture for multi-domain network monitoring. In Proceedings of the Third International Conference on Service Oriented Computing (ICSOC 2005). ACM Sigsoft and Sigweb. [2] Sampaio, L., Koga, I., Costa, R., Monteiro, H., Vetter, F., Fernandes, G., Vetter, M., Monteiro, J., "Implementing and Deploying Network Monitoring Service Oriented Architectures: Brazilian National Education and Research Network Measurement Experiments", Proceedings of the 5th Latin American Network Operations and Management Symposium (LANOMS 2007), Brazil, September 2007. [3] G. Adomavicius and A. Tuzhilin. "Towards the Next Generation of Recommender Systems: A Survey of the State-of-the-Art and Possible Extensions." IEEE Transactions on Knowledge and Data Engineering, vol. 17, no. 6, June 2005. [4] Burke, R. Knowledge-based Recommender Systems. In A. Kent (ed.), Encyclopedia of Library and Information Systems. Vol. 69, Supplement 32. Marcel Dekker, New York, 2000. [5] Middleton, S. E., De Roure, D. C., and Shadbolt, N. R. 2001. Capturing knowledge of user preferences: ontologies in recommender systems. In Proceedings of the 1st international Conference on Knowledge Capture (Victoria, British Columbia, Canada, October 22 - 23, 2001). [6] Koga, I., Sampaio, L., and Monteiro, J. A. S. “FLAVOR: A dynamic and open framework for the development of network measurement access and visualization tools”. In Proc of The 25th Brazilian Symposium on Computer Networks and Distributed Systems, Belém, PA, 2007, v. 2, p. 665-678. [7] Moraes, P. “MonONTO: A Network Monitoring Ontology for Internet Advanced Applications” (in Portuguese). Master thesis, Universidade Salvador, 2007. [8] Koga, I., Sampaio, L., Monteiro, H., L., and Monteiro, J. A. S. Monteiro. “ICE: A flexible network monitoring access environment”. In Proc of The 25th Brazilian Symposium on Computer Networks and Distributed Systems, Belém, PA, 2007. v. 2, p. 1181-1188. [9] ITU-T recommendation P.800.1, “Mean Opinion Score (MOS) terminology”, July 2006. [10] Szigeti , T e Hattingh , C. (2004). End-to-End QoS Network Design – Quality of Service in LANs, WANs, and VPNs. Cisco Press, novembro, 2004. [11] Henderson, T e Bhatti, S. Networked games — a QoS sensitive application for QoSinsensitive users?. ACM 2003.